

Abstract
Many bioactive natural products are produced as “secondary metabolites” by plants, bacteria, and fungi. During the middle of the 20th century, several secondary metabolites from fungi revolutionized the pharmaceutical industry, for example, penicillin, lovastatin, and cyclosporine. They are generally biosynthesized by enzymes encoded by clusters of coordinately regulated genes, and several motif-based methods have been developed to detect secondary metabolite biosynthetic (SMB) gene clusters using the sequence information of typical SMB core genes such as polyketide synthases (PKS) and non-ribosomal peptide synthetases (NRPS). However, no detection method exists for SMB gene clusters that are functional and do not include core SMB genes at present. To advance the exploration of SMB gene clusters, especially those without known core genes, we developed MIDDAS-M, a motif-independent de novo detection algorithm for SMB gene clusters. We integrated virtual gene cluster generation in an annotated genome sequence with highly sensitive scoring of the cooperative transcriptional regulation of cluster member genes. MIDDAS-M accurately predicted 38 SMB gene clusters that have been experimentally confirmed and/or predicted by other motif-based methods in 3 fungal strains. MIDDAS-M further identified a new SMB gene cluster for ustiloxin B, which was experimentally validated. Sequence analysis of the cluster genes indicated a novel mechanism for peptide biosynthesis independent of NRPS. Because it is fully computational and independent of empirical knowledge about SMB core genes, MIDDAS-M allows a large-scale, comprehensive analysis of SMB gene clusters, including those with novel biosynthetic mechanisms that do not contain any functionally characterized genes.
Introduction
Chemists have been deciphering the chemical structures of natural products for a century and a half. Many of these natural products are produced as “secondary metabolites” by plants, bacteria, and fungi. During the middle of the 20th century, several secondary metabolites from fungi revolutionized the pharmaceutical industry. These include the antibiotic, penicillin; the cholesterol-level lowering compound, lovastatin; and the immune suppressor, cyclosporin. Other fungal secondary metabolites have achieved notoriety, such as aflatoxin [1]. In the late 20th century, with the advent of gene cloning, it became apparent that fungal secondary metabolites are biosynthesized by clusters of coordinately regulated genes. Such gene clustering is rare in eukaryotes.
In spite of limited number of secondary metabolites identified from a single species, sequencing the genomes of filamentous fungi has revealed far more than the expected numbers of secondary metabolite biosynthetic (SMB) genes. The numbers of SMB genes encoding polyketide synthases (PKSs) and non-ribosomal peptide synthetases (NRPSs) range from 17–35 and 14–24, respectively, in the individual genomes of eight Aspergillus species [2]. To identify potential secondary metabolites (SMs) in filamentous fungi, various bioinformatics tools, including SMURF [3], antiSMASH [4], [5], CLUSEAN [6], and the method described by Andersen et al. [7], have been developed and successfully applied. The basic concept underlying these tools is the existence of SMB gene clusters, which typically contain approximately 20 genes, including the so-called core genes of PKS, NRPS, or dimethylallyl tryptophan synthases (DMATs). These methods are completely dependent on the known sequence motifs of the core genes; therefore, they can only be used to detect SMB gene clusters that include these core genes. In addition, they cannot distinguish functional clusters from silent or cryptic clusters in fungi [8] because they do not incorporate transcriptomics data.
Many secondary metabolites with important medicinal activities have scaffold structures that are mostly synthesized by the core genes of PKS or NRPS, but there are also others independent of those core genes such as oxylipins, a derivative of fatty acids [9]. We recently discovered the SMB gene cluster for kojic acid (KA), which is the representative secondary metabolite of Aspergillus oryzae [10], [11]. The KA cluster could not be detected by conventional methods due to the lack of the core genes. KA was discovered in 1907 and has been used industrially [12], but its biosynthetic gene cluster was found only recently. This fact indicates the extreme difficulty in identifying SMB gene clusters without any core genes.
Comparative genomics has shed light on the characteristics of SMB genes that localize to so-called non-syntenic blocks (NSBs) [13]–[15]. NSBs harbor genes that have roles in the transport and metabolism of various compounds [13] and are highly divergent between species [16]–[18]. Two-thirds of the genes in NSBs are not homologous with any genes with known functions [13]. Considering our limited knowledge regarding SMB genes and their high level of diversity, it can be speculated that the significant accumulation of unknown genes on NSBs is due to the presence of a large number of SMB genes on NSBs. In support of this hypothesis, the KA gene cluster is located in an NSB [11].
To enhance the exploration of SMB gene clusters in fungal genomes, especially those without core genes, we have developed MIDDAS-M, a motif-independent de novo detection algorithm for secondary metabolite gene clusters. We used virtual gene cluster generation on an annotated genome sequence integrated with highly sensitive and accurate scoring for the cooperative transcriptional regulation of cluster member genes. MIDDAS-M accurately predicted 38 SMB gene clusters in 3 fungal strains that have been experimentally confirmed and/or predicted by other motif-dependent methods. In addition, we discovered a novel SMB cluster with a potentially new mechanism of cyclic peptide biosynthesis using MIDDAS-M. The cluster was experimentally validated to perform ustiloxin B biosynthesis. Because it is fully computational and independent of empirical knowledge about SMB core genes, MIDDAS-M permits a large-scale, comprehensive analysis of SMB gene clusters, including those with novel biosynthetic mechanisms that do not contain any functionally characterized genes.
Results
MIDDAS-M algorithm
The algorithm depends on the concurrent expression of SMB cluster member genes. First, all possible gene clusters (virtual clusters, VCs) are identified in a previously gene-annotated genome by moving a frame with a given cluster size (ncl) from 3 to 30 genes (Fig. 1A). The cluster induction ratio (M score) for a VC is calculated by summing the induction ratios of all genes in the VC. For a given gene, the induction ratio is determined by dividing the expression level of the gene in an SM-producing condition by the expression level in a non-SM-producing condition. The Mi,ncl score for each VC, which begins at gene i with cluster size ncl, was determined according to the following equation:
| (1) |
where mk is the induction ratio of gene k, and  and σm are the mean and the standard deviation of all m values, respectively. As shown in Equation 1, each m value should be normalized by Z-score transformation before the summation. M scores are evaluated for each ncl from 3 to an appropriate upper limit (30 in this study). Using this procedure, the M scores of “non-real” clusters in which genes are not co-regulated should have low absolute values because positive values are cancelled out by negative values, and vice versa. In contrast, M scores of “real” SMB clusters show significantly high absolute values because the genes in the cluster are regulated concurrently (Fig. 1B).
Figure 1. Principle of the MIDDAS-M algorithm.

(A) Virtual cluster (VC) generation for SMB gene cluster detection. Gene clusters on a genome are evaluated comprehensively by a moving window with a specific cluster size; the cluster size can be changed from 3 to 30 or another appropriate size. (B) Schematic representation of MIDDAS-M. Candidate SMB gene clusters show large deviations from the standard deviation after summing the induction ratios of member genes and statistical enhancement. (C) Flow chart of the MIDDAS-M algorithm.
SMB cluster candidates exhibit relatively high M scores, but the background noise from pseudo-positive VCs remains high (Fig. 2B). To help distinguish between VCs that are SMB clusters and those that are not, M scores deviating from the normal distribution are magnified by statistical treatment. The magnified score, ωi,ncl, was evaluated for each Mi,ncl at each ncl using the following equation:
| (2) |
where  ncl and σM,ncl are the mean and the standard deviation, respectively, of all M scores at ncl, d is a positive odd integer as an order of the moment (set as 3 in this study), and Pi,ncl is the occurrence probability of Mi,ncl in the distribution of all M scores at ncl. The moment expresses the magnitude of deviation from standard distribution, being emphasized as the order d increases. An SMB cluster candidate with Mi,ncl largely deviated from the mean value shows a large absolute value of ωi,ncl, because of the large Z-score (the content in the parenthesis of Equation 2) and the logarithmic Pi,ncl (<<1) converging to minus infinity. The ω score shows a positive or negative value when the gene cluster is induced or repressed, respectively.
Figure 2. Behavior and performance of MIDDAS-M in A. oryzae.

(A) Histograms of M scores at ncl = 1, 3, 5, 7, and 10 in the transcriptomes at 7 vs. 4 days of cultivation in kojic acid (KA)-production medium. The symmetry broke at a cluster size of 3 because of the emergence of large M scores due to the induction of the KA cluster genes. Arrows at the termini of the x-axis indicate the smallest and the largest values. (B) Emergence of a ωmax peak by MIDDAS-M from the raw induction ratio. The x-axis designates relative position of the genes on the A. oryzae RIB40 genome when eight chromosomes are concatenated into one. The y-axis scales are the same for all three datasets in the same raw. The ωmax peak indicated by the red arrow corresponds exactly to the three genes responsible for KA production.
For each starting gene, the ncl showing the largest ω value (ωmax) is chosen as the cluster size. This step contributes to the high sensitivity of MIDDAS-M by surveying clusters of different sizes. Finally, the clusters showing the largest ωmax among overlapping VCs (sub-clusters of a candidate cluster) are defined as the “unique” cluster (detailed explanation with an example is described in the “MIDDAS-M computation” section of the Supplementary Method in Appendix S1). MIDDAS-M also automatically generates the candidate clusters from all possible pairwise comparisons of transcriptomes from several or more culture conditions. This allows comprehensive de novo predictions using large-scale transcriptome datasets based on a variety of culture conditions. See Supplementary Method, the “MIDDAS-M computation” section in Appendix S1 for further details. MIDDAS-M is available for use at the following server (http://133.242.13.217/MIDDAS-M).
Accurate detection of experimentally validated SMB gene clusters
MIDDAS-M was applied to the filamentous fungus A. oryzae for the detection of the KA gene cluster. This metabolite is an inhibitor of pigment formation in animal tissues and is therefore used as a skin-whitening compound in cosmetics [19], [20]. The KA cluster was recently found to be composed of only three genes, none of which encodes a PKS, NRPS, or other core SMB enzyme. Instead, the three genes encode an oxidoreductase, a Zn(II)2-Cys6 (C6)-type transcription factor, and a major facilitator superfamily transporter [10], [11]. KA production is typically observed after 3 to 4 days of inoculation of A. oryzae in liquid growth media, and can be stopped by adding a small amount of sodium nitrate to the medium [21], [22].
Figure 2 shows the results of MIDDAS-M analysis for three A. oryzae transcriptomes in the relative transcription observed under KA-inducing vs. KA-non-inducing conditions in two-color DNA microarray experiments; 4 vs. 2 days, 7 vs. 4 days, and without vs. with nitrate. Among the 12,084 genes of A. oryzae [13], 5,046 genes with expression in all three datasets were used for the analysis. The M scores for the 7/4-day dataset are normally distributed when the cluster size ncl = 1, but the symmetry was lost, and the top of the distribution slid to the left, when ncl = 3 and 5, accompanied by the emergence of large M scores outside of the normal distribution (Fig. 2A). MIDDAS-M emphasizes this deviation of the SMB cluster candidates through Equation 2, enabling their sensitive detection. In the 7/4-day dataset, a distinct single peak emerged in the ωmax score from the gene induction ratio (m value) as designated by a red arrow in Fig. 2B. The gene cluster corresponding to this peak was composed of three genes, AO090113000136, AO090113000137, and AO090113000138, which were exact matches to the three KA biosynthetic genes [10], [11]. The highly sensitive and specific detection of the KA gene cluster, which has a small cluster size of 3 and does not include any core genes, indicates that MIDDAS-M has strong potential as a motif-independent predictor of SMB gene clusters. In the 4/2-day and without/with nitrate datasets, only small ωmax signals were observed, indicating that the increase of KA productivity in the two datasets was not due to the transcriptional induction of the genes responsible for KA biosynthesis.
MIDDAS-M was also tested for Fusarium verticillioides using a time series of four transcriptomes obtained from mycelia grown in the liquid medium used to induce fumonisin production [23]. This fungus is a plant pathogen that produces mycotoxins and is phylogenetically distantly related to Aspergillus. A comprehensive comparison of the 4 transcriptomes followed by the MIDDAS-M prediction yielded several distinct peaks of ωmax, of which 5 corresponded to the known SMB gene clusters for fumonisin [24], perithecium pigment [23], fusaric acid [23], bikaverin [25], and fusarin [23] (Fig. 3). Although the size of the predicted SMB gene cluster for fusaric acid was three-fold larger than the experimentally validated clusters, the others were almost correct in size (Table 1). This result clearly illustrates the high sensitivity of MIDDAS-M in detecting functional SMB clusters.
Figure 3. Clear detection of known SMB gene clusters in F. verticillioides by MIDDAS-M.
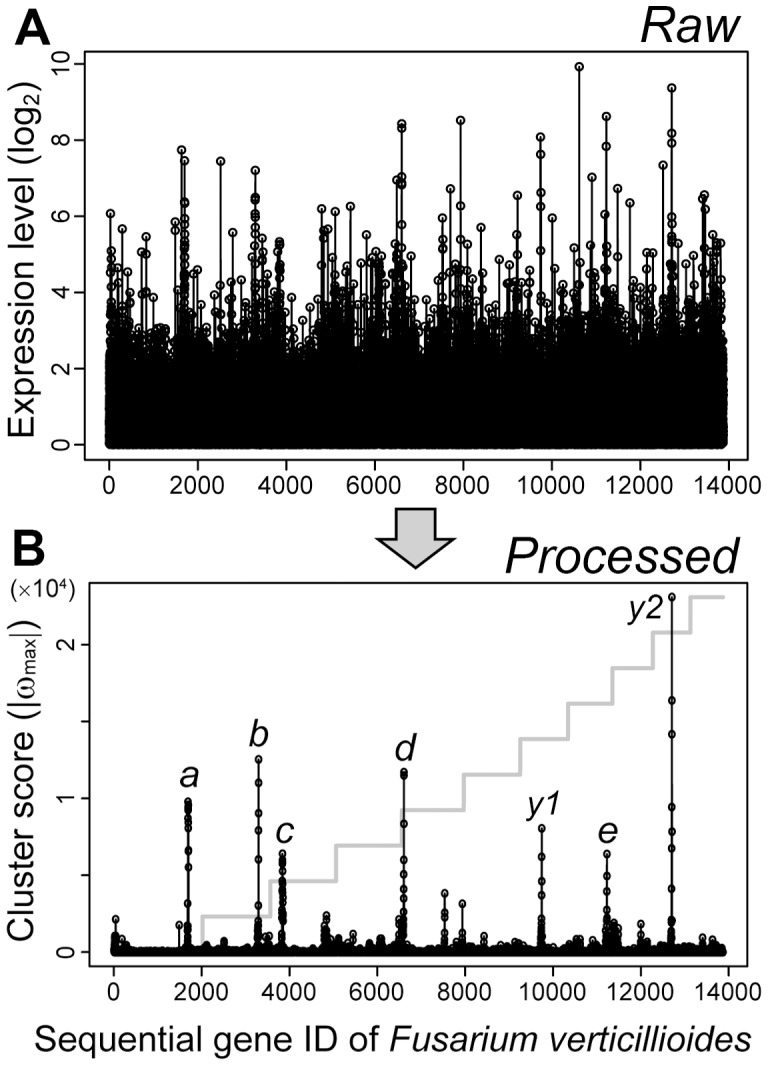
(A) Expression levels of each gene on the F. verticillioides genome in 4 samples of a transcriptome time series at 24, 48, 72, 96 h in liquid fumonisin-inducing media. The highest value of the 4 expression levels was plotted for each gene. (B) Absolute maximum cluster scores (|ωmax|) by the comprehensive pair-wise calculation (4C2) for each gene detected from the same transcriptome data as A. The step line plot in gray denotes the individual chromosomes. The peaks designated by a through e correspond to the 5 experimentally validated SMB clusters: a, fumonisin; b, perithecium pigment; c, fusaric acid; d, bikaverin; e, fusarin. Two peaks to which any known gene clusters do not correspond were designated as y1 and y2.
Table 1. Experimentally-validated or SMURF-annotated SMB gene clusters detected by MIDDAS-M.
| Fungus | Compound/SMURFa | ωmax | Gene IDb | Cluster size | Source | |
| MIDDAS-Mc | Otherd | |||||
| A. oryzae | Kojic acid | 9544 | AO090113000136 - AO090113000138 | 3 | 3 | [10], [11] |
| F. verticillioides | Bikaverin (Cluster 7) | 11708 | FVEG_03379 – FVEG_03383 | 4 | 6 | [25], SMURF |
| Fumonisin (Cluster 3) | 9780 | FVEG_00316 – FVEG_00329 | 14 | 15 | [24], SMURF | |
| Fusaric acid (Cluster 27) | 6398 | FVEG_12519 – FVEG_12535 | 17 | 5 | [23], SMURF | |
| Fusarin | 840 | FVEG_11078 – FVEG_11086 | 9 | 9 | [23], SMURF | |
| Perithecium pigment (Cluster 9) | 12533 | FVEG_03696 – FVEG_03699 | 6 | 4 | [23], SMURF | |
| Cluster 10 | 1700 | FVEG_05526 – FVEG_05530 | 5 | 10 | SMURF | |
| Cluster 24 | 866 | FVEG_11927 – FVEG_11931 | 5 | 7 | SMURF | |
| A. flavus | Aflatoxin (Cluster 54) | 99087 | AFLA_139150 - AFLA_139320 | 18+5 | 29 | [37], SMURF |
| 24302 | AFLA_139370 – AFLA_139410 | |||||
| Aflatrem | 3670 | AFLA_096380 - AFLA_096400 (ATM1) | 3 | 3 | [44]; Blastn, E0.0 | |
| (Cluster 14) | 8984 | AFLA_045490 - AFLA_045540 (ATM2) | 6 | 5 | ||
| Cyclopiazonic acid | 36281 | AFLA_139460 – AFLA_139490 | 4 | 3 | [45] | |
| Gliotoxin-like (Cluster 22) | 32872 | AFLA_064380 – AFLA_064590 | 22 | 26 | Annotation, SMURF | |
| Kojic acid | 8273 | AFLA_096030 - AFLA_096060 | 4 | 3 | [10], [11]; Blastp, E0.0 | |
| Ustiloxin B | 21857 | AFLA_094940 – AFLA_095110 | 18 | ? | This study | |
| Cluster 3 | 7369 | AFLA_005320 - AFLA_005350 | 4 | 8 | SMURF | |
| Cluster 5 | 1960 | AFLA_006170 - AFLA_006190 | 3 | 7 | SMURF | |
| Cluster 7 | 5193 | AFLA_009980 - AFLA_010030 | 6 | 8 | SMURF | |
| Cluster 8 | 9341 | AFLA_010600 - AFLA_010630 | 4 | 10 | SMURF | |
| Cluster 10 | 18356 | AFLA_023000 – AFLA_023040 | 5 | 15 | SMURF | |
| Cluster 17 | 1423 | AFLA_054370 – AFLA_054390 | 3 | 25 | SMURF | |
| Cluster 18 | 1072 | AFLA_060030 - AFLA_060050 | 3 | 15 | SMURF | |
| Cluster 19 | 26351 | AFLA_060660 - AFLA_060700 | 5 | 9 | SMURF | |
| Cluster 20 | 2079 | AFLA_062820 - AFLA_062900 | 9 | 18 | SMURF | |
| Cluster 21 | 8227 | AFLA_064260 - AFLA_064330 | 8 | 21 | SMURF | |
| Cluster 23 | 5702 | AFLA_066690 – AFLA_066720 | 4+6 | 33 | SMURF | |
| 2888 | AFLA_066890 - AFLA_066940 | |||||
| Cluster 24 | 4508 | AFLA_069320 - AFLA_069340 | 3 | 10 | SMURF | |
| Cluster 25 | 4219 | AFLA_070860 – AFLA_080890 | 4+4 | 26 | SMURF | |
| 5148 | AFLA_070910 - AFLA_070950 | |||||
| Cluster 27 | 2012 | AFLA_082140 - AFLA_082160 | 3 | 14 | SMURF | |
| Cluster 33 | 5797 | AFLA_101700 - AFLA_101770 | 8 | 6 | SMURF | |
| Cluster 36 | 1026 | AFLA_105410 – AFLA_105450 | 5 | 5 | SMURF | |
| Cluster 37 | 13236 | AFLA_108550 – AFLA_108580 | 4 | 18 | SMURF | |
| Cluster 41 | 2503 | AFLA_116130 – AFLA_116150 | 3+3 | 26 | SMURF | |
| 1331 | AFLA_116170 – AFLA_116190 | |||||
| Cluster 44 | 6277 | AFLA_118390 – AFLA_118410 | 3 | 11 | SMURF | |
| Cluster 45 | 2494 | AFLA_118940 – AFLA_119000 | 7 | 19 | SMURF | |
| Cluster 46 | 4420 | AFLA_119080 - AFLA_119120 | 5 | 6 | SMURF | |
| Cluster 47 | 12300 | AFLA_121470 - AFLA_121540 | 8 | 8 | SMURF | |
| Cluster 49 | 1429 | AFLA_128030 - AFLA_128110 | 9 | 13 | SMURF | |
| Cluster 53 | 2813 | AFLA_137830 – AFLA_137860 | 4+3 | 15 | SMURF | |
| 1844 | AFLA_137890 – AFLA_137910 | |||||
The detection threshold is >95th quantile (false positive rate 0.05).
The most induced combinations of culture conditions are listed in Appendix S2.
aClusters with numbers are those predicted by SMURF. The list of the predicted gene clusters can be downloaded from http://jcvi.org/smurf/precomputed.php.
bGene IDs are for annotated genome sequences in GenBank (A. oryzae, F. verticillioides, and A. flavus) as described in Appendix S1.
cTwo numbers are described when the predicted clusters are divided into two regions and represent the corresponding clusters.
dCluster size experimentally validated or predicted by SMURF (refer to Source in detail).
The cluster harboring fusaric acid biosynthetic genes (peak c in Fig. 3B) was predicted to have 17 genes (FVEG_12519−FVEG_12535) by MIDDAS-M, whereas the cluster size reported by Brown et al was 5 (FVEG_12519−FVEG_12523) [23] (Table 1, Fig. S2 in Appendix S1). The gene expression profile in this region suggests existence of another cluster adjacent to the fusaric acid gene cluster with a few additional genes in between (Fig. S2 in Appendix S1). One of the remarkable features of MIDDAS-M is the potential to predict a gene cluster even though it includes a small number of genes that are not co-regulated with other cluster member genes. This enables sensitive detection of gene clusters from the dataset containing inaccurate data points due to their low expression levels and/or biological fluctuation under the same condition. It is thought that this characteristic led to the prediction of the above cluster much longer than the actual size by combining the two clusters into one. In addition to detecting the five clusters noted above, this analysis revealed two other VCs with high ωmax scores (y1 and y2 in Fig. 3B). They were not predicted by SMURF, and were composed of 3 and 4 genes, respectively, the latter of which included an NRPS-like enzyme (Fig. 3B, Table S2 in Appendix S1). To assign peaks to their corresponding compounds, detailed analysis of the linkage between the gene cluster expression and compound productivity is necessary.
Large-scale detection of SMB gene clusters by MIDDAS-M
To demonstrate the fully computational and motif-independent features of MIDDAS-M for the comprehensive analysis of SMB gene clusters, we employed a systematic pairwise comparison of A. flavus 28 transcriptome datasets from a variety of cultivation conditions (GSE15435 [26], Fig. 4A). MIDDAS-M detected 240 candidate clusters with the threshold of 0.05 for the statistical likelihood of false positives (ωmax ≥1,016.7) in a total of 378 pairs of datasets. The results included all 4 experimentally-validated clusters, those for aflatoxin, aflatrem, cyclopiazonic acid, and KA (Table 1). Using the datasets above, twenty-seven of the 55 clusters predicted by SMURF were detected by MIDDAS-M (Table 1). Secondary metabolites tend to be produced under only limited culture conditions; in other words, SMB genes are silent under most conditions. In addition, many SMB-like gene clusters may have possibly lost their functions. For example, A. oryzae has the gene cluster homologous to that for aflatoxin in A. flavus, but never produces the compound due to mutations both inside and outside the cluster [27]. SMURF, which uses only genome sequence information, predicts clusters regardless of their silence or non-functionality. In contrast, MIDDAS-M excludes non-functional SMB gene clusters in defined culture conditions. Similarly, MIDDAS-M predicted 35 of the 76 candidate clusters predicted by antiSMASH (the column D in the “antiSMASH.AF” sheet in Appendix S2). Certain peaks were detected under only limited combinations of conditions, illustrating the utility of MIDDAS-M for the comprehensive analysis of culture conditions that induce rarely expressed SMB genes (Fig. 4B). For example, the peak circled in Fig. 4B detected only in a limited conditions, composed of AFLA_035680 through AFLA_035720, was not detected either by SMURF or by antiSMASH.
Figure 4. SMB gene cluster detection by MIDDAS-M in A. flavus.

(A) A 3D view of the ωmax scores for all genes and combinations of culture conditions. Comprehensive detection of SMB gene clusters was performed on all 378 pairwise combinations of culture conditions from 28 transcriptomes. The gray and green areas denote blocks of synteny and non-synteny, respectively, with the A. nidulans genome. The positions of gene clusters possessing PKS and NRPS core genes predicted by SMURF are shown in orange and blue, respectively. The chemical structures of four A. flavus secondary metabolites are shown at the positions of corresponding SMB gene clusters; the ustiloxin B gene cluster was first identified in this paper. (B) Magnified view of the area on chromosome 2 corresponding to the black square in A. As an example, a yellow circle designates the peak observed specifically at particular positions, from which conditions for producing the corresponding compound were determined.
The detected peaks were highly localized to NSBs (702 detected cluster genes out of 969 total; see Table S3 in Appendix S1). This result is in good agreement with the fact that the genes related to secondary metabolite biosynthesis, transport, and catabolism (Q-genes), identified in the EuKaryotic Orthologous Groups (KOG) [28], [29] on NSBs [13]. In addition, the detected gene clusters were enriched for Q-genes compared with the whole genome, regardless of their inclusion of core genes (SMURF+/−) (Fig. 5A). Genes annotated as cytochrome P450 enzymes, which constitute a large enzyme family often involved in SMB gene clusters [30], represent 1.1% of the 13,471 genes in the A. flavus genome, and are contained in 9.1% of the 240 unique clusters detected by MIDDAS-M. The P450 gene content in the detected gene clusters increased drastically to >60%, by applying threshold ωmax ≥15,800 (Fig. 5B), although the number of clusters decreased exponentially along with increasing the threshold of ωmax score (24 clusters when ωmax ≥10,000, Fig. S3 in Appendix S1). SMB clusters are often regulated by C6-type transcription factors [31], and major facilitator superfamily (MFS) transporters are often present in SMB clusters [32]. These two genes also appear more frequently in the clusters as the threshold increased. Among 240 candidate SMB gene clusters detected by MIDDAS-M with the threshold of 0.05 false positive rate, 89% (213) were not detected by SMURF (Table S3 in Appendix S1), and this tendency continued when ωmax >10,000 (71% or 17 in 24). These results strongly suggest that MIDDAS-M detected clusters of SMBs even when the clusters did not include the core genes. Detection of the KA cluster is the typical example. The ustiloxin B biosynthetic gene cluster, which was first detected by MIDDAS-M and experimentally-validated in this study, is another good example. These two clusters are both lacking known core genes, thus have never been predicted by the existing software tools based on sequence information of core genes, such as SMURF and antiSMASH (see detail in the next section). Use of high threshold of ωmax and gene functional information will increase accuracy of predicting SMB gene clusters, though it may fail to detect novel SMB clusters.
Figure 5. Frequency of SMB-related genes in clusters detected by MIDDAS-M.
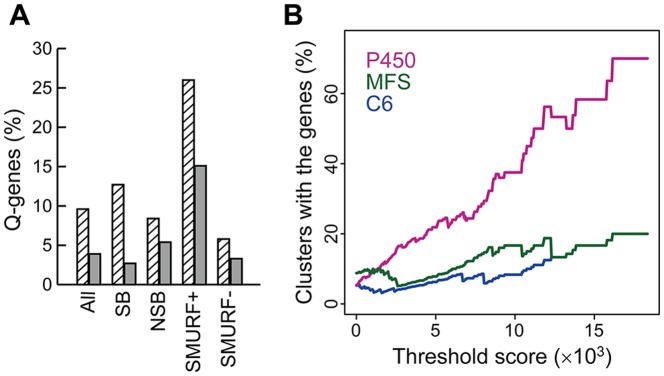
(A) Ratios of SMB-related genes (Q-genes) detected by KOG analysis with the cluster genes detected by MIDDAS-M (hatched bars) and all the genes in the corresponding genome (gray bars). (B) The proportion of clusters containing genes annotated as P450 enzymes (pink), C6 transcription factors (blue), and major facilitator superfamily members (green) were calculated for detected clusters with the threshold score of ωmax in A. flavus. The value is plotted to a ωmax of 18,350, at which 10 clusters remain to be detected.
Identification of a novel ustiloxin B gene cluster by MIDDAS-M
The comprehensive analysis of A. flavus transcriptomes by MIDDAS-M revealed a pair of culture conditions (cracked maize at 28°C versus 37°C) that showed 3 distinct peaks: the first peak corresponded to the aflatoxin biosynthetic gene cluster; the second peak to a putative cluster (designated cluster a) consisting of 18 genes (AFLA_094940−AFLA_095110; gene ID interval = 10 in most cases); and the third peak to a putative cluster (cluster b) consisting of 5 genes (AFLA_039200−AFLA_039240) (Fig. 6A). To identify the compounds produced by clusters a and b, we constructed three types of A. flavus deletion mutants for each cluster using pyrG as a selectable marker. For cluster a, mutant ΔAF_a had 13 genes (ΔAFLA_094940−AFLA_095060) deleted, mutant ΔAF_a_4960 had one gene (ΔAFLA_094960) deleted, and mutant ΔAF_a_5040 had one gene (ΔAFLA_095040) deleted. For cluster b, mutant ΔAF_b had five genes (ΔAFLA_039200−AFLA_039240) deleted, mutant ΔAF_b_9210 had one gene (ΔAFLA_039210) deleted, and mutant ΔAF_b_9230 had one gene (ΔAFLA_039230) deleted (Fig. S1 and Table S1 in Appendix S1). The deletion mutant lacking the entire aflatoxin cluster and the pyrG revertant were also constructed as positive controls. After solid cultivation of the 7 deletion mutants and the control strain (pyrG revertant) on cracked maize at 28°C for 7 days, water-soluble metabolites were analyzed by high-performance liquid chromatography-mass spectrometry (HPLC-MS). By comparing metabolite profiles between mutants, we found a negative ion spectrum at m/z 644.2 with a retention time (RT) of 8.9 min that was absent only in water extracts from the three deletion mutants corresponding to cluster a (Figs. 6B, 6C). Ultra-performance liquid chromatography-high-resolution mass spectrometry (UPLC-HRMS) showed that the accurate mass of the corresponding ion was 646.240 [M+H]+ and 644.231 [M-H]− with UV absorption at 290, 250, and 209 nm. By searching an organic compound database, we found that these measurements corresponded to ustiloxin B (C26H39N5O12S; MW 645.681). Ustiloxin B was first isolated as a water-soluble component of false smut balls on rice panicles infected by the fungus Ustilaginoidea virens [33]–[35]. The HPLC-purified compound from the water extract of the control strain (pyrG revertant) was compared with a ustiloxin B standard using UPLC-HRMS. The two compounds showed identical mass spectra with an RT of 1.61 min (Fig. 6D) as well as identical peaks in the extracted ion chromatogram at m/z 644.231 [M-H]− and in the UV spectra at 290, 254, and 220 nm (Fig. 6E). These results provide the first evidence that the genes AFLA_094960 and AFLA_095040 are responsible for ustiloxin B biosynthesis, indicating that cluster a, composed of AFLA_094940 through AFLA_095110, is a ustiloxin B biosynthetic cluster.
Figure 6. Identification of the ustiloxin B cluster in A. flavus based on the MIDDAS-M prediction.

(A) MIDDAS-M results from a combination of culture conditions in maize at 28°C versus 37°C. The leftmost distinct peak corresponds to the aflatoxin gene cluster. The other two peaks were designated as clusters a and b. The step line plot in gray denotes the chromosomes. (B) Peaks at a retention time of 8.9 min detected in the extracted ion chromatograms of m/z 644.2±0.1 in negative ion mode were not observed in the A. flavus deletion mutants of the genes in cluster a (red). Chromatograms are for medium only (blue, negative control), the control strain (pyrG revertant, black), the aflatoxin cluster deletion mutant, and three mutants with deletions in cluster b (gray). (C) The mass spectra at of the 8.9 min retention peaks in the control strain (above) and the deletion mutant ΔAF_a (below). The MS peak of m/z 644.2 in the control strain was not present in the deletion mutant. (D) Comparison of the mass spectra for ustiloxin B and the compound with m/z 644.2 (in negative ion mode) isolated from the control strain. (E) Comparison of the chromatograms of the ustiloxin B reference standard and the compound isolated in this study. The extracted ion chromatogram of m/z 644.23 in negative ion mode and UV chromatograms at 290, 254, and 220 nm are indicated.
Based on its chemical structure, ustiloxin B is likely characterized as a non-ribosomal peptide. One of the genes responsible for producing ustiloxin B, AFLA_095040, was putatively annotated as an NRPS-like enzyme in the NCBI database (gene ID: 7917917). However, the AFLA_095040 gene contains only the catalytic domain of a pyridoxal 5′-phosphate-dependent enzyme from aminotransferase family-5, which must be involved in reactions other than non-ribosomal peptide bond biosynthesis (Fig. S4 in Appendix S1 and the “ust” sheet in Appendix S2). Moreover, none of the NRPS-specific catalytic domains (A, C, PCP, or TE) were found in any genes in or near the cluster (AFLA_094930−AFLA_095170), as determined by a BLAST [36] search against the UniProtKB database [37], [38]. Accordingly, the cluster was not detected by SMURF (http://jcvi.org/smurf/precomputed.php), antiSMASH (the “antiSMASH.AF” sheet in Appendix S2), or other currently available conventional SMB gene cluster prediction methods, which use catalytic domain sequence motif information. This result clearly indicates that MIDDAS-M has potential use as a motif-independent predictor of functional SMB gene clusters.
Discussion
In this work, we described the first sequence motif-independent algorithm for the discovery of functional fungal SMB gene clusters based on a combination of whole genome sequence data and transcriptome information. To achieve this novel and fully computational approach, we combined an algorithm to generate comprehensive virtual gene clusters on a genome of interest with the statistical processing of signal enhancement based on deviation from a standard distribution for transcriptional induction or repression of a cluster. First, we confirmed that our algorithm, MIDDAS-M, accurately detected experimentally validated SMB gene clusters, including the fumonisin, aflatoxin/sterigmatocystin, and KA clusters, from DNA microarray datasets obtained under culture conditions associated with the production and non-production of these compounds. In contrast to the former 3 clusters, the KA gene cluster does not include any genes considered as core SMB genes, such as PKSs, NRPSs, DMATs, or terpene cyclases (TCs). The KA gene cluster predicted by MIDDAS-M was the sole candidate with a correct cluster size. Nine gene disruption experiments were required to identify this cluster without MIDDAS-M prediction in our previous work using the same transcriptomes [11].
The fully computational and motif-independent feature of MIDDAS-M allowed for the comprehensive analysis of SMB gene clusters based on expression differences in a given pair of multiple transcriptomes. Because little is known about SMB gene clusters other than those containing PKS, NRPS, TC, and DMATS, the validation of the MIDDAS-M results is extremely difficult. Nonetheless, based on the MIDDAS-M prediction, we identified the first SMB gene cluster for ustiloxin B, the non-ribosomal peptide-like compound that inhibits microtubule assembly [35], in A. flavus. Although ustiloxin B was identified more than 20 years ago, the ustiloxin B biosynthetic gene cluster had remained unknown until the present study. The lack of the NRPS catalytic domains A, C, PCP, and TE in all genes both in the cluster and within 10 adjacent genes outside the cluster strongly suggests a novel mechanism for cyclic peptide biosynthesis. Our further deletion experiments and sequence analysis revealed that at least 3 genes with unknown functions (AFLA_094970, AFLA_094980, and AFLA_094990) may be involved in the peptide bond synthesis and cyclization of the compound, supporting the idea above (data not shown). However, there still remains a possibility that additional gene encoding an NRPS for the ustiloxin biosynthesis may be located distantly from the cluster.
MIDDAS-M enables the highly sensitive identification of SMB gene clusters, but the predicted cluster sizes may be smaller than the actual cluster sizes in some cases. For example, the aflatoxin gene cluster of A. flavus is composed of 29 genes from AFLA_139150 through AFLA_139440 [39], [40], but MIDDAS-M detected 23 genes, AFLA_139150 through AFLA_139410 (excluding AFLA_139330 – AFLA_139360). This discrepancy is most likely due to the Z-score transformation at each ncl used to normalize M scores before enhancement. When information from a candidate gene cluster(s) is included at a certain ncl, the standard deviation used for the denominator in Z-score transformation increases. As a result, the M score(s) of the strongly positive gene cluster tend to be smaller at the correct size. This factor does not affect the detection sensitivity of cluster positions but does affect the cluster boundary detection. One potential solution for this problem is to use another algorithm, such as co-expression analysis, for the precise prediction of cluster boundaries after the sensitive detection of cluster candidates by MIDDAS-M.
There are more than 100,000 fungal species in nature [41] that are potential producers of bioactive compounds [31]. Because fungal SMB genes are highly divergent [16], [42], [43], even fungal species closely related to those that have already been sequenced are worth sequencing to discover new SMB genes. We have confirmed that MIDDAS-M performs equally well when using transcriptomes from RNA-seq data in a comparative performance with DNA microarray for SMB gene cluster detection. MIDDAS-M enables the comprehensive exploration of functional SMB genes in fungal genomes by effectively utilizing the vast amount of available genome and transcriptome information, which will accelerate the discovery of biosynthesis or other functional categories of genes in the future.
Supporting Information
Experimental details pertaining to the algorithm execution using transcriptome data, gene disruption, and the identification of ustiloxin B.
(DOCX)
The comprehensive MIDDAS-M prediction data for F. verticillioides (the “F.verticillioides” sheet) and A. flavus (the “A.flavus” sheet), the functional annotations of genes in or near the ustiloxin B cluster found by BLAST against UniProtKB (the “ust” sheet), and the result of antiSMASH prediciton for A. flavus in comparison to that of MIDDAS-M (the “antiSMASH.AF” sheet).
(XLSX)
Acknowledgments
The authors would like to thank Prof. Y. Hashimoto and Dr. H. Kobayashi, the University of Tokyo, for the kind donation of ustiloxin B, Dr. M. Arita, the University of Tokyo, and Dr. K. Tomii, AIST, for their critical review of the equations, and Dr. S. Aburatani, AIST, for effort of building the public URL. We thank Hokuren, an agricultural cooperative association in Hokkaido Prefecture, for their kind donation of cracked maize. We are grateful to Dr. R.H. Proctor, Dr. D.W. Brown, Dr. R.A.E. Butchko, and Dr. M. Busman, USDA-ARS-NCAUR, for valuable discussions, and to our colleagues for their help and advice.
Funding Statement
This work was partly supported by the commission for Development of Artificial Gene Synthesis Technology for Creating Innovative Biomaterial from the Ministry of Economy, Trade and Industry (METI), Japan (http://www.meti.go.jp/information/data/c120522aj.html). The funders had no role in study design, data collection and analysis, decision to publish, or preparation of the manuscript. No additional external funding was received for this study.
References
- 1. Yu J, Bhatnagar D, Ehrlich KC (2002) Aflatoxin biosynthesis. Rev Iberoam Micol 19: 191–200. [PubMed] [Google Scholar]
- 2.Rank C, Larsen TO, Frisvad JC (2010) Functional systems biology of Aspergillus. In: Machida M, Gomi K, editors. Aspergillus Molecular Biology and Genomics. Norfolk, UK: Caister Academic Press. pp. 173–198. [Google Scholar]
- 3. Khaldi N, Seifuddin FT, Turner G, Haft D, Nierman WC, et al. (2010) SMURF: Genomic mapping of fungal secondary metabolite clusters. Fungal Genet Biol 47: 736–741. [DOI] [PMC free article] [PubMed] [Google Scholar]
- 4. Medema MH, Blin K, Cimermancic P, de Jager V, Zakrzewski P, et al. (2011) antiSMASH: rapid identification, annotation and analysis of secondary metabolite biosynthesis gene clusters in bacterial and fungal genome sequences. Nucleic Acids Res 39: W339–346. [DOI] [PMC free article] [PubMed] [Google Scholar]
- 5. Blin K, Medema MH, Kazempour D, Fischbach MA, Breitling R, et al. (2013) antiSMASH 2.0 − a versatile platform for genome mining of secondary metabolite producers. Nucleic Acids Res 41: W204–W212. [DOI] [PMC free article] [PubMed] [Google Scholar]
- 6. Weber T, Rausch C, Lopez P, Hoof I, Gaykova V, et al. (2009) CLUSEAN: a computer-based framework for the automated analysis of bacterial secondary metabolite biosynthetic gene clusters. J Biotechnol 140: 13–17. [DOI] [PubMed] [Google Scholar]
- 7. Andersen MR, Nielsen JB, Klitgaard A, Petersen LM, Zachariasen M, et al. (2012) Accurate prediction of secondary metabolite gene clusters in filamentous fungi. Proc Natl Acad Sci U S A 110: E99–107. [DOI] [PMC free article] [PubMed] [Google Scholar]
- 8. Chang PK, Horn BW, Dorner JW (2005) Sequence breakpoints in the aflatoxin biosynthesis gene cluster and flanking regions in nonaflatoxigenic Aspergillus flavus isolates. Fungal Genet Biol 42: 914–923. [DOI] [PubMed] [Google Scholar]
- 9. Brodhun F, Feussner I (2011) Oxylipins in fungi. FEBS J 278: 1047–1063. [DOI] [PubMed] [Google Scholar]
- 10. Marui J, Yamane N, Ohashi-Kunihiro S, Ando T, Terabayashi Y, et al. (2011) Kojic acid biosynthesis in Aspergillus oryzae is regulated by a Zn(II)(2)Cys(6) transcriptional activator and induced by kojic acid at the transcriptional level. J Biosci Bioeng 112: 40–43. [DOI] [PubMed] [Google Scholar]
- 11. Terabayashi Y, Sano M, Yamane N, Marui J, Tamano K, et al. (2010) Identification and characterization of genes responsible for biosynthesis of kojic acid, an industrially important compound from Aspergillus oryzae . Fungal Genet Biol 47: 953–961. [DOI] [PubMed] [Google Scholar]
- 12. Saito K (1907) Uber die Saurebinding von Aspergillus oryzae . Botanical Magazine Tokyo 21: 7–11. [Google Scholar]
- 13. Machida M, Asai K, Sano M, Tanaka T, Kumagai T, et al. (2005) Genome sequencing and analysis of Aspergillus oryzae . Nature 438: 1157–1161. [DOI] [PubMed] [Google Scholar]
- 14. Galagan JE, Calvo SE, Cuomo C, Ma LJ, Wortman JR, et al. (2005) Sequencing of Aspergillus nidulans and comparative analysis with A. fumigatus and A. oryzae . Nature 438: 1105–1115. [DOI] [PubMed] [Google Scholar]
- 15. Nierman WC, Pain A, Anderson MJ, Wortman JR, Kim HS, et al. (2005) Genomic sequence of the pathogenic and allergenic filamentous fungus Aspergillus fumigatus . Nature 438: 1151–1156. [DOI] [PubMed] [Google Scholar]
- 16. Machida M, Terabayashi Y, Sano M, Yamane N, Tamano K, et al. (2008) Genomics of industrial Aspergilli and comparison with toxigenic relatives. Food Addit Contam Part A Chem Anal Control Expo Risk Assess 25: 1147–1151. [DOI] [PubMed] [Google Scholar]
- 17. Tamano K, Sano M, Yamane N, Terabayashi Y, Toda T, et al. (2008) Transcriptional regulation of genes on the non-syntenic blocks of Aspergillus oryzae and its functional relationship to solid-state cultivation. Fungal Genet Biol 45: 139–151. [DOI] [PubMed] [Google Scholar]
- 18. Umemura M, Koike H, Yamane N, Koyama Y, Satou Y, et al. (2012) Comparative genome analysis between Aspergillus oryzae strains reveals close relationship between sites of mutation localization and regions of highly divergent genes among Aspergillus species. DNA Res 19: 375–382. [DOI] [PMC free article] [PubMed] [Google Scholar]
- 19. Cabanes J, Chazarra S, Garcia-Carmona F (1994) Kojic acid, a cosmetic skin whitening agent, is a slow-binding inhibitor of catecholase activity of tyrosinase. J Pharm Pharmacol 46: 982–985. [DOI] [PubMed] [Google Scholar]
- 20. Bentley R (2006) From miso, sake and shoyu to cosmetics: a century of science for kojic acid. Nat Prod Rep 23: 1046–1062. [DOI] [PubMed] [Google Scholar]
- 21. Futamura T, Ishihara H, Tamura T, Yasutake T, Huang G, et al. (2001) Kojic acid production in an airlift bioreactor using partially hydrolyzed raw corn starch. J Biosci Bioeng 92: 360–365. [DOI] [PubMed] [Google Scholar]
- 22. Wan HM, Chen CC, Giridhar R, Chang TS, Wu WT (2005) Repeated-batch production of kojic acid in a cell-retention fermenter using Aspergillus oryzae M3B9. J Ind Microbiol Biotechnol 32: 227–233. [DOI] [PubMed] [Google Scholar]
- 23. Brown DW, Butchko RA, Busman M, Proctor RH (2012) Identification of gene clusters associated with fusaric acid, fusarin, and perithecial pigment production in Fusarium verticillioides . Fungal Genet Biol 49: 521–532. [DOI] [PubMed] [Google Scholar]
- 24. Proctor RH, Brown DW, Plattner RD, Desjardins AE (2003) Co-expression of 15 contiguous genes delineates a fumonisin biosynthetic gene cluster in Gibberella moniliformis . Fungal Genet Biol 38: 237–249. [DOI] [PubMed] [Google Scholar]
- 25. Wiemann P, Willmann A, Straeten M, Kleigrewe K, Beyer M, et al. (2009) Biosynthesis of the red pigment bikaverin in Fusarium fujikuroi: genes, their function and regulation. Mol Microbiol 72: 931–946. [DOI] [PubMed] [Google Scholar]
- 26. Georgianna DR, Fedorova ND, Burroughs JL, Dolezal AL, Bok JW, et al. (2010) Beyond aflatoxin: four distinct expression patterns and functional roles associated with Aspergillus flavus secondary metabolism gene clusters. Molecular Plant Pathology 11: 213–226. [DOI] [PMC free article] [PubMed] [Google Scholar]
- 27. Kusumoto K, Nogata Y, Ohta H (2000) Directed deletions in the aflatoxin biosynthesis gene homolog cluster of Aspergillus oryzae . Curr Genet 37: 104–111. [DOI] [PubMed] [Google Scholar]
- 28. Tatusov RL, Fedorova ND, Jackson JD, Jacobs AR, Kiryutin B, et al. (2003) The COG database: an updated version includes eukaryotes. BMC Bioinformatics 4: 41. [DOI] [PMC free article] [PubMed] [Google Scholar]
- 29. Tatusov RL, Koonin EV, Lipman DJ (1997) A genomic perspective on protein families. Science 278: 631–637. [DOI] [PubMed] [Google Scholar]
- 30.Weitzel C, Simonsen HT (2013) Cytochrome P450-enzymes involved in the biosynthesis of mono- and sesquiterpenes. Phytochemistry Reviews.
- 31. Keller NP, Turner G, Bennett JW (2005) Fungal secondary metabolism - from biochemistry to genomics. Nat Rev Microbiol 3: 937–947. [DOI] [PubMed] [Google Scholar]
- 32. Coleman JJ, Mylonakis E (2009) Efflux in fungi: la piece de resistance. PLoS Pathog 5: e1000486. [DOI] [PMC free article] [PubMed] [Google Scholar]
- 33. Koiso Y, Li Y, Iwasaki S, Hanaoka K, Kobayashi T, et al. (1994) Ustiloxins, antimitotic cyclic peptides from false smut balls on rice panicles caused by Ustilaginoidea virens . J Antibiot (Tokyo) 47: 765–773. [DOI] [PubMed] [Google Scholar]
- 34. Koiso Y, Natori M, Iwasaki S, Sato S, Sonoda R, et al. (1992) Ustiloxin: A phytotoxin and a mycotoxin from false smut balls on rice panicles. Tetrahedron Letters 33: 4157–4160. [Google Scholar]
- 35. Koiso Y, Morisaki N, Yamashita Y, Mitsui Y, Shirai R, et al. (1998) Isolation and structure of an antimitotic cyclic peptide, ustiloxin F: chemical interrelation with a homologous peptide, ustiloxin B. J Antibiot (Tokyo). 51: 418–422. [DOI] [PubMed] [Google Scholar]
- 36. Altschul SF, Gish W, Miller W, Myers EW, Lipman DJ (1990) Basic local alignment search tool. J Mol Biol 215: 403–410. [DOI] [PubMed] [Google Scholar]
- 37. Punta M, Coggill PC, Eberhardt RY, Mistry J, Tate J, et al. (2012) The Pfam protein families database. Nucleic Acids Res 40: D290–301. [DOI] [PMC free article] [PubMed] [Google Scholar]
- 38. Consortium U (2011) Reorganizing the protein space at the Universal Protein Resource (UniProt). Nucleic Acids Res 40: D71–75. [DOI] [PMC free article] [PubMed] [Google Scholar]
- 39. Georgianna DR, Payne GA (2009) Genetic regulation of aflatoxin biosynthesis: from gene to genome. Fungal Genet Biol 46: 113–125. [DOI] [PubMed] [Google Scholar]
- 40. Yu J (2012) Current understanding on aflatoxin biosynthesis and future perspective in reducing aflatoxin contamination. Toxins (Basel) 4: 1024–1057. [DOI] [PMC free article] [PubMed] [Google Scholar]
- 41. Hawksworth DL (2004) Fungal diversity and its implications for genetic resource collections. Studies in Mycology 50: 9–18. [Google Scholar]
- 42. Sanchez JF, Somoza AD, Keller NP, Wang CC (2012) Advances in Aspergillus secondary metabolite research in the post-genomic era. Nat Prod Rep 29: 351–371. [DOI] [PMC free article] [PubMed] [Google Scholar]
- 43. Yin W, Keller NP (2011) Transcriptional regulatory elements in fungal secondary metabolism. J Microbiol 49: 329–339. [DOI] [PMC free article] [PubMed] [Google Scholar]
- 44. Nicholson MJ, Koulman A, Monahan BJ, Pritchard BL, Payne GA, et al. (2009) Identification of two aflatrem biosynthesis gene loci in Aspergillus flavus and metabolic engineering of Penicillium paxilli to elucidate their function. Appl Environ Microbiol 75: 7469–7481. [DOI] [PMC free article] [PubMed] [Google Scholar]
- 45. Chang PK, Horn BW, Dorner JW (2009) Clustered genes involved in cyclopiazonic acid production are next to the aflatoxin biosynthesis gene cluster in Aspergillus flavus . Fungal Genet Biol 46: 176–182. [DOI] [PubMed] [Google Scholar]
Associated Data
This section collects any data citations, data availability statements, or supplementary materials included in this article.
Supplementary Materials
Experimental details pertaining to the algorithm execution using transcriptome data, gene disruption, and the identification of ustiloxin B.
(DOCX)
The comprehensive MIDDAS-M prediction data for F. verticillioides (the “F.verticillioides” sheet) and A. flavus (the “A.flavus” sheet), the functional annotations of genes in or near the ustiloxin B cluster found by BLAST against UniProtKB (the “ust” sheet), and the result of antiSMASH prediciton for A. flavus in comparison to that of MIDDAS-M (the “antiSMASH.AF” sheet).
(XLSX)