

Abstract
Although aging is associated with a decline in bone formation in humans, the molecular pathways contributing to this decline remain unclear. Several previous clinical studies have shown that circulating sclerostin levels increase with age, raising the possibility that increased production of sclerostin by osteocytes leads to the age-related impairment in bone formation. Thus, in the present study, we examined circulating sclerostin levels as well as bone mRNA levels of sclerostin using quantitative polymerase chain reaction (QPCR) analyses in needle bone biopsies from young (mean age, 30.0 years) versus old (mean age, 72.9 years) women. In addition, we analyzed the expression of genes in a number of pathways known to be altered with skeletal aging, based largely on studies in mice. While serum sclerostin levels were 46% higher (p < 0.01) in the old as compared to the young women, bone sclerostin mRNA levels were no different between the two groups (p = 0.845). However, genes related to notch signaling were significantly upregulated (p = 0.003 when analyzed as a group) in the biopsies from the old women. In an additional analysis of 118 genes including those from genome-wide association studies related to bone density and/or fracture, BMP/TGFβ family genes, selected growth factors and nuclear receptors, and Wnt/Wnt-related genes, we found that mRNA levels of the Wnt inhibitor, SFRP1, were significantly increased (by 1.6-fold, p = 0.0004, false discovery rate [q] = 0.04) in the biopsies from the old as compared to the young women.
Our findings thus indicate that despite increases in circulating sclerostin levels, bone sclerostin mRNA levels do not increase in elderly women. However, aging is associated with alterations in several key pathways and genes in humans that may contribute to the observed impairment in bone formation. These include notch signaling, which represents a potential therapeutic target for increasing bone formation in humans. Our studies further identified mRNA levels of SFRP1 as being increased in aging bone in humans, suggesting that this may also represent a viable target for the development of anabolic therapies for age-related bone loss and osteoporosis.
Keywords: aging, postmenopausal, bone biopsy
Introduction
Despite extensive studies in mice, there is currently little information on the molecular pathways contributing to age-related bone loss in humans. Bone histomorphometric studies of biopsies obtained from women and men aged 18 to 90 years have found that aging is associated with a significant decrease in bone formation [1], as reflected by a 40% decline in mean wall thickness of trabecular bone packets [an index of the quantity of bone formed by osteoblasts in each basic multicellular unit [BMU]) [1]. This fundamental change with aging contributes to an imbalance between bone resorption and formation and to age-related bone loss in both sexes [2].
In a previous cross-sectional population study, we reported that circulating levels of the potent inhibitor of Wnt signaling, sclerostin [3], were increased 2.4- and 4.6-fold in women and men, respectively, between the ages of 21 and 97 years [4]. Other investigators have also reported similar, age-related increases in serum sclerostin levels [5, 6], raising the possibility that increased production of sclerostin by osteocytes in bone contributes to the age-related impairment in bone formation in humans.
In addition to sclerostin, a related protein with homology to sclerostin, sclerostin domain-containing 1 (sostdc1/usag-1/wise/ectodin) also inhibits Wnt- and BMP-signaling [7] and genetic polymorphisms in SOSTDC1 have been associated with bone mineral density (BMD) in humans [8]. Moreover, in a parallel study [9], we recently found that estrogen treatment of postmenopausal women leads to a significant decrease not only in bone sclerostin mRNA levels, but also to a decrease in bone mRNA levels of SOSTDC1. Thus, in the present study, we examined circulating sclerostin levels as well as bone mRNA levels of sclerostin and SOSTDC1, using quantitative polymerase chain reaction (QPCR) analyses, in needle bone biopsies from young (mean age, 30.0 years) versus old (mean age, 72.9 years) women. In addition to this primary analysis, we took advantage of the biopsy samples from the young and old women to analyze the expression of genes in a number of additional pathways known to be altered with skeletal aging, based largely on studies in mice. These included genes related to osteoblast differentiation, osteocytes, adipogenesis, proliferation, inflammation, notch signaling, stem cell markers, senescence, BMP- and Wnt-targets, and oxidative stress. We also extended the analysis to include genes linked to single nucleotide polymorphisms (SNPs) from genome-wide association studies (GWAS) [10] as well as additional genes related to the BMP/TGFβ family, specific growth factors and nuclear receptors, and Wnts/Wnt-related genes.
Methods
Study subjects
We recruited 20 young (22 to 40 years) and 20 old (64 to 88 years) women. All women were healthy and had no clinically significant abnormalities in laboratory values, no diseases known to affect bone metabolism, and were not taking any medications known to affect bone turnover. All subjects provided full written informed consent, and the study was approved by the Mayo Clinic Institutional Review Board. We should note that the bone biopsies from the old women are also being analyzed in a parallel study comparing expression of key genes and pathways in these women versus a group of age-matched women treated with estrogen in order to examine pathways altered by estrogen in bone [9]. All subjects had fasting (8 AM) serum samples drawn. Blood samples were frozen and stored at −80°C until assay performance.
Needle bone biopsy protocol
Study subjects were admitted to the outpatient Mayo Clinical Research Unit following an overnight fast. Following local anesthesia with 1% lidocaine and monitored IV sedation using 1-3 mg of intravenous midazolam and 50-100 μg of fentanyl, needle biopsies of bone from the posterior iliac crest were obtained using an 8G needle. These biopsies contain a mixture of cortical and trabecular bone, as described previously [11]. The biopsies were immediately placed in lysis buffer (QIAzol, Qiagen) and subjected to homogenization using a variable speed homogenizer (Tissue Tearor, Cole-Parmer).
QPCR gene expression analysis
Total RNA from the bone biopsies was isolated using microfuge columns (MicroColumns, Qiagen). DNase treatment to digest all genomic DNA that could lead to false positive gene expression results was done following RNA isolation using Turbo DNA-free DNase (Ambion). RNA quality and purity was confirmed with a Nanodrop spectrophotometer (Thermo Scientific). For the QPCR analyses, we designed primers using the Primer Express program (Applied Biosystems). Primer sequences for any of the genes analyzed in this report are available on request. The PCR reactions were run in the ABI Prism 7900HT Real time System (Applied Biosystems) using SYBR Green (Qiagen) as the detection method. Normalization for variations in input RNA was performed using a panel of 10 housekeeping genes (18S, G6PDH, GAPDH, GUSB, L13A, RPII, TBP, TUBA1B, B2M, ACTB) with the geNorm algorithm (http://medgen.ugent.be/~jvdesomp/genorm/) [12, 13] used to select the 3-4 most stable housekeeping genes from the 10 on the plate. The PCR Miner algorithm [14] was used to correct for variations in amplification efficiencies.
Serum measurements
Serum sclerostin levels were measured by enzyme-linked immunosorbent assay (ELISA, within- and between-assay CVs of < 6%; Alpco, Salem, NH). Bone formation was assessed by serum amino-terminal propeptide of type I collagen (PINP) as measured by double antibody radioimmunoassay (within-assay CV of 7.5%, between-assay CV of 6.5%; DiaSorin, Stillwater, MN), whereas bone resorption was evaluated by serum cross-linked C-telopeptide of type I collagen (CTX) as measured by ELISA (within-assay CV of 4.6%, between-assay CV of 8.0%; Roche Diagnostics, Indianapolis, IN). 25-hydroxyvitamin D [25(OH)D] (within-assay CV of 2.4%, between-assay CV of 6.8%) was measured using liquid chromatography-tandem mass spectrometry (API 5000; Applied Biosystems-MDS Sciex, Foster City, CA). Serum creatinine was measured by isotope dilution mass spectroscopy, and the estimated glomerular filtration rate (eGFR) was calculated using the Modification of Diet in Renal Disease (MDRD) equation [15]. Serum FGF23 levels were measured by ELISA (within- and between assay CVs of < 6%; Immunotopics, San Clemente, CA). Serum sFRP1 levels were measured by ELISA (within and between assay CVs of < 12%; Cloud-Clone Corporation, Houston, Texas).
Statistical analyses
Data are reported as mean ± SEM and comparisons between the young and old women were made using non-paired, 2-sided t-tests, except for serum sFRP1 levels, which were not normally distributed, and therefore the non-parametric Wilcoxon rank sum test was used (these data are reported as median (25th-75th percentile)). To assess if changes in gene expression occurred along a priori defined pathways based on knowledge of cellular signaling, we used the O'Brien Umbrella test [16-19], which allows for an analysis of changes in clusters of genes rather than in individual genes. This provides a more robust means to analyze gene expression data and increases the power of detecting changes in genes occurring in pre-specified clusters, rather than in isolation. To minimize issues related to multiple comparisons, we examined changes in individual genes in each pathway only if the overall pathway was significant by the O’Brien Umbrella test. For analysis of the additional 118 genes not in specific pathways and therefore not expected to change concordantly (Table 3), in addition to requiring a p-value < 0.05, we also used a correction for the false discovery rate (q-value) in order to account for the multiple comparisons, specifying a q-value of < 0.10, as is generally accepted [20, 21].
Table 3.
List of additional genes evaluated from GWAS studies related to bone density and/or fracture, BMP/TGFβ family genes, selected growth factors, and Wnt or Wnt-related genes. For completeness, all 72 of the GWAS-related genes [10] are listed, but the ones in parentheses were not evaluated as part of this analysis as they were evaluated as part of the previous analysis (sclerostin or pre-specified clusters).
| GWAS genes |
|
ABCF2, AKAP11, ANAPC1, ARHGAP1, AXIN1, C12ORF23, C17ORF53, CCDC170,
CDKAL1, CLCN7, CPED1, CPN1, CTNNB1, CYLD, DCDC5, DHH, DKK1, DNM3, ERC1, ESR1, FAM210A, FAM9B, FOXL1, FUBP3, GALNT3, GPATCH1, HOXC6, IDUA, INSIG2, (JAG1), KAL1, KCNMA1, KIAA2018, KLHDC5, LACTB2, LEKR1, LIN7C, LRP5, MAPT, MARK3, MBL2, MEF2C, (MEPE), MMP7, NME8, NTAN1, PKDCC, PTHLH, PTX4, RPS6KA5, RSPO3, (RUNX2), SALL1, SLC25A13, SMG6, (SOST), (SOX4), SOX6, (SOX9), (SP7), (SPP1), SPTBN1, STARD3NL, SUPT3H, TNFRSF11A, TNFRSF11B, WLS, WNT16, WNT4, WNT5B, XKR9, ZBTB40. |
| BMP/TGFβ family genes |
|
BMP1, BMP2, BMP3, BMP4, BMP5, BMP6, BMP7, BMP8B, BMPR1A, BMPR2, NOG,
TGFB1, TGFB2, TGFB3. |
| Selected growth factor genes |
| HIF1A, IGF1, IGF2, VEGFA, VEGFB, VEGFC. |
| Nuclear receptor genes (note that ESR1 is in the GWAS list) |
| AR, ESR2, VDR. |
| Wnts/Wnt-related genes. |
|
DKK2, DKK3, DKK4, LRP6, SFRP1, SFRP2, SFRP4, WNT1, WNT2, WNT2B, WNT3,
WNT3A, WNT5A, WNT6, WNT7A, WNT7B, WNT8A, WNT8B, WNT9A, WNT9B, WNT10A, WNT10B, WNT11. |
Results
Baseline clinical characteristics and biochemical parameters of the subjects are shown in Table 1. Other than height, the young and the old subjects did not differ with regards to anthropometric parameters. Serum creatinine was similar between the two groups, but eGFR was significantly lower in the old as compared to the young subjects. Both groups were vitamin D sufficient. Serum PTH and PINP were slightly, but not significantly, higher in the old subjects (by 7% and 22%, respectively), whereas serum CTX was significantly elevated (by 63%) in the old subjects. This resulted in a significantly lower (by 25%) PINP:CTX ratio in the old versus the young subjects, reflecting the relative deficit in bone formation with aging.
Table 1.
Baseline clinical characteristics and biochemical markers in the young and old women. Data are mean ± SEM.
| Variable | Young | Old | P-value |
|---|---|---|---|
| n | 20 | 20 | - |
| Age, years | 30.0 ± 1.2 | 72.9 ± 1.4 | - |
| Height, cm | 167.2 ± 1.4 | 162.7 ± 1.5 | 0.035 |
| Weight, kg | 72.8 ± 3.1 | 73.6 ± 3.0 | 0.849 |
| Body mass index, kg/m2 | 26.1 ± 1.2 | 27.7 ± 0.9 | 0.265 |
| Creatinine, mg/dl | 0.8 ± 0.03 | 0.8 ± 0.03 | 0.534 |
| Estimated GFR, ml/min/1.73m2 |
83 ± 4 | 69 ± 2 | 0.006 |
| 25(OH)D, ng/mL | 36.1 ± 2.9 | 37.5 ± 1.7 | 0.679 |
| PTH, pg/mL | 25.9 ± 3.2 | 27.8 ± 2.1 | 0.611 |
| PINP, μg/L | 42.2 ± 3.6 | 51.5 ± 5.2 | 0.194 |
| CTX, μg/L | 0.32 ± 0.03 | 0.52 ± 0.05 | 0.003 |
| PINP/CTX | 137 ± 9 | 103 ± 5 | 0.001 |
25(OH)D, 25-hydroxyvitamin D; PTH, parathyroid hormone; PINP, Procollagen type-I N-terminal propeptide; CTX, C-terminal telopeptide of type-I collagen.
As shown in Figure 1A and consistent with previous studies [4-6], serum sclerostin levels were significantly higher (by 46%) in the old as compared to the young subjects. The difference in circulating sclerostin levels remained essentially unchanged following adjustment for serum creatinine or eGFR (data not shown). However, bone sclerostin mRNA levels were no different between groups (p = 0.845, Figure 1B). In addition, bone mRNA levels of SOSTDC1 were similar in the two groups (p = 0.471, Figure 1C). Serum sclerostin levels were not correlated with bone sclerostin mRNA levels in either the young (r = −0.13, p = 0.593) or the old (r = −0.16, p = 0.502) subjects. In addition, serum sclerostin levels were not correlated either with serum PINP or CTX in either group (data not shown).
Figure 1.
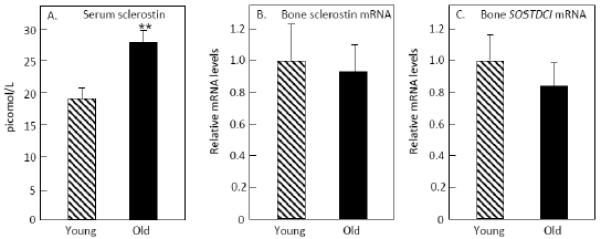
(A) Serum sclerostin, (B) bone sclerostin mRNA, and (C) bone SOSTDC1 mRNA levels in the old versus the young women. **p < 0.01.
We also considered the possibility that differences in the osteocyte composition of young versus old bones could be obscuring possible differences in bone sclerostin mRNA levels. Thus, we examined sclerostin mRNA levels normalized not to housekeeping genes, but to a typical osteocyte gene, DMP1. Even using this analysis, however, levels of sclerostin mRNA were identical between the young and old subjects: young, 1.00 ± 0.14, old 0.97 ± 0.25, p = 0.922).
We next extended the analysis of the bone biopsies to include interrogation of genes in pre-specified pathways related to bone metabolism using customized, in-house QPCR analyses. The pathways and the genes included in each of these pathways are shown in Table 2, which also includes the p-values derived from the cluster analysis (see Statistical Methods) examining whether, as a group, there were changes in the genes in each pathway. As shown, the most strongly regulated set of genes were in the notch pathway (p = 0.003), and Figure 2 shows the differences between the two groups in the individual genes in this pathway. mRNA levels of the notch ligand receptors, NOTCH1 and NOTCH2, were not increased, but one of the ligands for the notch receptors (JAG2) and several of the downstream targets of notch signaling (HES1, HEY1, HEYL) were significantly increased in the biopsies from the old compared to the young women.
Table 2.
List of genes examined in each of the pathways analyzed along with the results of the cluster analysis testing for changes in the genes in each pathway as a group using the O’Brien Umbrella test (see Methods).
| Pathway | Genes | O’Brien Umbrella P- value |
|---|---|---|
| Osteoblast differentiation |
ALPL, BGLAP, COLA1, COL1A2, IBSP, RUNX2,
SP7, SPARC, SPP1 |
0.570 |
| Osteocyte | DMP1, FGF23, MEPE, PDPN, PHEX, SOST | 0.199 |
| Adipogenesis |
ADIPOQ, C/EBPA, C/EBPB, C/EBPD, CFD, LEP,
LPL, PLIN1, PPARG |
0.048 |
| Proliferation |
CCNA2, CCNB1, CCNB2, CCNC, CCND1, CCND2,
CCNE1, E2F1, MK167 |
0.735 |
| Apoptosis |
BAD, BAX, BCL2, BCL2L1, CASP3, CASP8, FAS,
FASLG |
0.892 |
| Inflammation |
CSF1, IFNG, IL1A, IL1B, IL6, NFKB1, NFKB2,
NFKB1A, RELB, TNF |
0.070 |
| Notch signaling |
NOTCH1, NOTCH2, HEY1, HEY1, HEY2, HEYL,
JAG1, JAG2 |
0.003 |
| Stem cell markers |
MCAM, NANOG, NES, POU5F1, SOX2, SOX9,
TERT |
0.022 |
| Senescence |
BAX, CDKN1A, CDKN2A, CDKN2D, FOXO3,
IGFBP2, PTEN, RB1, SIRT1, TP53 |
0.756 |
| BMP Targets |
HES1, ID1, ID2, JUNB, KLF10, LOX, SMAD6,
SMAD7, SOX4, ZEB1 |
0.123 |
| Wnt Targets |
AXIN2, BIRC5, CCND1, CYR61, EPHB4, FOSL1,
GJA1, LEF1, POSTN, TCF7, TNFRSF11B, VCAN |
0.351 |
| Oxidative Stress |
CAT, FOXO1, FOXO3, FOXO4, GADD45A, SOD1,
SOD2, SOD3 |
0.968 |
Figure 2.
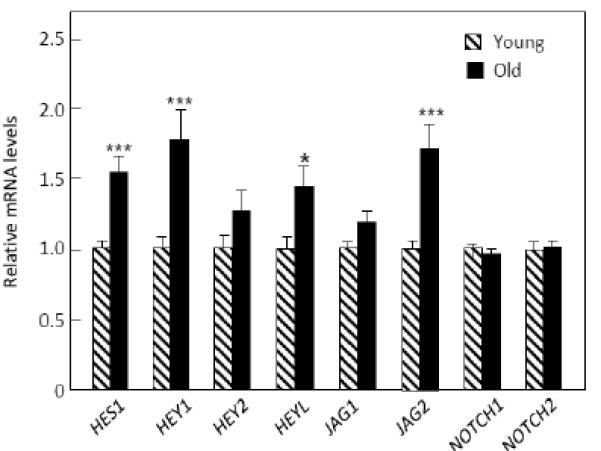
mRNA levels of the notch pathway genes in the biopsies from the old versus young women. ***p < 0.001; *p < 0.05.
As a group, adipogenesis marker genes were also increased (p = 0.048), with statistically significant increases in LEP (encoding leptin) and PLIN1 (encoding perilipin) (Figure 3A). In addition, stem cell markers were increased in the old women (p = 0.022), with statistically significant increases in MCAM (encoding CD146), NANOG, and NES (encoding nestin) (Figure 3B).
Figure 3.
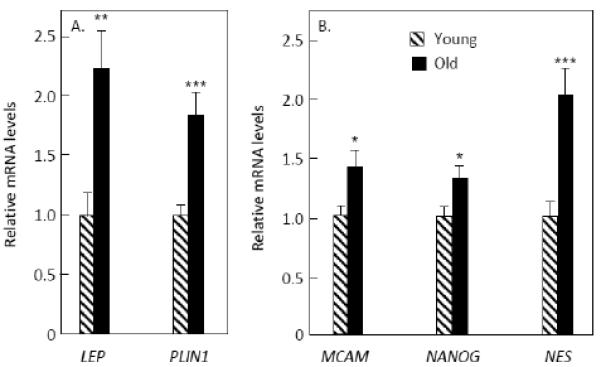
mRNA levels of (A) adipogenesis genes and (B) stem cell marker genes that were significantly increased in the biopsies from the old versus young women. ***p < 0.001; **p < 0.01; *p < 0.05.
While osteocyte markers as a group were not significantly different between the young and old women (O’Brien Umbrella p = 0.199, Table 2), given the discordance between the serum sclerostin and bone mRNA sclerostin changes with age, we did examine more closely possible differences in other osteocyte marker genes. As shown in Figure 4, mRNA levels of DMP1, E11, PHEX, and MEPE mRNA levels were no different between groups. However, FGF23 mRNA levels were significantly higher in the old versus young women. To follow up on this observation, we measured serum FGF23 levels, which were similar between groups: young, 14.5 ± 1.9 pg/ml; old, 12.2 ± 0.9 pg/ml, p = 0.426).
Figure 4.
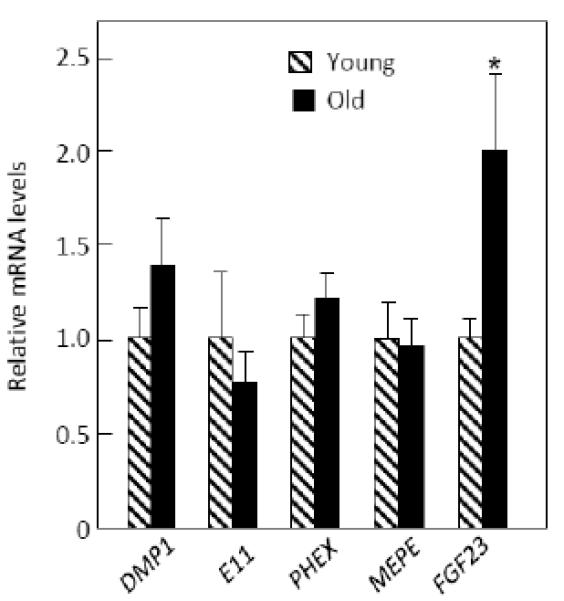
mRNA levels of osteocyte marker genes in the young and old women. *p < 0.05.
While the above analysis focused on individual, pre-specified genes directly regulating bone formation (sclerostin and SOSTDC1), or on pre-specified pathways in which genes may change together as part of a pathway, we also performed a broader analysis examining individual genes that may not change in clusters but with possible relevance to bone metabolism. This list of 118 genes is shown in Table 3 and included additional genes from GWAS studies related to bone density and/or fracture [10], BMP/TGFβ family genes, selected growth factors and nuclear receptors, and Wnt or Wnt-related genes, but excluded any genes already examined in the previous analyses. As noted in the Statistical Methods section, for this undirected analysis we required a p < 0.05 and q (false discovery rate) < 0.10, as is generally accepted [20, 21]. From this list, the only gene meeting these criteria was SFRP1 (p = 0.0009, q = 0.042), a known inhibitor of Wnt signaling [22], which was increased by 1.6-fold in the biopsies from the old women (Figure 5). To follow up on this observation, we measured serum sFRP levels in the study subjects; however, serum sFRP1 levels were very low, with 10 of the 20 young subjects and 9 of the 20 old subjects having values below the limit of detection of the assay (< 0.055 ng/ml). Although serum sFRP1 levels were 1.4-fold higher in the old versus young women (median (25th-75th percentile), 0.11 (< 0.055, 0.20) ng/ml versus 0.08 (< 0.055, 0.16) ng/ml, respectively), this difference was not statistically significant (p < 0.354).
Figure 5.
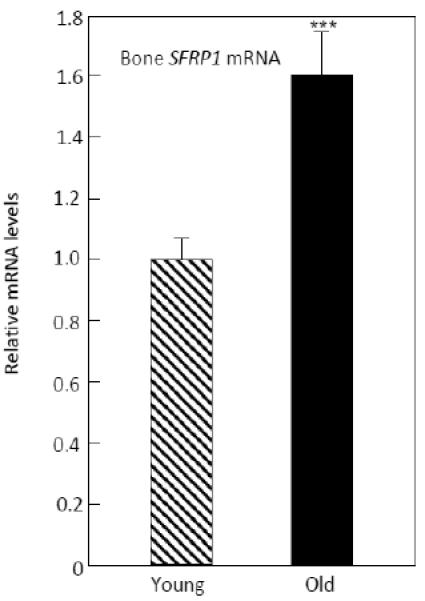
mRNA levels of SFRP1 in the old versus the young women. ***p < 0.001.
Discussion
Consistent with previous findings [4-6], we found that serum sclerostin levels were significantly increased with aging in humans. Surprisingly, however, this was not accompanied by an increase in sclerostin mRNA levels in bone in the old as compared to the young women. Although we cannot exclude the possibility that aging is associated with changes in the post-translational processing of sclerostin, resulting in increased sclerostin protein production without alterations in sclerostin mRNA levels, our data do suggest that the observed increase in circulating sclerostin levels with aging [4-6] may not be due to increased skeletal (in particular, osteocytic) sclerostin production. Of note, we have recently found that estrogen therapy of postmenopausal women reduces both circulating sclerostin as well as bone sclerostin mRNA levels [9], so at least in the case of estrogen treatment, changes in peripheral sclerostin protein and bone sclerostin mRNA levels appear to be concordant. Thus, it is possible that aging is associated with reduced clearance of sclerostin from the circulation or possibly with increased sclerostin production by non-skeletal sources. In particular, circulating sclerostin may be derived not only from osteocytes [3], but also from several other sources, including myeloid cells [23-25], vascular smooth muscle cells [26], and the kidney [3]. This may also explain our finding that serum sclerostin levels were not correlated with bone sclerostin mRNA levels in either the young or old subjects, as any association between bone and circulating sclerostin levels may have been obscured by extraskeletal contributions to circulating sclerostin. Finally, it is also possible that potential sclerostin binding proteins may be masking the relative abundance of sclerostin in the serum of young patients, leading to an apparent increase with age in serum sclerostin levels or alternatively, there may be accumulation of sclerostin cleavage products in the old subjects that may be detected by the sclerostin assay used.
We did find that genes related to notch signaling were significantly increased in the biopsies from the old as compared to the young women. The effects of notch signaling on bone are complex and appear to be osteoblast-stage dependent. Thus, disruption of notch signaling in osteoblast progenitors leads to a transient increase in bone mass due to enhanced osteoblast differentiation [27]. Conversely, activation of notch in undifferentiated and differentiated osteoblasts leads to marked osteopenia due to impaired osteoblast differentiation [28]. Hilton et al. [27] also found that notch signaling, by blocking osteoblast differentiation, leads to an increase in the pool of mesenchymal progenitors. Consistent with this, we also observed an increase in several stem cell markers in the biopsies from the old compared to the young women.
In contrast to notch activation in osteoblasts, activation of notch preferentially in osteocytes induces osteoprotegerin and Wnt signaling, thereby decreasing cancellous bone remodeling and increasing cortical bone formation [29]. Nonetheless, as suggested by Hilton and colleagues [27], the possibility that bone formation could be enhanced in vivo by transiently suppressing notch signaling in osteoblasts represents a therapeutic direction that, based on our data showing increased notch signaling with aging, warrants further study.
We also found that genes related to adipogenesis were increased in the biopsies from the old women. This is consistent with a growing body of evidence suggesting that with aging, there is an increase in adipogenesis relative to osteoblastogenesis due to “switching” of cell fate from a common precursor mesenchymal cell [30].
Although osteocyte markers as a group were not different between the young and old subjects, bone FGF23 mRNA levels were significantly higher in the old versus the young subjects. However, this was not reflected by an increase in serum FGF23 levels in the old subjects, suggesting that there may be increased FGF23 production with age in bone that perhaps has local effects in the bone microenvironment without systemic effects. This possibility warrants further study.
Our broader analysis of 118 genes that included additional genes from GWAS studies related to bone density and/or fracture [10], BMP/TGFβ family genes, selected growth factors and nuclear receptors, and Wnt or Wnt-related genes identified SFRP1 as being significantly increased in the biopsies from the old women. This finding is of particular interest as the secreted frizzled-related proteins (sFRP1-5) are known to bind Wnt ligands and to inhibit both canonical and non-canonical Wnt signaling [22]. In particular, sFRP1 is known to regulate osteoblast differentiation, proliferation, function and apoptosis through inhibition of Wnt/β-catenin signaling [22] as well as osteoblast-induced osteoclastogenesis by binding to RANKL [31]. Moreover, sFRP1 also enhances adipocytic differentiation of mesenchymal precursor cells at the expense of osteoblast differentiation [32]. Finally, Sfrp1 null mice have increased bone mass [33], whereas Sfrp1 transgenic mice have reduced bone mass due to decreased bone formation [34]. Thus, increased skeletal sFRP1 production may also be contributing to the impairment in bone formation with aging. Of note, consistent with the 1.6-fold increase in bone SFRP1 mRNA levels, serum sFRP1 protein levels were 1.4-fold higher in the old versus the young women, but due to the variability of this assay and the fact that nearly half the subjects in each group were below the detection limit of the assay, this difference was not statistically significant.
We acknowledge several limitations of our study. First, the bone biopsies we obtained contained a heterogeneous population of cells, including hematopoietic and endothelial cells. Thus, we cannot identify which cells in the biopsies were most responsible for the differences we observed between the young versus the old subjects. We have recently developed methods to obtain osteoblasts from similar biopsies without the need for in vitro culture [35] and are in the process of designing additional studies using highly enriched osteoblast preparations from humans. Second, since we analyzed a large number of genes, we attempted to control for multiple comparisons by several methods. In the first analysis, we specifically grouped genes into pre-specified clusters and examined changes in individual genes only if the overall group difference was significant using the O’Brien Umbrella test [16-19]. In the broader analysis of 118 genes, we required both a significant p-value and a reasonably stringent false discovery rate (q-value) of 0.10 [20, 21], although the single gene we identified as being different between groups (SFRP1) using these criteria in fact had a q-value < 0.05.
Our study also has several strengths, including the examination of bone biopsies from otherwise healthy volunteers, in contrast to using biopsy material from subjects undergoing surgery for other indications (e.g., osteoarthritis). In addition, we examined mRNA levels in unprocessed samples, without in vitro culture.
In summary, our findings indicate that despite increases in circulating sclerostin levels, bone sclerostin mRNA levels do not increase in elderly women. In addition, our data demonstrate that aging is associated with alterations in several key pathways and genes in humans that may contribute to the observed impairment in bone formation. These include notch signaling which, based on our findings in humans and previous studies in mice [27], represents a potential therapeutic target for increasing bone formation in humans. Our study further identified mRNA levels of SFRP1, which encodes a well-recognized inhibitor of bone formation [22], as being increased in aging bone in humans, suggesting that this may also represent a viable target for the development of anabolic therapies for age-related bone loss and osteoporosis.
Highlights.
Aging is not associated with increased bone sclerostin mRNA levels
Notch pathway genes are increased in bone biopsies from old women
SFRP1 mRNA levels are increased in bone biopsies from old women
Acknowledgements
We would like to thank the Mayo Immunochemical Core laboratory for performing the biochemical analyses.
Funding:
Supported by NIH Grants R01 AG004875 and UL1 TR000135 (Mayo CTSA).
Footnotes
Publisher's Disclaimer: This is a PDF file of an unedited manuscript that has been accepted for publication. As a service to our customers we are providing this early version of the manuscript. The manuscript will undergo copyediting, typesetting, and review of the resulting proof before it is published in its final citable form. Please note that during the production process errors may be discovered which could affect the content, and all legal disclaimers that apply to the journal pertain.
Conflict of interest: None of the authors has a relevant conflict to disclose
References
- 1.Lips P, Courpron P, Meunier PJ. Mean wall thickness of trabecular bone packets in the human iliac crest: changes with age. Calcif Tissue Res. 1978;26:13–17. doi: 10.1007/BF02013227. [DOI] [PubMed] [Google Scholar]
- 2.Khosla S. Pathogenesis of age-related bone loss in humans. J Gerontol A Biol Sci Med Sci. doi: 10.1093/gerona/gls163. in press doi:10.1093/gerona/gls163. [DOI] [PMC free article] [PubMed] [Google Scholar]
- 3.Ke HZ, Richards WG, Li X, Ominsky MS. Sclerostin and dickkopf-1 as therapeutic targets in bone diseases. Endocr Rev. 2012;33:747–783. doi: 10.1210/er.2011-1060. [DOI] [PubMed] [Google Scholar]
- 4.Modder UI, Hoey KA, Amin S, McCready LK, Achenbach SJ, Riggs BL, Melton LJ, 3rd, Khosla S. Relation of age, gender, and bone mass to circulating sclerostin levels in women and men. J Bone Miner Res. 2011;26:373–379. doi: 10.1002/jbmr.217. [DOI] [PMC free article] [PubMed] [Google Scholar]
- 5.Amrein K, Amrein S, Drexler C, Dimai HP, Dobnig H, Pfeifer K, Tomaschitz A, Pieber TR. Fahrleitner-Pammer A. Sclerostin and its association with physical activity, age, gender, body composition, and bone mineral content in healthy adults. J Clin Endocrinol Metab. 2012;97:148–154. doi: 10.1210/jc.2011-2152. [DOI] [PubMed] [Google Scholar]
- 6.Ardawi M-SM, Al-Kadi HA, Rouzi AA, Qari MH. Determinants of serum sclerostin in healthy pre- and postmenopausal women. J Bone Miner Res. 2011;26:2812–2822. doi: 10.1002/jbmr.479. [DOI] [PubMed] [Google Scholar]
- 7.Lintern KB, Guidato S, Rowe A, Saldanha JW, Itasaki N. Characterization of wise protein and its molecular mechanism to interact with Wnt and BMP signals. J Biol Chem. 2009;284:23159–23168. doi: 10.1074/jbc.M109.025478. [DOI] [PMC free article] [PubMed] [Google Scholar]
- 8.He JW, Yue H, Hu HH, Hu YQ, Zhang ZL. Contribution of the sclerostin domain-containing protein 1 (SOSTDC1) gene to normal variation of peak bone mineral density in Chinese women and men. J Bone Miner Res. 2011;29:571–581. doi: 10.1007/s00774-010-0253-5. [DOI] [PubMed] [Google Scholar]
- 9.Roforth M, Fujita K, Demaray S, McGregor UI, Kirmani S, McCready LK, Peterson JM, Drake M, Monroe DG, Khosla S. Estrogen reduces sost mRNA and circulating sclerostin levels in postmenopausal women. ASBMR. 2013 (Abstract) [Google Scholar]
- 10.Estrada K, Styrkarsdottir U, Evangelou E, et al. Genome-wide meta-analysis identifies 56 bone mineral density loci and reveals 14 loci associated with risk of fracture. Nat Genet. 2012;44:491–501. doi: 10.1038/ng.2249. [DOI] [PMC free article] [PubMed] [Google Scholar]
- 11.Modder UI, Roforth MM, Nicks KM, Peterson JM, McCready LK, Monroe DG, Khosla S. Characterization of mesenchymal progenitor cells isolated from human bone marrow by negative selection. Bone. 2012;50:807–810. doi: 10.1016/j.bone.2011.12.014. [DOI] [PMC free article] [PubMed] [Google Scholar]
- 12.Radonic A, Thulke S, Mackay IM, Landt O, Siegert W, Nitsche A. Guideline to reference gene selection for quantitative real-time PCR. Biochem Biophys Res Commun. 2004;313:856–862. doi: 10.1016/j.bbrc.2003.11.177. [DOI] [PubMed] [Google Scholar]
- 13.Vandesompele J, De Preter K, Pattyn F, Poppe B, Van Roy N, De Paepe A, Speleman F. Accurate normalization of real-time quantitative RT-PCR data by geometeric averaging of multiple internal control genes. Genome Biol. 2002;3 doi: 10.1186/gb-2002-3-7-research0034. research0034.1-0-34.11. [DOI] [PMC free article] [PubMed] [Google Scholar]
- 14.Zhao S, Fernald RD. Comprehensive algorithm for quantitative real-time polymerase chain reaction. J Comput Biol. 2005;12:1047–1064. doi: 10.1089/cmb.2005.12.1047. [DOI] [PMC free article] [PubMed] [Google Scholar]
- 15.Levey AS, Coresh J, Greene T, Stevens LA, Zhang YL, Hendriksen S, Kusek JW, Van Lente F. Chronic Kidney Disease Epidemiology Collaboration. Using standardized serum creatinine values in the modification of diet in renal disease study equation for estimating glomerular filtration rate. Ann Intern Med. 2006;145:247–254. doi: 10.7326/0003-4819-145-4-200608150-00004. [DOI] [PubMed] [Google Scholar]
- 16.O'Brien PC. Procedures for comparing samples with multiple endpoints. Biometrics. 1984;40:1079–1087. [PubMed] [Google Scholar]
- 17.Syed FA, Modder UI, Roforth M, Hensen I, Fraser DG, Peterson JM, Oursler MJ, Khosla S. Effects of chronic estrogen treatment on modulating age-related bone loss in female mice. J Bone Miner Res. 2010;25:2438–2446. doi: 10.1002/jbmr.129. [DOI] [PMC free article] [PubMed] [Google Scholar]
- 18.Modder UI, Roforth MM, Hoey K, McCready LK, Peterson JM, Monroe DG, Oursler MJ, Khosla S. Effects of estrogen on osteoprogenitor cells and cytokines/bone regulatory factors in postmenopausal women. Bone. 2011;49:202–207. doi: 10.1016/j.bone.2011.04.015. [DOI] [PMC free article] [PubMed] [Google Scholar]
- 19.Peris P, Atkinson EJ, Gossl M, Kane TL, McCready LK, Lerman A, Khosla S, McGregor UI. Effects of bisphosphonate treatment on circulating osteogenic endothelial progenitor cells in postmenopausal women. Mayo Clin Proc. 2013;88:46–55. doi: 10.1016/j.mayocp.2012.08.019. [DOI] [PMC free article] [PubMed] [Google Scholar]
- 20.Reiner A, Yekutieli D, Benjamini Y. Identifying differentially expressed genes using false discovery rate controlling procedures. Bioinformatics. 2003;19:368–375. doi: 10.1093/bioinformatics/btf877. [DOI] [PubMed] [Google Scholar]
- 21.Hirakawa A, Sato Y, Sozu T, Hamada C, Yoshimura I. Estimating the false discovery rate using mixed normal distribution for identifying differentially expressed genes in microarray data analysis. Cancer Inform. 2008;22:140–148. [PMC free article] [PubMed] [Google Scholar]
- 22.Boudin E, Fijalkowski I, Piters E, Van Hul W. The role of extracellular modulators of canonical Wnt signaling in bone metabolism and diseases. Semin Arthritis Rheum. doi: 10.1016/j.semarthrit.2013.01.004. in press doi: 10.1016/j.senartgrut.2013.01.004. [DOI] [PubMed] [Google Scholar]
- 23.Kusu N, Laurikkala J, Imanishi M, Usui H, Konishi M, Miyake A, Thesleff I, Itoh N. Sclerostin is a novel secreted osteoclast-derived bone morphogenetic protein antagonist with unique ligand specificity. J Biol Chem. 2003;278:24113–24117. doi: 10.1074/jbc.M301716200. [DOI] [PubMed] [Google Scholar]
- 24.Pederson L, Ruan M, Westendorf JJ, Khosla S, Oursler MJ. Regulation of bone formation by osteoclasts involves Wnt/BMP signaling and the chemokine sphingosine-1-phosphate. Proc Natl Acad Sci USA. 2009;105:20764–20769. doi: 10.1073/pnas.0805133106. [DOI] [PMC free article] [PubMed] [Google Scholar]
- 25.Ota K, Quint P, Ruan M, Pederson L, Westendorf JJ, Khosla S, Oursler MJ. Sclerostin is expressed in osteoclasts from aged mice and reduces osteoclast-mediated stimulation of mineralization. J Cell Biochem. 2013;114:1901–1907. doi: 10.1002/jcb.24537. [DOI] [PMC free article] [PubMed] [Google Scholar]
- 26.Zhu D, Mackenzie NC, Millan JL, Farquharson C, MacRae VE. The appearance and modulation of osteocyte marker expression during calcification of vascular smooth muscle cells. Plos ONE. 2011;6:e19595. doi: 10.1371/journal.pone.0019595. [DOI] [PMC free article] [PubMed] [Google Scholar]
- 27.Hilton MJ, Tu X, Wu X, Bai S, Zhao H, Kobayashi T, Kronenberg HM, Teitelbaum SL, Ross FP, Kopan R, Long F. Notch signaling maintains bone marrow mesenchymal progenitors by suppressing osteoblast differentiation. Nat Med. 2008;14:306–314. doi: 10.1038/nm1716. [DOI] [PMC free article] [PubMed] [Google Scholar]
- 28.Canalis E, Parker K, Feng JQ, Zanotti S. Osteoblast lineage-specific effects of notch activation in the skeleton. Endocrinology. 2013;154:623–634. doi: 10.1210/en.2012-1732. [DOI] [PMC free article] [PubMed] [Google Scholar]
- 29.Canalis E, Adams DJ, Boskey A, Parker K, Kranz L, Zanotti S. Notch signaling in osteocytes differentially regulates cancellous and cortical bone remodeling. J Biol Chem. 2013 doi: 10.1074/jbc.M113.470492. In press: http://jbc.org/cgi/doi/10.1074/jbc.M113.470492. [DOI] [PMC free article] [PubMed]
- 30.Fazeli PK, Horowitz MC, MacDougald OA, Scheller EL, Rodeheffer MS, Rosen CJ, Klibanski A. Marrow fat and bone-new perspectives. J Clin Endocrinol Metab. 2013;98:935–945. doi: 10.1210/jc.2012-3634. [DOI] [PMC free article] [PubMed] [Google Scholar]
- 31.Hausler KD, Horwood NJ, Chuman Y, Fisher JL, Ellis J, Martin TJ, Rubin JS, Gillespie MT. Secreted frizzled-related protein-1 inhibits RANKL-dependent osteoclast formation. J Bone Miner Res. 2004;19:1873–1881. doi: 10.1359/JBMR.040807. [DOI] [PubMed] [Google Scholar]
- 32.Taipaleenmaki H, Abdallah BM, Aldahmash A, Saamanen AM, Kassem M. Wnt signaling mediates the cross-talk between bone marrow derived pre-adipocytic and pre-osteoblastic cell populations. Exp Cell Res. 2011;317:745–756. doi: 10.1016/j.yexcr.2010.12.015. [DOI] [PubMed] [Google Scholar]
- 33.Bodine PVN, Zhao W, Kharode YP, Bex FJ, Lambert AJ, Goad MB, Gaur T, Stein GS, Lian JB, Komm BS. The Wnt antagonist secreted frizzled-related protein-1 is a negative regulator of trabecular bone formation in adult mice. Mol Endocrinol. 2004;18:1222–1237. doi: 10.1210/me.2003-0498. [DOI] [PubMed] [Google Scholar]
- 34.Yao W, Cheng Z, Shahnazari M, Dai W, Johnson ML, Lane NE. Overexpression of secreted frizzled-related protein 1 inhibits bone formation and attenuates parathyroid hormone bone anabolic effects. J Bone Miner Res. 2010;25:190–199. doi: 10.1359/jbmr.090719. [DOI] [PMC free article] [PubMed] [Google Scholar]
- 35.Fujita K, Roforth M, Peterson JM, Kirmani S, Drake M, McCready LK, Monroe DG, Khosla S. Isolation and characterization of human osteoblasts from needle biopsies without in vitro culture. Osteoporosis Int. doi: 10.1007/s00198-013-2529-9. (In press) [DOI] [PMC free article] [PubMed] [Google Scholar]