

Abstract
The role of the cytokine macrophage migration inhibitory factor (MIF) and its receptor, CD74, was assessed in autoimmune hepatitis (AIH) and primary biliary cirrhosis (PBC). Two MIF promoter polymorphisms, a functional -794 CATT5–8 microsatellite repeat (rs5844572) and a -173 G/C single nucleotide polymorphism (rs755622), were analyzed in DNA samples from over 500 patients with AIH, PBC, and controls. We found a higher frequency of the pro-inflammatory and high expression -794 CATT7 allele in AIH compared to PBC, while lower frequency was found in PBC compared to both AIH and healthy controls. MIF and soluble MIF receptor (CD74) were measured by ELISA in 165 serum samples of AIH, PBC, and controls. Circulating serum and hepatic MIF expression was elevated in patients with AIH and PBC vs. healthy controls. We also identified a truncated circulating form of the MIF receptor CD74 that is released from hepatic stellate cells and that binds MIF, neutralizing its signal transduction activity. Significantly higher levels of CD74 were found in patients with PBC vs. AIH and controls.
Conclusions
These data suggest a distinct genetic and immunopathogenic basis for AIH and PBC at the MIF locus. Circulating MIF and MIF receptor profiles distinguish PBC from the more inflammatory phenotype of AIH and may play a role in the pathogenesis and as biomarkers of these diseases.
Keywords: MIF, CD74, Autoimmune Hepatitis, Primary Biliary Cirrhosis, Gene Polymorphism
INTRODUCTION
Macrophage migration inhibitory factor (MIF) is a pro-inflammatory cytokine that mediates the host response to infection and stress by activating innate and adaptive immune pathways1,2. MIF is released both from immune and neuroendocrine cells and it acts to counter-regulate the immunosuppressive effect of glucocorticoids3,4. Recently, MIF has been associated with a number of autoimmune diseases including rheumatoid arthritis, systemic sclerosis, and inflammatory bowel disease5–8. Two polymorphisms with clinical significance have been identified in the MIF promoter: a functional microsatellite repeat sequence -794 CATT5–8 (rs5844572), where higher MIF expression occurs with increased repeat numbers, and a -173 G/C (rs755622) single-nucleotide polymorphism (SNP), where the C allele is associated with risk of disease, most likely by linkage disequilibrium. MIF polymorphisms and circulating MIF levels in systemic lupus erythematosus correlate with disease susceptibility and multi-organ involvement9.
In the present study, we investigated MIF expression and MIF gene associations in patients with AIH and PBC. Our findings suggest a distinct MIF genetic and serum profile in AIH compared to PBC. We also report the characterization of a circulating form of the MIF receptor (CD74) that modulates MIF activity and is increased in expression in the circulation of AIH vs. PBC patients. Furthermore, the ratio of serum CD74 and MIF values correlated with serum ALT in patients with AIH who experienced relapse as measured by serum liver tests. A soluble form of CD74 is released by human hepatic stellate cells (HSC) in vitro after interferon-γ (IFN-γ) stimulation, and its production in vivo may contribute to the differences in inflammatory manifestations of these two autoimmune liver diseases.
MATERIALS AND METHODS
Patient Cohorts
An AIH cohort (N=52) of patients diagnosed by established criteria10 was recruited from the Yale Liver Clinics. Two PBC cohorts comprised one from the Yale Liver Clinics (N=42) and a second group with similar clinical, geographic and ethnic characteristics from Tufts Medical Center, Boston (N=267). Overlap Syndromes11 were excluded. Sera (N=71) or genomic DNA (N=286) from healthy controls were obtained from a Yale biospecimen repository. The study was approved by Yale’s Human Investigation Committee.
Serum MIF and CD74 ELISA
Serum MIF was measured by sandwich ELISA as previously described9. Competitive sandwich ELISAs for circulating CD74 and MIF-CD74 complexes were developed (see Supplemental Methods). The ratio of CD74/MIF was calculated by dividing the molar serum concentration ratio of circulating CD74 (20 kDa) by MIF (12.5 kDa).
Histologic Analysis
Paraffin embedded, stored biopsy tissue was stained with anti-CD74 (LN-2, Santa Cruz) as primary antibody and labeled with anti-IgG alkaline phosphatase. The tissue was double-stained for alpha-smooth muscle actin (αSMA) and revealed with 3,3′-diaminobenzidine. For MIF tissue staining, the primary antibody was anti-MIF IIb in PBS, and secondary antibody was anti-rabbit IgG horseradish peroxidase (Dako)12. Isotype control antibody stained tissues were generated using non-immunized mouse IgG.
MIF polymorphism analyses
DNA was extracted from serum samples using the Easy-DNA Kit (Invitrogen, Carlsbad, CA) with MIF -794 CATT5–8 (rs5844572) polymorphism analysis performed as described9. MIF -173 G/C SNP (rs755622) analysis was performed by pyrosequencing9. Figure 1 illustrates the MIF gene.
Figure 1.
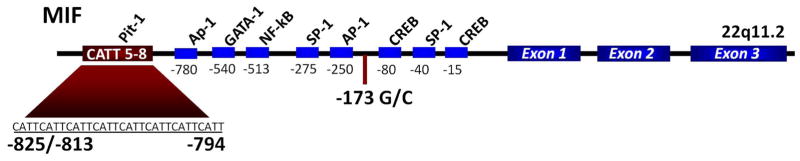
Diagram of the macrophage migration inhibitory factor (MIF) gene showing the -794 CATT5–8 microsatellite repeat (rs5844572), the -173 G/C single-nucleotide polymorphism (rs755622), its exonic structure, and predicted transcription factor binding sites. Numerical prefixes refer to nucleotide distance (in base pairs) upstream from the transcription start site.
Methods for the cell culture stimulation of HSC, whole liver lysate analysis, and assays for MIF-CD74 epitope and competitive MIF-CD74 binding assays are described in the Supplemental Methods.
Characterization of circulating CD74
The molecular weight of serum circulating CD74 was estimated by western blotting and compared with full-length, CD741–232 expressed in COS-7 cells13. CD74 was immunoprecipitated from serum by incubation with 12 μg/mL of anti-CD74 for 3 hours at 4°C, followed by adding 50 μL of Protein G Sepharose beads (GE Life Sciences), overnight incubation at 4°C, and PBS wash. Loading buffer (NuPage LDS, Invitrogen) with 10% β-mercaptoethanol was added, the sample run by SDS-PAGE and proteins revealed by western blotting with anti-CD74 (clone LN-2, Santa Cruz, SC-6262) and IgG horseradish peroxidase-linked secondary antibody (Cell Signaling, 7076S). Sera or COS-7 expressed recombinant CD741–232 were deglycosylated prior to immunoprecipitation by incubation of 250 μL serum with 30 μL of a deglycosylation enzyme mix (New England Biolabs) containing PNGase F glycerol free, Endo-α-N-Acetylgalactosaminidase, Neuraminidase, β1–4 Galactosidase and β-N-Acetylglucosaminidase. AIH and PBC serum were also analyzed by Western Blotting with an antibody specific for the intra-cellular domain of the molecule (CD74 PIN.1 Ab, Santa Cruz, SC-47742).
Neutralization of serum MIF by CD74
Test sera were incubated with human primary skin fibroblasts (3.6×10⁵ cells/well), with or without neutralizing anti-CD74 antibody, anti-MIF monoclonal antibody (IIID.9, 100 μg/mL), or recombinant CD7473–232 (100 ng/mL) followed by addition of recombinant human MIF (2.7 nM) protein. For immunoadsorption of CD74, two AIH sera and two PBC sera (100 μL per sample) were pre-incubated with anti-CD74 antibody (clone LN2, Santa Cruz) and then immunoprecipitated with protein G beads. Serum was also absorbed with a control IgG (Hb49). MIF signal transduction was measured by MIF-dependent ERK1/2 phosphorylation as described13,14.
Statistical Analysis
Serum ELISA MIF and CD74 values were analyzed as continuous variables. Due to non-normal distribution of CD74 and MIF concentrations, non-parametric Mann-Whitney U test was performed for all serum values. For the MIF polymorphism data, 2LD15 was used to calculate the linkage disequilibrium between the CATT and SNP in healthy controls. Both markers were found to be in Hardy-Weinberg equilibrium by PEDSTATS16. A chi-square test was performed to test the overall association of the alleles in CATT between case and controls. Implemented in R (http://www.r-project.org), a logistic regression was fitted with the disease status as response variable, and for the -794 CATT5–8 and -173 G/C SNP alleles as predictor variables. The SNP and each CATT allele (5, 6, 7) were coded as separate variables in an additive model. The CATT8 allele was omitted due to its extremely low frequency. To address multiple testing, calculations were made based on 10,000 permutation tests which control the family-wise error rate in multiple comparisons.
RESULTS
Patient demographics
Demographic data for the clinically characterized cohorts of AIH and PBC patients are presented in Table 1. Most patients were Caucasian (AIH: 85%, PBC: 91%) and female (AIH: 83%, PBC: 91%), in agreement with typical U.S. patient characteristics17,18. Most patients had blood collected as outpatients during routine follow-up care. The AIH cohort received a median of 5 mg prednisone, daily. No PBC patients received glucocorticoids.
Table 1.
Demographic data of patients with AIH, PBC, and healthy controls. Medication doses and liver test values correspond to the time of serum collection.
| AIH | PBC | Controls | |
|---|---|---|---|
| N=52 (range) | N=42 (range) | N=71 (range) | |
| Age at blood collection, median | 54 (20–79) | 62 (30–84) | 45.0 (21–87) |
| Female, % | 82.7 | 90.5 | 70.4 |
| Caucasian, % | 84.6 | 90.5 | 73.2 |
| Age at diagnosis, median | 41 (1.5–71) | 52 (26–77) | NA |
| Cirrhosis (imaging or biopsy), % | 55.8 | 9.5 | NA |
| IAHG* Score, median | 17 (6–25) | NA | NA |
| PBC Stage, median | NA | 2 (0–4) | NA |
| ANA Positive, % | 77.0 | 33.3 | NA |
| AMA Positive, % | 3.8 | 78.6 | NA |
| Prednisone, median daily mg | 5.0 (0–60) | NA | NA |
| Azathioprine, median daily mg | 50 (0–150) | NA | NA |
| Ursodeoxycholic acid, median daily mg | NA | 1000 (0–2000) | NA |
| Alanine Aminotransferase, median U/L | 27 (0–383) | 29 (10–104) | NA |
| Alkaline Phosphatase, median IU/L | 66 (34–294) | 116 (62–423) | NA |
| Total Bilirubin, median mg/dL | 0.51 (0.5–37.1) | 0.59 (0.25–50) | NA |
IAHG – International Autoimmune Hepatitis Group (10).
Serum levels of MIF elevated in patients with AIH and PBC
The median serum MIF level was significantly elevated but similar in both the AIH and PBC cohorts compared to healthy controls (11.1 and 9.58 vs. 2.63 ng/mL, respectively; p<0.001), (Figure 2A). Median serum MIF levels were slightly but not significantly different between patients taking 0–5 mg compared to >5 mg of daily prednisone: 9.69 (N=29) vs. 11.44 (N=23) ng/mL, p=NS. Neither stage of fibrosis nor autoantibodies correlated with serum MIF values in AIH or PBC (data not shown).
Figure 2.

A. Median serum MIF levels in healthy controls and patients with AIH and PBC (AIH: 11.1±9.55 ng/mL, PBC: 9.58±12.12 ng/mL, Controls: 2.63±3.45 ng/mL, *p<0.001 for AIH vs. Controls and for PBC vs. Controls). There was no significant difference between serum MIF among the two patient cohorts (p=NS). The bottom, middle, and top lines of the box demarcate the 25th, 50th, and 75th percentiles, respectively, and the vertical lines show the maximum and minimum values. B. Immunohistochemistry staining of MIF in human liver tissue from a patient with AIH, a patient with PBC, and a healthy control. The AIH section displays dark MIF staining (dark brown) in 100% of counted hepatocytes, while the PBC section has lighter MIF staining in 100% of counted hepatocytes, with more prominent biliary staining. There was no hepatocyte staining in control tissue. All three sections revealed mild biliary epithelial staining. Images shown are representative of 11 patients examined (AIH=2, PBC=4, Control=5).
MIF and the MIF receptor expression increased in liver tissue
MIF is expressed by hepatocytes and infiltrating mononuclear cells in chronic hepatitis B infection19. Intracellular MIF staining in hepatocytes, biliary epithelial cells and infiltrating mononuclear cells was increased in AIH and PBC. In AIH, there was more consistent staining in hepatocytes, (Figure 2B). Only biliary epithelia stained in control sections. The MIF receptor, CD74, and α-smooth muscle actin (αSMA), were expressed in the sinusoids but not in hepatocytes in control sections, (Figure 3A). Distinct but faint peri-membrane CD74 staining was seen in the hepatic sinusoids in mild chronic AIH, whereas diffuse sinusoidal and prominent hepatocyte staining of CD74 was present in severe acute AIH. Analysis of PBC tissue revealed distinct CD74 staining in sinusoids and granulomatous tissue. These findings indicate that both MIF and its receptor protein, CD74, are expressed in AIH and PBC liver, with variable cellular staining between mild vs. severe AIH.
Figure 3.

A. Immunohistochemical staining for the MIF receptor, CD74 (blue), and αSMA (brown) in liver tissue sections from two patients with AIH (mild chronic vs. severe acute), one patient with PBC, and control liver tissue. All three sections revealed CD74 in the sinusoidal areas; however in severe AIH there was prominent staining diffusely in hepatocytes. Images shown are representative of 15 patient sections examined (AIH=2, PBC=5, Control=6). B. Detection of serum circulating CD74 by ELISA. Plot of immunoreactive, circulating CD74 median concentrations (Controls: 14.2±107.75 ng/mL, AIH: 38.13±430.24 ng/mL, PBC: 171.57±1195.98 ng/mL, *p<0.001 for AIH vs. Controls and for PBC vs. Controls, **p<0.001 for PBC vs. AIH). The bottom, middle, and top lines of the box demarcate the 25th, 50th, and 75th percentiles, respectively, and the vertical lines show the maximum and minimum values. C. Calculated median CD74/MIF ratio based on conversion of the serum concentrations (ng/mL) ratio into molar concentrations (Controls: 2.32±33.54, AIH: 3.13±82.56, PBC: 15.25±69.38, *p<0.0001 for PBC vs. AIH, **p<0.0001 for PBC vs. Controls). D. The serum CD74/MIF ratio correlates with serum ALT in patients with active disease. Negative correlation was found between CD74/MIF and ALT in longitudinal samples from 4 patients with AIH and at least one elevation in ALT > 2 × ULN (24 time-points). Coefficient of −0.4762, p=0.0338.
Association between MIF gene polymorphisms and AIH vs. PBC
MIF is encoded in a functionally polymorphic locus (22q11.2) that is linked to the susceptibility and clinical severity of several autoimmune diseases5–9, (Figure 1). To determine if the two MIF promoter polymorphisms (-794 CATT5–8 and -173 G/C SNP) correlated with disease susceptibility or phenotype, we analyzed genomic DNA from 306 patients with PBC and 45 with AIH. To eliminate population stratification20, analysis was limited to Caucasian patients. DNA and serum protein was analyzed from the Yale cohort while the Tufts Medical Center cohort was used only for genotype analysis. Allelic data were compared to a healthy Caucasian control population (N=286) from a repository at Yale, (Table 1).
MIF -794 CATT5–8 Alleles
262 of the 306 PBC patients were genotyped at the CATT locus along with 41 AIH and 286 healthy controls. Overall, we found a statistically significant difference of the allele frequencies in PBC compared to healthy controls (chi-square test, p=0.0123), (Table 2). We also compared the allele frequency for each individual CATT5–8 allele. In particular, the low expression, MIF -794 CATT5 allele was more frequent in PBC patients (31.1%) than in healthy controls (23.8%), with an OR for PBC risk of 1.34 (CI 1.05–1.7, p=0.0165). The p value on permutation testing was 0.0331. Conversely, a decrease in frequency of the high MIF expression CATT7 allele was evident in the PBC patients (OR 0.628, CI 0.43–0.93, p=0.0188), with a p value on permutation testing of 0.0389. A trend toward this difference could also be shown for PBC by genotype analysis of each allele.
Table 2.
Allele and genotype frequencies of MIF -794 CATT5–8 and -173 G/C SNP for Caucasian patients with AIH and PBC compared to healthy Caucasian controls. The adjusted p values were calculated by permutation testing to account for multiple comparisons.
| Healthy Controls % | AIH % | PBC % | |
|---|---|---|---|
| -794 CATT5–8 | (N=286) | (N=41) | (N=262) |
|
| |||
| 5 | 23.8 | 26.1 | 31.1* |
|
| |||
| 6 | 63.6 | 51.1 | 61.5 |
|
| |||
| 7 | 11.9 | 20.5‡ | 7.3† |
|
| |||
| 8 | 0.7 | 2.3 | 0.2 |
|
| |||
| 55 | 9.8 | 13.6 | 16.4§ |
| 56 | 23.4 | 22.7 | 24.8 |
| 57 | 4.2 | 2.3 | 4.6 |
| 58 | 0.3 | 0 | 0 |
| 66 | 45.5 | 31.8 | 45.4 |
| 67 | 12.6 | 13.6 | 6.9 |
| 68 | 0.3 | 2.3 | 0.4 |
| 77 | 3.5 | 11.4||,¶ | 1.5 |
| 78 | 0 | 2.3 | 0 |
| 88 | 0.3 | 0 | 0 |
|
| |||
| -173 C/G | (N=286) | (N=45) | (N=304) |
|
| |||
| C | 12.4 | 15.6 | 15.8 |
|
| |||
| G | 87.6 | 84.4 | 84.2 |
| CC | 1.4 | 2.2 | 2.3 |
| CG | 22.0 | 28.8 | 27.0 |
| GG | 76.6 | 69.0 | 70.7 |
1. Allele:
- CATT5
- *PBC vs. Healthy controls [OR 1.34, CI 1.05–1.7, p=0.0165, adjusted p=0.0331]
- CATT7
- AIH vs. Healthy controls [OR 1.68, CI 1.0–2.84, p=0.051, adjusted p=0.114]
- †PBC vs. Healthy controls [OR = 0.63, CI 0.43–0.93, p=0.0188, adjusted p=0.0389].
- CATT5
- AIH vs. PBC [p = 0.627, adjusted p=0.899]
- CATT7
- ‡AIH vs. PBC [p=0.00102, adjusted p=0.0013].
2. Genotype:
- CATT55
- §PBC vs. Healthy controls [OR 1.81, CI 1.09–3.01, p=0.022, adjusted p=0.099]
- CATT77
- ||AIH vs. Healthy controls [OR 3.83, CI 1.24–11.85, p=0.0196, adjusted p=0.0704]
- PBC vs. Healthy controls [OR 0.43, CI 0.13–1.38, p=0.156, adjusted p=0.639].
- CATT55
- AIH vs. PBC [p=0.774]
- CATT77
- ¶AIH vs. PBC [p=0.00158, adjusted p=0.0074].
The allele frequencies between the PBC and AIH patients overall were significantly different (chi-square test, p=0.0105). When the frequencies for each allele were compared, the high expression MIF -794 CATT7 allele was 2.59 times less frequent in PBC than in AIH patients (7.3 vs. 20.5%, p=0.00102). The p value on permutation testing was p=0.0013, (Table 2). Additionally, we found a significant decrease in the MIF -794 CATT77 genotype frequency in PBC patients compared to AIH patients (1.5% vs. 11.4%, p=0.00158) with a p value on permutation testing of 0.0074. There also was a trend toward increased CATT77 genotype in AIH patients compared to healthy controls. These findings suggest that the MIF genetic profile for PBC may be distinct from AIH and healthy controls, with a notable decreased frequency of the high-expression MIF -794 CATT7 allele in PBC.
MIF -173 G/C Alleles
A total of 304 PBC and 45 AIH patients and 286 healthy controls were genotyped at the -173 G/C SNP. The -173 G/C SNP is only 621 bases upstream from the -794 CATT5–8 microsatellite site and most likely reflects MIF promoter functionality on the basis of linkage disequilibrium9. We found evidence of linkage disequilibrium between the -794 CATT5–8 and -173 G/C SNP loci in our control group, with D′ of 0.63 (p<1e-10), in accordance with prior reports in Caucasian populations20. There were no significant differences between the -173 G/C alleles or genotypes among the cohorts, (Table 2). There was also no relationship between serum MIF concentrations and different MIF alleles (data not shown). Such correlations have not been uniformly observed in other diseases21, possibly because the plasma compartment may not accurately reflect tissue-specific differences in MIF expression.
A soluble form of the MIF receptor (CD74) identified in autoimmune liver disease
Since the MIF receptor, CD74, is expressed by several cell types within the inflamed liver (Figure 3A) and cytokine receptor shedding is a well described immunoregulatory mechanism for the control of cytokine pathways22, we developed a two antibody, competitive sandwich ELISA to test for the presence of circulating CD74 in serum and analyzed samples from the cohorts used previously for assessing MIF serum concentrations. A significant increase in the median level of immunoreactive, circulating CD74 protein in patients with AIH was observed when compared to controls (38.13 vs. 14.2 ng/mL, p<0.001), (Figure 3B). As with serum MIF, median serum CD74 levels were not significantly different between patients taking 0–5 mg compared to >5 mg of daily prednisone: 44.8 (N=29) vs. 33.1 (N=23) ng/mL, p=NS.
Surprisingly, significantly higher levels of circulating CD74 were present in PBC sera compared to both the AIH cohort as well as controls (171.57 vs. 14.2 ng/ml, p<0.001). Although we did not find a correlation between serum MIF and circulating CD74 in AIH (p=NS), the correlation coefficient in the PBC cohort was 0.456 (p=0.002). The marked serological difference between AIH and PBC was further emphasized when calculated CD74/MIF ratios were expressed after converting CD74-to-MIF serum concentration (ng/mL) ratios into molar values, (Figure 3C). Furthermore, the CD74/MIF ratio negatively correlated with serum ALT values in a small sample of patients with AIH who experienced a relapse measured by liver enzymes and had serial serum measurements, (Figure 3D). No correlation was identified between serum ALT and the CD74/MIF ratio in the PBC cohort (data not shown).
Immunoblots confirmed the presence of a circulating CD74 protein from AIH, PBC and controls. CD74 is a type II receptor protein expressed in four possible isoforms that depend on alternative translation initiation and the insertion of an additional C-terminal exon3. Using cell lysates from COS-7 cells expressing recombinant full-length CD741–232 protein as a molecular weight standard13, CD74 was immunoprecipitated from human serum. Sera contained a single, immunoreactive band of approximately 25 kDa, compared to the 31 kDa band for recombinant CD741–232, (Figure 4A). Given that full-length CD741–232 has a calculated molecular weight of 26.5 kDa, the additional 4.5 kDa present in the 31 kDa control band is consistent with known post-translational glycosylation of CD74 on its extracellular domain23. To confirm that post-translational glycosylation occurs in circulating CD74 and recombinant CD741–232, we treated serum with deglycosylases prior to immunoprecipitation. This step produced a clear shift in molecular weight of serum CD74 from 25 kDa to approximately 20 kDa, (Figure 4B, left panel). The recombinant CD741–232 protein also exhibited a 5 kDa band shift with deglycosylation (Figure 4B, right panel). Therefore, the 6 kDa difference in size between CD741–232 and circulating serum CD74 cannot be attributed to glycosylation and is likely due to additional proteolysis of full-length CD74 to yield a truncated protein. Proteolytic cleavage at the transmembrane portion of CD74 during regulated intra-membrane proteolysis in B lymphocytes is known to produce a 6 kDa (58 amino acid) cytosolic fragment24,25, shown in Figure 4C. Such cleavage also may account for the difference in band size observed between serum circulating CD74 and full-length CD741–232. These results suggest that circulating serum CD74 is a membrane truncated protein that may be released after processing by proteolysis. We also tested for the presence of a circulating CD74 intracellular fragment in the serum by performing western blotting of AIH and PBC serum using an anti-CD74 antibody specific for the protein’s intra-cellular domain but found no evidence of this fragment in the circulating (data not shown).
Figure 4.

Identification and characterization of circulating CD74. A. Recombinant CD741–232 electrophoresed as control, and serum circulating CD74 was immunoprecipitated from human samples. A single protein band was identified at 31 kDa for CD741–232 and at 25 kDa in serum samples. B. Serum circulating CD74 (Left Panel) and recombinant CD741–232 (Right Panel) before and after deglycosylation. C. Schematic diagram and molecular weights of CD74 illustrating its cytosolic, transmembrane (TM) and extracellular domains, and predicted extracellular glycosylation sites23. The measured circulating CD74 peptide (25 kDa) is shown alongside the known cytosolic peptide that is produced by regulated intra-membrane proteolytic (RIP) cleavage. D. Western blotting analysis of supernatants obtained over time from hepatic stellate cells stimulated with or without IFN-γ (200 U/mL). E. Detection of full length (arrow) and truncated CD74 peptides in the hepatic microenvironment. Western blotting analysis of human whole liver lysate, using anti-CD74 detection antibody.
We next investigated the potential cellular source of circulating CD74. The HSC expresses high levels of CD74 in response to IFN-γ26, which is a relevant inflammatory signal in autoimmune hepatitis27. CD74 also mediates MIF inflammatory signaling on HSC28. Accordingly, we hypothesized that HSC might be an source of circulating CD74. Stimulation of human HSC with IFN-γ produced a single anti-CD74 reactive band at 72 and 96 hours, similar in size to full length, recombinant CD741–232, (Figure 4D). This result indicates that HSC can release the MIF receptor in response to the T cell cytokine IFN-γ. It is possible that full-length CD74 is released by HSC through an alternate, exosomal mechanism as occurs in other soluble cytokine receptor pathways22. Finally, a whole liver lysate was generated from healthy human liver tissue and analyzed by western blotting. We detected both full length (31 kDa) and lower molecular weight, immunoreactive CD74 peptides in the hepatic microenvironment, (Figure 4E). Our findings do not exclude the possibility that other cell types might also contribute to the release of full length and truncated CD74 into the circulation.
Serum CD74 neutralizes MIF bioactivity
The CD74 ectodomain (CD7473–232) binds to MIF with nM affinity14. To assess the structural basis of this interaction, we prepared a recombinant CD7473–232-Fc fusion protein to model circulating CD74 and tested its reactivity in an MIF peptide epitope scan. An overlapping series of 6–10mer MIF peptides were synthesized, immobilized, and incubated with a recombinant CD7473–232-Fc fusion protein. Bound CD7473–232-Fc was detected by fluorescently-labeled, anti-Fc IgG. The two highest scoring peptides corresponded to MIF79–88 (Figure 5A), which is located within MIF’s solvent accessible, second α2-helix29. We confirmed reactivity at this site by a competitive, MIF/CD7473–232 binding assay in which the minimally reactive peptide MIF79–86 was tested for competition of biotinylated MIF binding to the immobilized CD74 ectodomain (CD7473–232), (Figure 5B). This synthetic peptide inhibited MIF interaction with CD74 with an IC50 of 2.24 μM.
Figure 5.

A. MIF epitope scan for reactivity of the CD74 ectodomain versus overlapping MIF peptides. Peptide microarray fluorescence image analysis of a portion of the epitope scan showing high anti-IgG Cy5 reactivity with bound CD7473–232-Fc. B. Confirmation of MIF79–86 peptide reactivity with CD7473–232 by competition for biotinylated MIF binding to plate-bound CD7473–232 (IC50 =2.24 μM). Control peptide was scrambled MIF79–86. C–E: Circulating CD74 neutralizes MIF. Phosphorylated ERK1/2 (pERK1/2) and total ERK1/2 activity was measured by densitometry scanning of 3 gels and presented as a ratio as previously described13. Statistically significant differences were noted (* p<0.05, ** p<0.01, *** p<0.001). C. Human skin fibroblasts (3.6×10⁵ cells/well) were incubated with human MIF (2.7 nM), anti-MIF, human CD7473–232, and AIH, PBC or control serum as described in the Methods. D. AIH sera were incubated with or without control IgG or pre-adsorbed with anti-CD74 antibody followed by incubation with human MIF (2.7 nM). E. PBC sera were incubated with or without control IgG or pre-adsorbed with anti-CD74 antibody followed by incubation with human MIF (2.7 nM).
We next assessed the ability of circulating CD74 to neutralize MIF pro-inflammatory activity by measuring MIF stimulated ERK1/2 phosphorylation in human primary skin fibroblasts cultured in the presence of AIH or control serum. As shown in Figures 5C–E, MIF-dependent ERK1/2 phosphorylation was inhibited by AIH and PBC serum but not by control serum. Moreover, the MIF-neutralizing capacity of CD74 in both AIH and PBC sera was eliminated by pre-absorption of serum with anti-CD74. Further, there was a greater degree of MIF neutralization in PBC vs. AIH serum (p=0.02), (Figure 5C). These data support the conclusion that circulating, serum CD74 both binds and neutralizes MIF in the serum of AIH and PBC patients.
To determine if CD74 can circulate in a complex bound to MIF, we established a two antibody sandwich ELISA to capture and quantify MIF-CD74 protein complexes in serum using wells pre-coated with anti-CD74 and detection with an anti-MIF monoclonal antibody. MIF was detectable in CD74 captured by plate-bound anti-CD74 in sera from controls and both PBC and AIH patients. In controls (N=15) the mean MIF-CD74 complex reading was 0.1±0.2 OD (mean free MIF 6.3 ng/mL, free CD74 134 ng/mL and calculated CD74/MIF ratio 19). In AIH (N=16) the mean MIF-CD74 complex reading was 0.04±0.03 OD (mean free MIF 9.9 ng/mL, free CD74 241.9 ng/mL, calculated CD74/MIF ratio 24.4). In PBC (N=16) the mean MIF-CD74 complex reading was 0.09±0.14 OD (mean free MIF 15.1 ng/mL, free CD74 831 ng/mL, calculated CD74/MIF ratio 55.2). Although there was a trend toward a lower MIF-CD74 complex level in AIH, we found no significant difference in the serum MIF-CD74 complex levels between the three cohorts (p=NS). However, in the AIH cohort MIF-CD74 complex levels correlated with free CD74 levels (r=0.710, p=0.002), suggesting that in AIH the level of circulating CD74 may drive the complex formation and subsequent neutralization of free MIF.
DISCUSSION
This is the first report of MIF expression and MIF gene associations in autoimmune liver disease. MIF was significantly elevated in AIH and PBC sera compared to healthy controls, and both the expression of MIF and its receptor, CD74, was increased in liver tissues. Compared to patients with AIH, patients with PBC had a lower frequency of the high MIF expression, -794 CATT7 allele. We also report the identification and biochemical characterization of a circulating form of the MIF receptor ectodomain (CD74) and show that it binds MIF and neutralizes its signal transduction activity. Circulating serum levels of CD74 were markedly elevated in PBC compared to AIH and stimulation of human hepatic stellate cells with IFN-γ resulted in release of CD74 in vitro. These results suggest distinct genetic and serum profiles of MIF and its circulating receptor CD74 in AIH and PBC, which may explain their different immunopathologic profiles.
MIF activates both innate and adaptive immune systems, and in particular promotes Th1 immunity, which is a key element of AIH pathophysiology27,30. The expression of MIF in liver parenchymal cells further supports its active participation in the inflammatory cascade. Elevated serum MIF concentrations in patients with AIH and PBC are consistent with studies of other autoimmune disorders characterized by circulating autoantibodies, such as SLE and rheumatoid arthritis. In these disorders, circulating MIF also correlates with disease activity31,32. We speculate that the elevated MIF concentrations in our patients represent a continuous, but often subclinical autoimmune pro-inflammatory state. While many patients with AIH were treated with low-dose glucocorticoids at the time of sample collections, MIF levels did not differ from those off steroids and elevated MIF levels were similar in PBC patients who are not managed with steroids. Although serum MIF levels were previously described in patients with chronic hepatitis B infection19, the identification of serum MIF and CD74 in AIH patients is novel and can add to the understanding of its pathophysiology. The negative correlation between the calculated serum ratio of CD74/MIF and serum ALT in AIH patients who experienced a relapse as measured by serum liver tests (Figure 3D) suggests that the concentration of MIF relative to its neutralizing receptor may be a potential marker of immunogenic inflammation in the liver in AIH. This was not found in the PBC cohort, possibly due to the lack of a relationship between serum enzymes and the disease status in that condition. Given the need for markers to predict recrudescence of inflammation in the management of chronic AIH, this initial description of MIF and CD74 in AIH suggests that MIF, CD74, or MIF-CD74 complexes may be candidate immunologic biomarkers of disease activity. Further longitudinal studies will be needed.
The pathogenesis of autoimmune liver diseases is believed to be dependent on genetic predisposition compounded by environmental stimuli17,18. Previous reports have identified associations with human leukocyte antigen (HLA) alleles, particularly DRB1*0301 and DRB1*0401 in AIH33,34, and DR8 and DQB1 in PBC35,36 and a number of non-HLA genetic polymorphisms also have been identified, including cytotoxic T lymphocyte antigen-4 (CTLA-4) in AIH and PBC37,38, and the IL12A locus in PBC36. Here, we present evidence of genetic associations with the -794 CATT5–8 microsatellite polymorphism in the MIF promoter, highlighting a genetic-phenotypic relationship between known MIF functional alleles and the clinical profile of AIH vs. PBC. Importantly, these alleles are prevalent in the population20 and further studies should investigate discrete clinical phenotypes to understand if these MIF promoter alleles predict clinical progression of disease, as they do in SLE23. The odds ratio of 1.34 (p=0.0331) for the low MIF expression CATT5 allele in PBC versus controls is very similar to the recently described genetic associations with HLA and non-HLA polymorphisms36.
The higher frequency of the -794 CATT7 allele (p=0.0013) and CATT77 genotype (p=0.0074) in AIH compared to PBC patients is consistent with the Th1 induced and IFN-γ mediated pro-inflammatory phenotype of AIH. AIH also is more responsive to immunosuppression. Because our genetic data indicate that AIH but not PBC is linked to a high expression MIF allele, elevated MIF expression in AIH may be driven more directly by the MIF locus whereas in PBC, increased MIF levels may reflect the secondary stimulatory action of other inflammatory or immunologic pathways. Finally, the unique MIF genetic profile of AIH patients is worth comparing with SLE as each are ANA-positive diseases. Indeed, the -794 CATT77 genotype frequencies were much higher in AIH compared to recent studies in SLE9. This may reflect different host responses to environmental triggers for these diseases or the greater clinical heterogeneity of SLE. However, caution is needed when interpreting the CATT77 genotype data due to the relatively small number of studied patients
CD74 is a type II transmembrane receptor and initiates MIF signal transduction by recruitment of CD44 or in complex with chemokine receptors13,14,39. CD74 is expressed constitutively on the surface of antigen presenting cells, as well as epithelial and different stromal cells. We demonstrated CD74 staining within the liver of patients with AIH and PBC, predominantly in the hepatic sinusoids but with increased involvement of hepatocytes in severe AIH suggesting that CD74 may be involved in the autoimmune response to hepatic antigen.
Our identification of a bioactive circulating form of the MIF receptor adds new insight into the modulation of MIF’s cytokine properties. The 25 kDa circulating protein is 6 kDa smaller than the full-length, transmembrane CD74 protein, but remains modified by post-translational glycosylation present in the extracellular domain23. Extensive literature exists describing the role of the invariant chain, which is the intracellular expressed form of CD74, in antigen processing40–42. A report by Eynon et al. described the role of a secreted 25 kDa invariant chain fragment in the inhibition of T cell activation42. Although the circulating CD74 fragment we identified has the same molecular weight, it is unclear whether the mechanism of secretion and the biologic properties are similar. Our findings indicated that the circulating CD74 peptide is truncated compared to full-length CD74, and we suggest that the difference in molecular weight may be accounted for by regulated intra-membrane proteolysis, which has been reported to generate a 6 kDa intra-cytosolic peptide fragment that upregulates NF-κB transcription24.
Maubach et al. previously reported upregulation of CD74 in IFN-γ stimulated HSC26. Here we demonstrated the release of a non-truncated CD74 peptide into the supernatants of human HSC after stimulation with IFN-γ, which is a product of activated T cells. These data support the known role of T cells in autoimmune hepatitis27 and suggest a model whereby IFN-γ drives the production of circulating CD74 from hepatic stellate cells in vivo. The proteolytic mechanism responsible for creating the single, 25 kDa CD74 peptide that circulates in serum remains to be elucidated, and we identified several smaller CD74 immunoreactive bands in whole liver lysate analysis, (Figure 4E). Therefore, it is possible that additional cell types in the liver can release CD74 in AIH and PBC.
We also showed that circulating CD74 is bioactive and neutralizes MIF signal transduction activity, suggesting that circulating CD74 modulates MIF activity in vivo. MIF epitope scanning studies indicate that the CD74 ectodomain binds MIF in its α-2 helical domain. How this domain interacts with MIF’s N-terminal region, which also has been implicated in receptor binding by site-mediated mutagenesis studies43, remains to be elucidated. That circulating CD74 binds MIF in vivo was confirmed by ELISA detection of circulating MIF-CD74 complexes. The existence of this complex is expected given the KD for MIF with the CD74 ectodomain of 1.4 × 10⁻⁹ M44.
Finally, we found differential levels of circulating CD74 between AIH and PBC with higher median levels in PBC compared to AIH. Since CD74 neutralizes MIF function, the calculated molar ratio of circulating CD74/MIF may be a clinical indicator of the pro-inflammatory activity of MIF. The ratio of CD74/MIF clearly distinguished AIH from PBC, where patients with AIH have a much lower CD74-to-MIF ratio compared to patients with PBC. This finding may have additional clinical significance, since PBC is a less active inflammatory disease than AIH. Whether CD74 circulates in other autoimmune inflammatory diseases, and if the CD74/MIF ratio may distinguish clinical subtypes of disease or predict disease progression, remains to be studied. Lastly, further basic and clinical investigation is needed to evaluate the hypothesis that CD74 functions to regulate MIF inflammatory activity on a cellular and systemic level.
In conclusion, our findings suggest the existence of differences in both serum MIF and CD74 levels, and in functional MIF polymorphism distributions in patients with AIH and PBC that reflect known phenotypic differences between these two disorders. Furthermore, we have identified an endogenous modulator of MIF activity in the form of circulating CD74. Lastly, the unique relationship between CD74 and MIF in AIH vs. PBC suggests that these proteins might be suitable candidates for evaluation as biomarkers of disease activity.
Supplementary Material
Acknowledgments
This project was supported by:
NIH Grant DK34989: Silvio O. Conte Digestive Diseases Research Core Centers – 5P30DK034989 (DA)
NIH Digestive Diseases Research Core Centers (DK034989-28) Liver Center Pilot Project Award (DA)
American Liver Foundation Postdoctoral Autoimmune Hepatitis Grant (DA)
NIH T32 DK007356-33 (DA)
DFG BE1977/4-2, SFB/TRR57-P07 (JB)
NIH AR050498, AR049610 (RB)
N01-HHSN272201100019C (RB)
The authors gratefully acknowledge the assistance of Amos Brooks (Yale Research Histology) with the immunohistochemical staining of human liver tissue, and Dr. M. Eric Gershwin for assistance in obtaining Dr. Kaplan’s PBC sample repository. We also thank the patients of Yale Liver Clinics for their participation in clinical research. Finally, we would like to dedicate this work to the memory of our co-author and colleague, the late Dr. Marshall M. Kaplan.
Footnotes
Disclosures:
Dr. Bucala is a co-inventor on patent applications describing the utility of MIF genotype determination. The authors have no additional financial interests.
-
Study Concept and Design
- David N. Assis, Lin Leng, James L. Boyer, Richard Bucala
-
Acquisition of Data
- David N. Assis, Lin Leng, Xin Du, Catherine McCrann
-
Analysis and Interpretation of Data
- David N. Assis, Lin Leng, James L. Boyer, Richard Bucala
-
Conceptual input and critical Revision of Manuscript
- Andreas Meinhardt, David J. Nikolic-Pateron, Jürgen Bernhagen.
-
Statistical Analysis
- Clarence K. Zhang, Hongyu Zhao
-
Technical support
- Gerrit Grieb, Melanie Merk, Alvaro Baeza Garcia, Julius Chapiro, Yuka Mizue, Marshall M. Kaplan
-
Study Supervision
- Lin Leng, Richard Bucala
References
- 1.Grieb G, Merk M, Bernhagen J, et al. Macrophage migration inhibitory factor (MIF): a promising biomarker. Drug News Perspect. 2010;23:257–264. doi: 10.1358/dnp.2010.23.4.1453629. [DOI] [PMC free article] [PubMed] [Google Scholar]
- 2.Calandra T, Roger T. Macrophage migration inhibitory factor: a regulator of innate immunity. Nat Rev Immunol. 2003;3:791–800. doi: 10.1038/nri1200. [DOI] [PMC free article] [PubMed] [Google Scholar]
- 3.Calandra T, Bernhagen J, Metz C, et al. MIF as a glucocorticoid-induced modulator of cytokine production. Nature. 1995;377:68–71. doi: 10.1038/377068a0. [DOI] [PubMed] [Google Scholar]
- 4.Flaster H, Bernhagen J, Calandra T, et al. The macrophage migration inhibitory factor-glucocorticoid dyad: regulation of inflammation and immunity. Mol Endocrinol. 2007;21:1267–1280. doi: 10.1210/me.2007-0065. [DOI] [PubMed] [Google Scholar]
- 5.Radstake TR, Sweep FC, Welsing P, et al. Correlation of rheumatoid arthritis severity with the genetic functional variants and circulating levels of macrophage migration inhibitory factor. Arthritis Rheum. 2005;52:3020–3029. doi: 10.1002/art.21285. [DOI] [PubMed] [Google Scholar]
- 6.Wu SP, Leng L, Feng Z, et al. Macrophage migration inhibitory factor promoter polymorphisms and the clinical expression of scleroderma. Arthritis Rheum. 2006;54:3661–3669. doi: 10.1002/art.22179. [DOI] [PubMed] [Google Scholar]
- 7.Murakami H, Akbar SMF, Matsui H, et al. Macrophage migration inhibitory factor in the sera and at the colonic mucosa in patients with ulcerative colitis: clinical implications and pathogenic significance. Eur J Clin Invest. 2001;31:337–343. doi: 10.1046/j.1365-2362.2001.00796.x. [DOI] [PubMed] [Google Scholar]
- 8.Nohara H, Okayama N, Inoue N, et al. Association of the -173 G/C polymorphism of the macrophage migration inhibitory factor gene with ulcerative colitis. J Gastroenterol. 2004;39:242–246. doi: 10.1007/s00535-003-1284-7. [DOI] [PubMed] [Google Scholar]
- 9.Sreih A, Ezzeddine R, Leng L, et al. Dual effect of the macrophage migration inhibitory factor gene on the development and severity of human systemic lupus erythematosus. Arthritis Rheum. 2011;63:3942–3951. doi: 10.1002/art.30624. [DOI] [PMC free article] [PubMed] [Google Scholar]
- 10.Johnson PJ, McFarlane IG. Meeting report: International Autoimmune Hepatitis Group. Hepatology. 1993;18:998–1005. doi: 10.1002/hep.1840180435. [DOI] [PubMed] [Google Scholar]
- 11.Bonder A, Retana A, Winston DM, et al. Prevalence of primary biliary cirrhosis-autoimmune hepatitis overlap syndrome. Clin Gastroenterol Hepatol. 2011;9:609–612. doi: 10.1016/j.cgh.2011.03.019. [DOI] [PubMed] [Google Scholar]
- 12.Fingerle-Rowson G, Koch P, Bikoff R, et al. Regulation of macrophage migration inhibitory factor expression by glucocorticoids in vivo. Am J Pathol. 2003;162:47–56. doi: 10.1016/S0002-9440(10)63797-2. [DOI] [PMC free article] [PubMed] [Google Scholar]
- 13.Shi X, Leng L, Wang T, et al. CD44 is the signaling component of the macrophage migration inhibitory factor-CD74 receptor complex. Immunity. 2006;25:595–606. doi: 10.1016/j.immuni.2006.08.020. [DOI] [PMC free article] [PubMed] [Google Scholar]
- 14.Leng L, Metz CN, Fang Y, et al. MIF signal transduction initiated by binding to CD74. J Exp Med. 2003;197:1467–1476. doi: 10.1084/jem.20030286. [DOI] [PMC free article] [PubMed] [Google Scholar]
- 15.Zhao JH. Genecounting and HAF: computer programs for linkage disequlibrium analysis. Bioinformatics. 2004;20:1325–1326. doi: 10.1093/bioinformatics/bth071. [DOI] [PubMed] [Google Scholar]
- 16.Wigginton JE, Abecasis GR. Pedstats: descriptive statistics, graphics and quality assessment for gene mapping data. Bioinformatics. 2005;21:3445–3447. doi: 10.1093/bioinformatics/bti529. [DOI] [PubMed] [Google Scholar]
- 17.Krawitt EL. Autoimmune hepatitis. N Engl J Med. 2006;354:54–66. doi: 10.1056/NEJMra050408. [DOI] [PubMed] [Google Scholar]
- 18.Kaplan MM, Gershwin ME. Primary biliary cirrhosis. N Engl J Med. 2005;353:1261–1273. doi: 10.1056/NEJMra043898. [Erratum in N Engl J Med 2006;354:313.] [DOI] [PubMed] [Google Scholar]
- 19.Zhang HY, Nanji AA, Luk JM, et al. Macrophage migration inhibitor factor expression correlates with inflammatory changes in human chronic hepatitis B infection. Liver Int. 2005;25:571–579. doi: 10.1111/j.1478-3231.2005.01047.x. [DOI] [PubMed] [Google Scholar]
- 20.Zhong XB, Leng L, Beitin A, et al. Simultaneous detection of microsatellite repeats and SNPs in the macrophage migration inhibitory factor (MIF) gene by thin-film biosensor chips and application to rural field studies. Nucleic Acids Res. 2005;33:e121. doi: 10.1093/nar/gni123. [DOI] [PMC free article] [PubMed] [Google Scholar]
- 21.Yende S, Angus DC, Kong L, et al. The influence of macrophage migration inhibitory factor gene polymorphism on outcome from community-acquired pneumonia. FASEB J. 2009;23:2403–2411. doi: 10.1096/fj.09-129445. [DOI] [PMC free article] [PubMed] [Google Scholar]
- 22.Levine SJ. Molecular mechanisms of soluble cytokine receptor generation. J Biol Chem. 2008;283:14177–14181. doi: 10.1074/jbc.R700052200. [DOI] [PMC free article] [PubMed] [Google Scholar]
- 23.Borghese F, Clanchy FIL. CD74: an emerging opportunity as a therapeutic target in cancer and autoimmune disease. Expert Opin Ther Targets. 2011;15:237–251. doi: 10.1517/14728222.2011.550879. [DOI] [PubMed] [Google Scholar]
- 24.Matza D, Kerern A, Medvedovsky H, et al. Invariant chain-induced B cell differentiation requires intramembrane proteolytic release of the cytosolic domain. Immunity. 2002;17:549–560. doi: 10.1016/s1074-7613(02)00455-7. [DOI] [PubMed] [Google Scholar]
- 25.Becker-Herman S, Arie G, Medvedovsky H, et al. CD74 is a member of the regulated intramembrane proteolysis-processed protein family. Mol Biol Cell. 2005;16:5061–5069. doi: 10.1091/mbc.E05-04-0327. [DOI] [PMC free article] [PubMed] [Google Scholar]
- 26.Maubach G, Lim MC, Kumar S, et al. Expression and upregulation of cathepsin S and other early molecules required for antigen presentation in activated hepatic stellate cells upon IFN-gamma treatment. Biochim Biophys Acta. 2007;1773:219–231. doi: 10.1016/j.bbamcr.2006.11.005. [DOI] [PubMed] [Google Scholar]
- 27.Vergani D, Mieli-Vergani G. Aetiopathogenesis of autoimmune heaptitis. World J Gastroenterol. 2008;14:3306–3312. doi: 10.3748/wjg.14.3306. [DOI] [PMC free article] [PubMed] [Google Scholar]
- 28.Heinrichs D, Knauel M, Offermanns C, et al. Macrophage migration inhibitory factor (MIF) exerts antifibrotic effects in experimental liver fibrosis via CD74. Proc Natl Acad Sci USA. 2011;108:17444–17449. doi: 10.1073/pnas.1107023108. [DOI] [PMC free article] [PubMed] [Google Scholar]
- 29.Sun WH, Bernhagen J, Bucala R, et al. Crystal structure at 2. 6-A resolution of human macrophage migration inhibitory factor. Proc Natl Acad Sci USA. 1996;93:5191–5196. doi: 10.1073/pnas.93.11.5191. [DOI] [PMC free article] [PubMed] [Google Scholar]
- 30.Bacher M, Metz CN, Calandra T, et al. An essential regulatory role for macrophage migration inhibitory factor in T-cell activation. Proc Natl Acad Sci USA. 1996;93:7849–7854. doi: 10.1073/pnas.93.15.7849. [DOI] [PMC free article] [PubMed] [Google Scholar]
- 31.Kim HR, Park MK, Cho ML, et al. Macrophage migration inhibitory factor upregulates angiogenic factors and correlates with clinical measures in rheumatoid arthritis. J Rheumatol. 2007;34:927–936. [PubMed] [Google Scholar]
- 32.Foote A, Briganti EM, Kipen Y, et al. Macrophage migration inhibitory factor in systemic lupus erythematosus. J Rheumatol. 2004;31:268–273. [PubMed] [Google Scholar]
- 33.Doherty DG, Donaldson PT, Underhill JA, et al. Allelic sequence variation in the HLA class II genes and protein in patients with autoimmune hepatitis. Hepatology. 1994;19:609–615. doi: 10.1002/hep.1840190311. [DOI] [PubMed] [Google Scholar]
- 34.Strettell MD, Donaldson PT, Thomson JL, et al. Allelic basis for HLA-encoded susceptibility to type 1 autoimmune hepatitis. Gastroenterology. 1997;112:2028–2035. doi: 10.1053/gast.1997.v112.pm9178696. [DOI] [PubMed] [Google Scholar]
- 35.Gregory WL, Mehal W, Dunn AN, et al. Primary biliary cirrhosis: Contribution of HLA class II allele DR8. Q J Med. 1993;86:393–399. [PubMed] [Google Scholar]
- 36.Hirschfield G, Liu X, Xu C, et al. Primary biliary cirrhosis associated with HLA, IL12A, and IL12RB2 variants. New Engl J Med. 2009;360:2544–2555. doi: 10.1056/NEJMoa0810440. [Erratum in N Engl J Med 2009;360:2797–2798.] [DOI] [PMC free article] [PubMed] [Google Scholar]
- 37.Agarwal K, Czaja AJ, Jones DEJ, et al. Cytotoxic T lymphocyte-4 (CTLA-4) gene polymorphisms and susceptibility to type 1 autoimmune hepatitis. Hepatology. 2000;31:49–53. doi: 10.1002/hep.510310110. [DOI] [PubMed] [Google Scholar]
- 38.Fan LY, Tu XQ, Cheng QB, et al. Cytotoxic T lymphocyte associated antigen-4 gene polymorphisms confer susceptibility to primary biliary cirrhosis and autoimmune hepatitis in Chinese population. World J Gastroenterol. 2004;10:3056–3059. doi: 10.3748/wjg.v10.i20.3056. [DOI] [PMC free article] [PubMed] [Google Scholar]
- 39.Bernhagen J, Krohn R, Lue H, et al. MIF is a noncognate ligand of CXC chemokine receptors in inflammatory and atherogenic cell recruitment. Nat Med. 2007;13:587–596. doi: 10.1038/nm1567. [DOI] [PubMed] [Google Scholar]
- 40.Arunachalam B, Lamb CA, Cresswell P. Transport properties of free and MHC class Il-associated oligomers containing different isoforms of human invariant chain. Int Immunol. 1993;6:439–451. doi: 10.1093/intimm/6.3.439. [DOI] [PubMed] [Google Scholar]
- 41.Bevec T, Stoka K, Pungercic G, et al. Major histocompatibility complex class II-associated p41 invariant chain fragment is a strong inhibitor of lysosomal cathepsin L. J Exp Med. 1996;183:1331–1338. doi: 10.1084/jem.183.4.1331. [DOI] [PMC free article] [PubMed] [Google Scholar]
- 42.Eynon EE, Schlax C, Pieters J. A secreted form of the major histocompatibility complex class II-associated invariant chain inhibiting T cell activation. J Biol Chem. 1999;274:26266–26271. doi: 10.1074/jbc.274.37.26266. [DOI] [PubMed] [Google Scholar]
- 43.Fingerle-Rowson G, Kaleswarapu DR, Schlander C, et al. A tautomerase-null macrophage migration-inhibitory factor (MIF) gene knock-in mouse model reveals that protein interactions and not enzymatic activity mediate MIF-dependent growth regulation. Mol Cell Biol. 2009;29:1922–1932. doi: 10.1128/MCB.01907-08. [DOI] [PMC free article] [PubMed] [Google Scholar]
- 44.Merk M, Zierow S, Leng L, et al. The D-dopachrome tautomerase (DDT) gene product is a cytokine and functional homolog of macrophage migration inhibitory factor (MIF) Proc Nat Acad Sci USA. 2011;108:E577–E585. doi: 10.1073/pnas.1102941108. [DOI] [PMC free article] [PubMed] [Google Scholar]
Associated Data
This section collects any data citations, data availability statements, or supplementary materials included in this article.