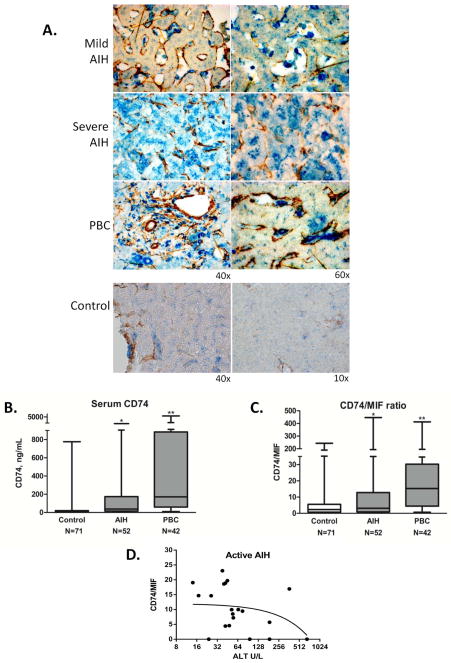
Figure 3.
A. Immunohistochemical staining for the MIF receptor, CD74 (blue), and αSMA (brown) in liver tissue sections from two patients with AIH (mild chronic vs. severe acute), one patient with PBC, and control liver tissue. All three sections revealed CD74 in the sinusoidal areas; however in severe AIH there was prominent staining diffusely in hepatocytes. Images shown are representative of 15 patient sections examined (AIH=2, PBC=5, Control=6). B. Detection of serum circulating CD74 by ELISA. Plot of immunoreactive, circulating CD74 median concentrations (Controls: 14.2±107.75 ng/mL, AIH: 38.13±430.24 ng/mL, PBC: 171.57±1195.98 ng/mL, *p<0.001 for AIH vs. Controls and for PBC vs. Controls, **p<0.001 for PBC vs. AIH). The bottom, middle, and top lines of the box demarcate the 25th, 50th, and 75th percentiles, respectively, and the vertical lines show the maximum and minimum values. C. Calculated median CD74/MIF ratio based on conversion of the serum concentrations (ng/mL) ratio into molar concentrations (Controls: 2.32±33.54, AIH: 3.13±82.56, PBC: 15.25±69.38, *p<0.0001 for PBC vs. AIH, **p<0.0001 for PBC vs. Controls). D. The serum CD74/MIF ratio correlates with serum ALT in patients with active disease. Negative correlation was found between CD74/MIF and ALT in longitudinal samples from 4 patients with AIH and at least one elevation in ALT > 2 × ULN (24 time-points). Coefficient of −0.4762, p=0.0338.

