Abstract
We are investigating three-dimensional (3D) to two-dimensional (2D) registration methods for computed tomography (CT) and dual-energy digital radiography (DR) for the detection of coronary artery calcification. CT is an established tool for the diagnosis of coronary artery diseases (CADs). Dual-energy digital radiography could be a cost-effective alternative for screening coronary artery calcification. In order to utilize CT as the “gold standard” to evaluate the ability of DR images for the detection and localization of calcium, we developed an automatic intensity-based 3D-to-2D registration method for 3D CT volumes and 2D DR images. To generate digital rendering radiographs (DRR) from the CT volumes, we developed three projection methods, i.e. Gaussian-weighted projection, threshold-based projection, and average-based projection. We tested normalized cross correlation (NCC) and normalized mutual information (NMI) as similarity measurement. We used the Downhill Simplex method as the search strategy. Simulated projection images from CT were fused with the corresponding DR images to evaluate the localization of cardiac calcification. The registration method was evaluated by digital phantoms, physical phantoms, and clinical data sets. The results from the digital phantoms show that the success rate is 100% with mean errors of less 0.8 mm and 0.2 degree for both NCC and NMI. The registration accuracy of the physical phantoms is 0.34 ± 0.27 mm. Color overlay and 3D visualization of the clinical data show that the two images are registered well. This is consistent with the improvement of the NMI values from 0.20 ± 0.03 to 0.25 ± 0.03 after registration. The automatic 3D-to-2D registration method is accurate and robust and may provide a useful tool to evaluate the dual-energy DR images for the detection of coronary artery calcification.
Keywords: Registration, Dual-energy digital radiography, computed tomography (CT), coronary artery disease (CADs)
1. INTRODUCTION
Cardiovascular disease is the leading cause of death in the United States, affects millions of Americans and is responsible for approximately 500,000 deaths per year [1]. As one-third of decedents died from sudden heart attack [1], early detection and diagnose can prevent acute exacerbation and may improve survive rates.
The relationship between coronary artery calcification and atherosclerotic heart diseases has been well established [2]. Early detection of coronary artery calcification is directly helpful for diagnosing atherosclerotic heart diseases. Computed tomography (CT) is an established tool for the diagnosis of coronary artery diseases (CADs) [3]. However, the increasing incidence of cardiovascular diseases requires a cost-effective, accurate and noninvasive imaging screening technique. With the recent advanced improvement of digital radiograph and flat-panel technology, dual-energy digital radiography (DR) may be a cost-effective, alternative tool for screening cardiac calcification [4, 5, 6]. Currently, dual-energy digital radiography can produce standard x-ray images, subtracted soft-tissues images and subtracted bone images that optionally display bone and calcified thoracic structures [7]. It may be helpful for the detection of valve and myocardial calcification. Nevertheless, as standard radiographic images lack 3D spatial information, whether it can offer accurate localization of lesions is yet to be evaluated before this technique could be applied as a screening tool for the detection of calcification.
In order to utilize cardiac CT images as the “gold standard” to evaluate the ability of DR images for the detection and localization of calcium, we propose an automatic intensity-based registration scheme for three-dimensional (3D) CT volumes and two-dimensional (2D) DR images. The registered CT projection images are fused with the corresponding DR images and thus to aid in the interpretation of DR images for the detection of cardiac calcification. We developed a variety of shear-warp factorization based projection methods including Gaussian weighted projection, threshold-based projection, and average-based projection for this particular application.
2. METHODS FOR PROJECTION AND REGISTRATION
2.1 Overview of the 3D-to-2D Registration Method
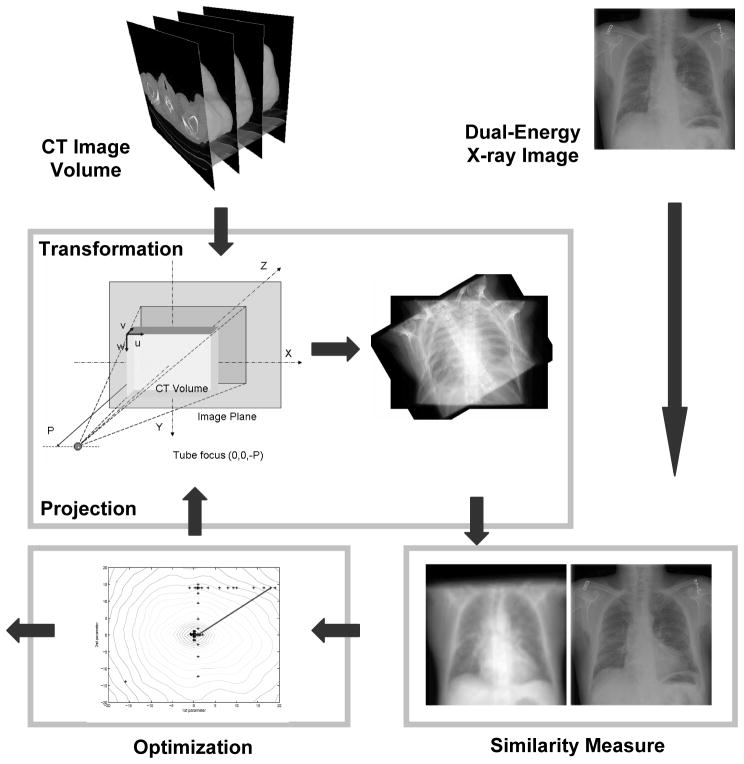
Figure 1 shows the diagram of the intensity-based 3D-to-2D registration. We first generate a digitally rendering radiograph (DRR) image from the CT volume, and then register it with the digital radiography (DR) image.
Figure 1.
Diagram of the 3D-to-2D registration of a CT volume and a digital radiography image. Digitally rendering radiograph (DRR) images are first generated from the 3D CT image volume. DRR images are registered with the dual-energy DR images using a mutual information registration algorithm. The CT volume is transformed to optimize the similarity using a Downhill Simplex method.
2.2 Projection Method
We use a shear-warp factorization method to generate DRR images [8]. In this method, a viewing transformation is applied to simplify the projection processing. The algorithm uses a principal viewing axis to choose a set of CT voxel slices that will be resampled and composited. It also determines the order of the slices along the front-to-back traversal of the volume. Generally, a perspective viewing transformation matrix is the multiplication of a permutation matrix, a matrix for shifting the origin, a 3D perspective shear scale matrix, and a 2D warp matrix [8]. We use the projection parameters that are used for real DR image acquisitions, which include the distance between the X-ray tube’s focus and the detector plane. Once we set up a coordinate system for the projection, we determine the location of the X-ray tube and the principal view axis. These parameters are used to compute the perspective transformation matrix.
Based the shear-warp factorization method, we developed a variety of projection methods including Gaussian weighted projection, threshold-based projection, average-based projection, and maximum intensity projection for this particular application. For example, the Gaussian weighted projection uses a Gaussian function as the weighting function during the projection processing. The CT values within a calcification region can be described as a series of variables with an approximate Gaussian distribution. The image intensities within this region are described as I~N (μ, σ2). The threshold-based projection method uses a predetermined CT value as the threshold during the projection processing. The average-based projection (AVG) produces an average image along the projection line. The maximum intensity projection (MIP) method only displays the maximum intensity along the projection line.
2.3 Similarity Measurement for Registration
We used normalized mutual information (NMI) and normalized cross correlation (NCC) as the similarity between the DRR images and the DR image. Both NMI and NCC were used for other applications [9, 10, 11, 12]. NCC assumes a linear relationship between the gray values of two images. NMI can be used for multimodality image registration. Suppose the dual-energy X-ray image is the reference (R) image and the DRR image is the floating (F) image, their mutual information MI(R, F) is given as [13]:
The joint probability PRF(r, f) and marginal probabilities PR(r) of the reference images and PF(f)of the floating image, can be estimated from the normalized joint and marginal intensity histogram, respectively. NMI is defined as below:
I(R) is the entropy of reference image, .
NCC is described as below:
Where R̄(r) and F̄(f) are the average intensity of the reference and floating images.
We used the downhill Simplex method of Nelder and Mead as the search strategy [14].
3. EXPERIMENTS
3.1 Digital Phantom Experiments
We selected one set of clinical CT data to generate digital phantoms to evaluate the algorithm. This patient was suspicious for cardiac calcification on the dual-energy digital radiography (DEDR) images, which was verified by multi-detector CT (MDCT) examination. We first generated DRR images with know orientations to simulate dual-energy digital radiographic images. We then randomly selected the initial positions of the CT volume and performed 50 times 3D-to-2D registrations. We compared the transformation parameters with the ground truth. We define the registration successful if the translation is less than 2 pixels and the degree is less than 0.6 degree. Success rates are used to validate the robustness.
3.2 Physical Phantom Experiment
We designed two phantoms with 9 fiducial markers for the evaluation experiment. We acquired micro-CT data from each phantom in six different positions. We also acquired X-ray images from the same phantom at the approximately same positions. We used these physical phantom data and markers to evaluate the accuracy of 3D-to-2D registration algorithm. After 3D-to-2D registration, the distance between the corresponding markers on the registered DRR image and the DR image are calculated to represent the registration accuracy.
3.3 Clinical Image Acquisitions
We originally identified a group of 12 clinical patients with findings suspicious for cardiac calcification on the dual-energy digital radiography (DEDR) images. These patients had undergone multi-detector CT (MDCT) evaluation of the chest within 12 months of chest X-ray digital radiography. The CT examinations were obtained for a variety of clinical indications using imaging protocols that varied considerably in slice thickness, radiographic technique, and presence or absence of intravenous (IV) contrast material. The CT studies were analyzed for the presence of coronary artery, valvular, or myocardial calcification.
Patients were imaged using a digital radiography unit (Revolution XR/d, GE Healthcare). A 60-kVp image (low-energy image) was acquired first. After less than 200-msec delay, a second conventional 120-kVp image (high-energy image) was acquired. After post processing of the two images, a standard 120-kVp image, a subtracted soft-tissue image, and a subtracted bone image were presented. All the CT and DEDR images were processed using this 3D-to-2D registration method. After registration, we compared the NMI values between the DRR and DR images before and after registration.
4. RESULTS
Table 1 shows the results of digital phantoms. Each group has 50 times 3D-to-2D registrations. The success rate is 100% for both NCC and NMI with mean errors of less 0.8 mm and 0.2 degree. As measured by the fiducial markers, the registration accuracy is 0.34 ± 0.27 mm where the resolution of the micro-CT images is 0.1mm.
Table 1.
Robustness test of the registration algorithm using digital phantoms evaluation.
| Image Size | Test Methods | Success Rate 0.6Degree | Distance | ||
|---|---|---|---|---|---|
| 2 mm | 2Pixels | mm | Degree | ||
| 128×128 | NMI | 100% | 100% | 0.07 ± 0.14 | 0.001 ± 0.004 |
| 128×128 | NCC | 98% | 100% | 0.71 ± 0.55 | 0.025 ± 0.019 |
| 512×512 | NMI | 100% | 100% | 0.002 ± 0.001 | 3.4e-05 ± 1.7e-05 |
| 512×512 | NCC | 100% | 100% | 0.82 ± 0.54 | 0.021 ± 0.016 |
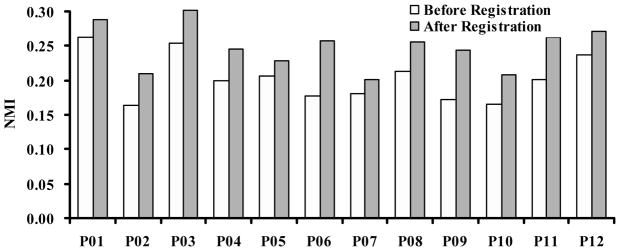
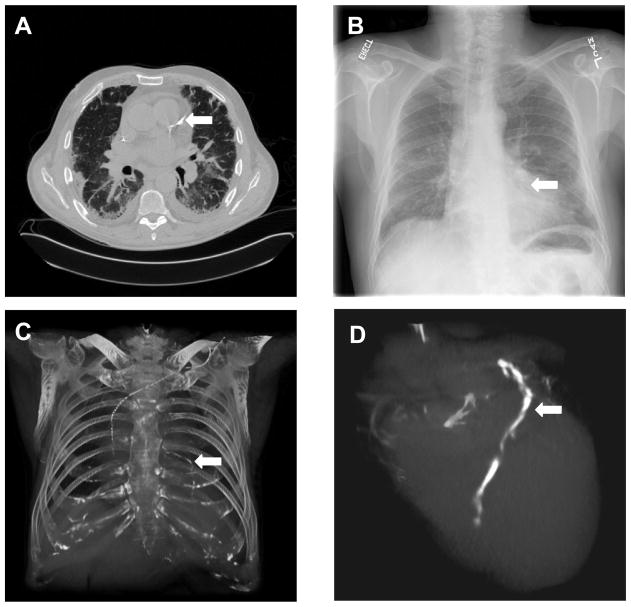
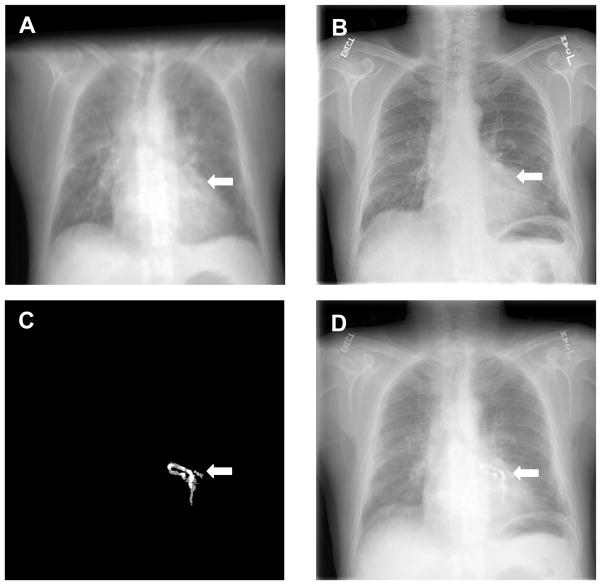
For clinical evaluation, the NMI values increased from 0.20 ± 0.03 to 0.25 ± 0.03 after registration (Figure 2). Color overlay and 3D visualization of the clinical data shows excellent registration. We also developed a program to fuse the registered dual-energy DR image, the CT project image, and the coronary artery calcification project image. As shown in Figure 3 and 4, the DRR projection images from the CT volumes are quite useful to aid the interpretation of the dual-energy X-ray images. For example, Figure 3A shows the calcification on the CT image. The corresponding positions on the DR image (Figure 3B), the CT projection image (Figure 3C) and the volume-rendering image (Figure 3D), respectively. Figure 3C clearly shows the coronary artery calcium. Furthermore, the 3D volume rendering images in Figure 3D verified the location of the calcification. Figure 4 shows the visualization of registered CT projection and dual-energy images.
Figure 2.

Normalized mutual information (NMI) values before and after registration. For 12 patient data sets, NMI values increased from 0.20 ± 0.03 to 0.25 ± 0.03 after registration.
Figure 3.
Computed tomography (CT) and dual-energy digital radiography. A: CT image that shows the coronary artery calcification (arrow); B: A dual-energy digital radiographic image from the same patient; C: The projection image from the CT volume; D: Volume rendering of the heart that shows the calcification.
Figure 4.
Visualization of registered CT projection image and dual-energy digital radiography (DR) images. A: Registered CT projection image; B: Dual-energy DR image of the same patient; C: CT projection image of the calcified coronary artery; D: fusion of the three images where the susceptive calcification in the DR image B was verified by the registered CT projection images A and C.
5. CONCLUSIONS
We have developed an automatic intensity-based 3D-to-2D registration method for 3D CT image volumes and 2D dual-energy digital radiographic images. Experimental results demonstrate that the registration and fusion method may provide a useful tool to evaluate the dual-energy DR images for the detection of coronary artery calcification.
Acknowledgments
The algorithm developed in this research was partially supported by the NIH grant R21CA120536 and the Case Comprehensive Cancer Center Pilot Award to Baowei Fei. Xiang Chen thanks the Scholarship from the China Scholarship Council. The authors thank Elena DuPont for the CT and DR image collections.
Contributor Information
Xiang Chen, Case Western Reserve University and Xi’an Jiaotong University.
Robert Gilkeson, University Hospitals Case Medical Center.
Baowei Fei, Case Western Reserve University.
References
- 1.Thompson BH, Stanford W. Imaging of coronary calcification by computed tomography. J Magn Reson Imaging. 2004 Jun;19:720–733. doi: 10.1002/jmri.20066. [DOI] [PubMed] [Google Scholar]
- 2.Wexler Lewis, Brundage Bruce, Crouse John, Detrano Robert, Fuster Valentin, Maddahi Jamshid, Rumberger John, Stanford William, White Richard, Kathryn Coronary artery calcification: pathophysiology, epidemiology, imaging methods, and clinical implications. A statement for health professionals from the American Heart Association. Writing Group. Circulation. 1996 Sep 1;94:1175–1192. doi: 10.1161/01.cir.94.5.1175. [DOI] [PubMed] [Google Scholar]
- 3.Heussel CP, Voigtlaender T, Kauczor H, et al. Detection of coronary artery calcifications predicting coronary heart disease: comparison of fluoroscopy and spiral CT. Eur Radiol. 1998;8:1016–1024. doi: 10.1007/s003300050508. [DOI] [PubMed] [Google Scholar]
- 4.Fei B, Chen X, Wang H, Sabol John M, DuPont Elena, Gilkeson Robert C. Automatic Registration of CT Volumes and Dual-Energy Digital Radiography for Detection of Cardiac and Lung Diseases. Proceedings of the 28th IEEE EMBS Annual International Conference; New York USA. Aug. 2006; 1976–1979. [DOI] [PMC free article] [PubMed] [Google Scholar]
- 5.Thompson BH, Stanford W. Update on using coronary calcium screening by computed tomography to measure risk for coronary heart disease. Int J Cardiovasc Imaging. 2005 Feb;21:39–53. doi: 10.1007/s10554-004-5343-9. [DOI] [PubMed] [Google Scholar]
- 6.Schaefer-Prokop C, Uffmann M, Eisenhuber E, et al. Digital radiography of the chest: detector techniques and performance parameters. J Thorac Imaging. 2003 Jul;18:124–137. doi: 10.1097/00005382-200307000-00002. [DOI] [PubMed] [Google Scholar]
- 7.MacMahon H. Digital chest radiography: practical issues. J Thorac Imaging. 2003;18:138–147. doi: 10.1097/00005382-200307000-00003. [DOI] [PubMed] [Google Scholar]
- 8.Lacroute PG. Fast Volume Rendering Using A Shear-Warp Factorization Of The Viewing Transformation Anonymous Technical Report: CSL-TR- 95–678. Stanford University – Computer Systems Laboratory of Departments of Electrical Engineering and Computer Science; Stanford, CA: 1995. [Google Scholar]
- 9.Pluim JP, Maintz JB, Viergever MA. Mutual-informationbased registration of medical images: a survey. IEEE Trans Med Imaging. 2003 Aug;22:986–1004. doi: 10.1109/TMI.2003.815867. [DOI] [PubMed] [Google Scholar]
- 10.Fei B, Duerk JL, Boll DT, Lewin JS, Wilson DL. Slice-tovolume registration and its potential application to interventional MRI-guided radio-frequency thermal ablation of prostate cancer. IEEE Trans Med Imaging. 2003 Apr;22:515–525. doi: 10.1109/TMI.2003.809078. [DOI] [PubMed] [Google Scholar]
- 11.Fei B, Wheaton A, Lee Z, Duerk JL, Wilson DL. Automatic MR volume registration and its evaluation for the pelvis and prostate. Phys Med Biol. 2002 Mar 7;47:823–838. doi: 10.1088/0031-9155/47/5/309. [DOI] [PubMed] [Google Scholar]
- 12.Fei B, Duerk JL, Wilson DL. Automatic 3D registration for interventional MRI-guided treatment of prostate cancer. Comput Aided Surg. 2002;7:257–267. doi: 10.1002/igs.10052. [DOI] [PubMed] [Google Scholar]
- 13.Maes F, Collignon A, Vandermeulen D, Marchal G, Suetens P. Multimodality image registration by maximization of mutual information. IEEE Trans Med Imaging. 1997 Apr;16:187–198. doi: 10.1109/42.563664. [DOI] [PubMed] [Google Scholar]
- 14.Nelder J, Mead RA. A simplex method for function minimization. Computer Journal. 1965;7:308–313. [Google Scholar]


