Abstract
Single-molecule spectroscopy is a powerful approach to measuring molecular properties such as size, brightness, conformation, and binding constants. Due to the low concentrations in the single-molecule regime, measurements with good statistical accuracy require long acquisition times. Previously we showed a factor of 8 improvement in acquisition speed using a custom-CMOS 8x1 SPAD array. Here we present preliminary results with a 64X improvement in throughput obtained using a liquid crystal on silicon spatial light modulator (LCOS-SLM) and a novel standard CMOS 1024 pixel SPAD array, opening the way to truly high-throughput single-molecule spectroscopy.
Keywords: single-molecule, photon counting, fluorescence, FCS, LCOS, CMOS, SPAD array, high-throughput
1. INTRODUCTION
Single–Molecule Fluorescence Spectroscopy (SMFS) methods have found application in scientific domains as diverse as super-resolution imaging, structural biochemistry, and single-protein tracking in live cells, yielding insights into outstanding fundamental biological questions [1].
Since they have to operate at the single-molecule level (i.e, low concentrations), they generally require a long acquisition time (several minutes) to have adequate statistical accuracy. Therefore, an increased throughput in SMFS is desirable mainly for two reasons: i) many different reactions can be monitored together at the same time thanks to the multi-spot geometry; ii) fast evolving dynamic systems can be observed by acquiring the same kind of data from different locations and pooling them together to obtain good statistical accuracy before the dynamic system has changed [2].
In order to increase the single molecule throughput, data should be collected in parallel by means of a multi-spot excitation, fast multi-pixel detection, algorithms to handle many channels and suitable software to process all the data.
A novel approach to High-Throughput Fluorescence Correlation Spectroscopy (HT-FCS) has been developed in a confocal geometry, in which multiple microscopic volumes in a solution are simultaneously illuminated with a tightly focused laser beam. Each spot of the excitation pattern is mapped in a pixel of a photon detector array. HT-FCS has been presented previously by us using 8 excitation spots with an 8x1 photon detector array [3–4]. In this article we present a description of the developed methods, and we present data obtained with a 32×32 photo detector array, showing a remarkable improvement in terms of throughput and parallelization. The experimental results show a factor of 64 improvement in FCS throughput, demonstrated with both beads and freely diffusing Cy3B in sucrose.
2. METHODS AND EXPERIMENTAL SETUP
Fluorescence Correlation Spectroscopy is a technique that analyzes the fluctuations in fluorescence intensity recorded from a sample, due to changes in the number of particles entering or leaving the focal volume. FCS is generally performed at nanomolar concentrations, which provides a good compromise between obtaining enough signal during the finite time of the measurement and being able to observe separate bursts of fluorescence light above the noise [5].
In order to estimate the diffusion constant (D) and the concentration (C) of the sample, the intensity time trace and the Auto Correlation Function (ACF) of the luminescence signal are computed. From the ACF of the time trace it is possible to detect the bursts and compute the transit time (d) of the molecule in the excitation volume. The transit time is related to the diffusion coefficient (D) by means of the following formula:
| (1) |
where wk,xy is the beam waist (−1/e to 1/e) perpendicular to the optical axis (xy plane) of the Point Spread Function (PSF) of the excitation volume, s indicates a specific sample and k the single channel (excitation spot and corresponding detector pixel).
In order to compute the sample concentration, the ACF of the measured signal is fitted with the following formula:
| (2) |
is the ACF and is a parameter proportional to the concentration (Cs), that depends on the sample and on the channel:
| (3) |
where Vk is the excitation volume and is a parameter that depends on the ratio between the background intensity and the total intensity of the time trace per each channel.
Since it is difficult to measure the parameters Vk, and , they are estimated using a reference sample with known D0 and C0, fitting and from the experimental data. In fact we have:
| (4) |
| (5) |
In HT-FCS, the ACF curves computed from different pixels can be merged together in order to obtain a good statistic in a short time. However, the parameters extracted from ACFs of different pixels (i.e., different channel k) are usually very spread due to the non-uniformity in the excitation spot size, in the alignment, and in the pixel performance. Therefore, before merging all the data together, a calibration of the ACFs is necessary to rescale the curves More details about this procedure and its validation are reported in [3].
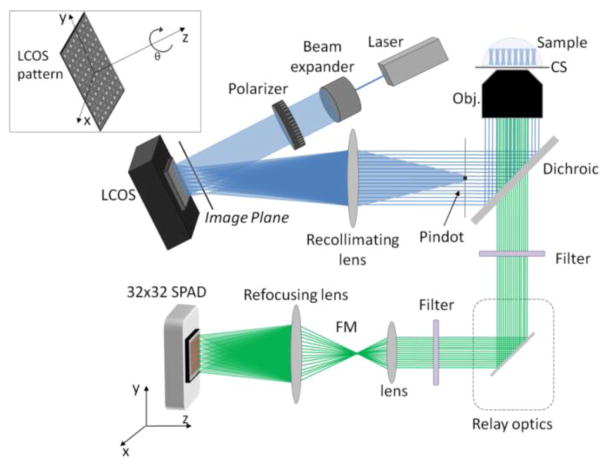
In the present approach, we exploited a Liquid Crystal on Silicon (LCOS) to generate a pattern of excitation spots and a Single Photon Avalanche Diode array (SPADa) to detect the fluorescence light of the emission path. A schematic of the overall setup is illustrated in figure 1. The LCOS pattern is imaged into the objective by means of a recollimating lens and focused on the sample plane by the microscope objective (UPlan Apo, Olympus, Center Valley, PA; 60X, NA = 1.2) generating diffraction limited spots. The pindot just before the objective is a spot of metal, which blocks all the unmodulated light. The pattern re-emitted by the sample is magnified in order to ensure a perfect alignment with the detector.
Figure 1.
Schematic of the experimental setup using an LCOS-SLM. Blue lines represent the excitation light path. Green lines represent the emission light path towards the detector (SPAD array). A first array of spots is generated in an intermediate image plane in front of the LCOS. A recollimating lens sends this pattern to the back of an objective lens, which focuses it into the sample. CS: Coverslip, Obj: objective lens, FM: flippable mirror. Top left inset: The LCOS pattern degrees of freedom are controllable by software. The pattern pitch and number of spots can also be adjusted.
2.1 Liquid Crystal on Silicon (LCOS)
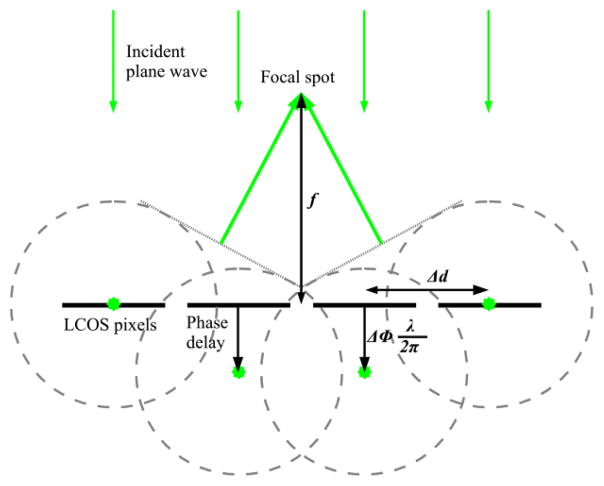
The LCOS (X10468-01, Hamamatsu, Bridgewater; NJ) is a phase modulator that relay on a pixel-by-pixel basis [6]. It is commonly used in a special-frequency domain and requires a iterative and time-consuming computation. Our approach uses the LCOS in the real-space domain to generate a real-space array of spots at an intermediate focal plane in front of the LCOS, as shown in Figure 2. According to the Huygens-Fresnel principle light rays propagate outward in all directions, thus with a proper phase shift pattern it is possible to build a fixed pattern exploiting the constructive and destructive interference [7]. The application of this mathematical method in a microscopy setup has been demonstrated for the first time in [3].
Figure 2.
Schematic of the Huygens-Fresnel principle: rays interfere constructively at a focal point when they have the same total phase delay.
This method can be replicated in order to create a multi-spot excitation pattern with adjustable spot number, size, distance and angle. It makes the alignment procedure of the excitation spots with the array pixels easier, since it is possible to rotate the optical pattern and move single spots without touching the physical setup. In order to manage the LCOS pattern generation, custom C and LabVIEW software has been developed.
2.1 Single-Photon Avalanche Diode array
What is required in parallel HT-FCS is an array of detection channels providing high sensitivity together with high frame rate. For both requirements Single Photon Avalanche Diodes (SPADs) are ideal candidates to reach high performances in compact microelectronics chips. The convenience of fluorescence microscopy with SPAD arrays has been already demonstrated [3,8,9].
A SPAD is essentially a p-n junction biased above breakdown for exploiting an operation mode also called Geiger-mode, because of the analogy with gas counters of ionizing radiation. One digital pulse is produced for every detected photon. A nearby circuit provides the avalanche quenching and recharge mechanisms. In fact, upon photon detection, an avalanche carrier multiplication process is triggered within the SPAD and the quenching circuitry stops the avalanche current by lowering the reverse voltage below breakdown. This prevents the destruction of the device, while the recharge circuitry resets the SPAD for the next detection cycle by raising the bias voltage again to the operating level. SPADs show single photon sensitivity and no readout noise, since they provide a digital pulse signal only when a photon is detected or when a carrier is thermally generated, thus leading to a so called dark-count [10].
Silicon SPADs can be integrated with the front-end circuitry in CMOS technology and single-chip monolithic arrays of “smart pixels” have already been manufactured [11,12].
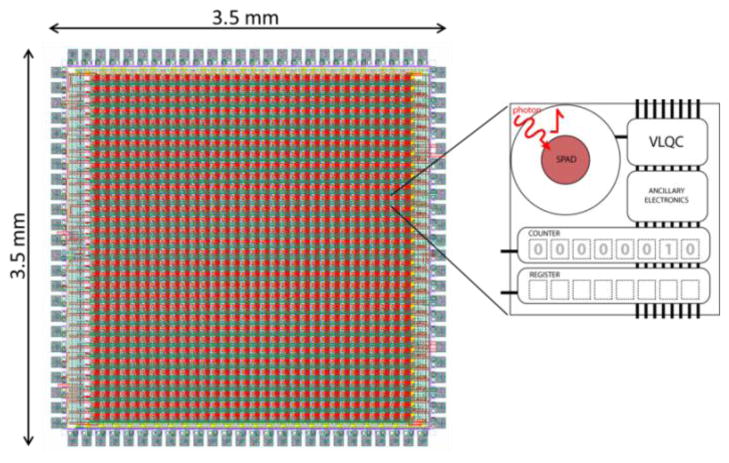
The measurements reported in this paper have been obtained by means of a 32 × 32 SPAD array developed in the SPADlabs at Politecnico di Milano, in a standard high-voltage 0.35μm CMOS technology. The array operates in photon-counting mode, i.e. pulses arriving within a set integration time are summed up and the digital output is therefore the number of photons counted during consecutive time frames. Every pixel comprises a 20 μm-diameter SPAD, a Variable-Load Quenching Circuit [13], an 8 bit counter and a latch memory. The pitch between pixels is 100μm and the overall chip dimensions are 3.5×3.5 mm. Figure 3 shows the layout of the entire array and a scheme of a single pixel. Thanks to the compact active area of the entire chip, this array is particularly ideal for confocal microscopy and spectroscopy, since it avoids the need to separately align a pinhole array. The small active area relative to the spot spacing intrinsically provides this clipping of out-of-focus light.
Figure 3.
32 × 32 pixel Single Photon Avalanche Diodes array. The inset shows a schematic of the pixel comprehensive of a 20 μm-diameter SPAD, a Variable-Load Quenching Circuit [8], an 8 bit counter and a latch memory.
Measured Photo Detection Efficiency (PDE) tops 43% at 5V excess-bias, while Dark-Count Rate (DCR) at room temperature is less than 5kcps (counts per second) for 70% of the pixels and afterpulsing probability is about 3%, with 300ns dead time (time after each detection during which the detector is gated-off). All pixels operate in parallel in a global shutter mode and readout is performed with no blind-time between consecutive frames. In fact at each frame photon counts are stored into the latches (one for each pixel) while photon counters are reset and readout can be performed during the integration time of the following frame. The maximum frame-rate can be set by the user, depending on the system clock of the readout board: with a convenient 100MHz system clock we achieved a free-running speed of 100,000 frames/s from the whole 1024 pixels [14]. Even higher frame rates can be easily achieved by addressing and reading out smaller sub-pixel sets of the array chip, with an absolute maximum of 100,000,000 frame/s from a single pixel, i.e. a photon counting time-tagging resolution of 10ns. In this paper we report measurements on an 8x8 portion of the 32x32 detector.
This array detector fulfills the main requirements of HT-FCS: large number of pixels, high sensitivity (down to the single-photon level), very high acquisition speed (i.e. either high frame-rates or very short integration time-slots) and small active area [2].
2.1 Data transmission and postprocessing
In order to readout the array chip, we developed a compact detection module employing an Opal Kelly XEM3010 compact board featuring a Xilinx Spartan-3 FPGA, 32 MB 16-bit wide SDRAM and an on-board PLL. The USB 2.0 interface provides fast communication from FPGA to the remote PC [15]. We developed also a user friendly interface with LabView, in order to configure the array settings and download the photon counts from the FPGA, and also another tool for multi-channel data analysis and plotting. Figure 4 shows a screenshot of the two tools.
Figure 4.
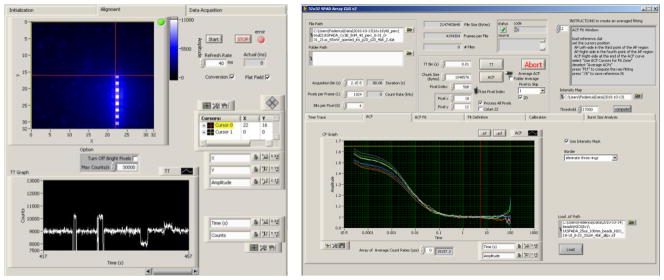
Screenshot of the two custom tools developed with LabVIEW: on the left the SPAD array configuration and setup alignment program; on the right the multi-channel data analysis program.
The parameters used to configure the array chip are the integration time (duration of each frame), the dead time (time after each detection, during which the detector is gated-off in order to reduce afterpulsing probability), the address of the sub-array region-of-interest so that data readout can obtain only the desired pixels, the number of bits-per-pixel for accumulating counts (in fact in many application with low photon rate, such as FCS, it is preferable not to read all 8 bits, in order to achieve higher frame rate) and the duration of the overall measurement. Photon count data is downloaded from the FPGA to the PC at a maximum transfer rate of 22 MByte/s (USB 2) and stored for post-processing. It is also possible to plot in real-time the counts of each pixel by means of intensity maps, to see frames acquired by the overall array or with time traces, and to focus on and compare the photon-counting time dependence of individual pixels. During image display the average DCR can be automatically subtracted for each pixel, which is convenient for visually emphasizing the desired signal during alignment. In order to verify the correct data transmission, crosschecks are performed and both actual and expected durations of each measurement are compared in order to verify the completeness of the information retrieved by and from the FPGA.
The second LabView program, created for post-processing of the acquired data, makes it possible to represent the photon counts in time-dependent waveform traces with adjustable time binning, and to compute the autocorrelation function (ACF) [16,17]. It also enables entering diffusion models for fitting of all channels independently or combined in order to extract the parameters of interest ( and ) [3]. Since a calibration process is required in order to compute the diffusion coefficient and the dye concentration, a feature has been developed to fully automate the processing. Pixels with high DCR (higher than about 20 kcps) could have too low of a signal-to-noise ratio to provide meaningful information. Moreover, since in the calibration procedure some average operations among all pixels are made, a very noisy pixel would negatively affect the results of the entire array. Therefore, a dark count measure is performed and the tool avoids computing the ACF and performing the calibration procedure on those pixels that show a DCR higher than an adjustable threshold level.
With these two developed programs HT-FCS data acquisition and analysis is an automated, straight-forward, and user-friendly process.
3. RESULTS
3.1 Validation of the calibration process
To evaluate the capability of our system for performing an appropriate calibration we used 100nm fluorescent beads in H2O. Figure 5 shows ACFs for the beads, where the data are acquired simultaneously from 64 different channels (using an 8x8 sub-array of the SPAD Array). The comparison between row curves and calibrated curves shows that the calibration process correctly adjusts the curves so that every channel is yielding a similar measurement.
Figure 5.
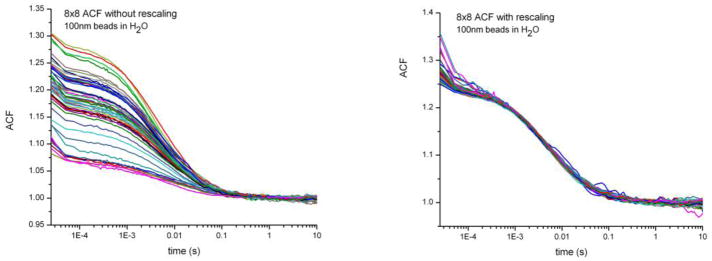
Left: Raw ACF curves of 100nm beads in H2O acquired from 8x8 channel. Right: Calibrated ACF curves, where the channel dependence is removed and all the curves collapse to show the diffusion behavior of the sample.
After this calibration it is possible to merge the curves obtaining an ACF curve 64 time faster than using one single channel. Therefore we increased the throughput by 64 times.
3.2 Single molecule measurements
To evaluate the capability of our system for performing single molecule measurements with single fluorophores, we performed a number of measurements of Cyanine 3B (Cy3B) under various conditions. Figure 6 shows raw and calibrated ACFs for Cy3B 5nM in 200mM NaCl buffer with 40% w/w of sucrose. The data were acquired simultaneously from 64 different channels. Though the correlation amplitude, dampened by the background, is a little lower then with beads, after calibration and fitting the curves still give reliable diffusion times and concentrations.
Figure 6.
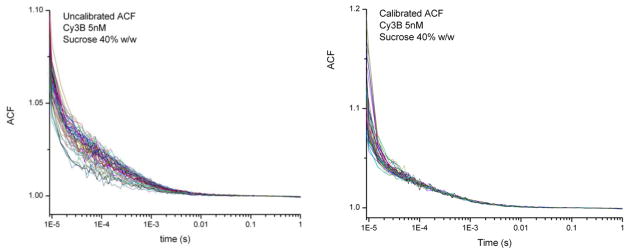
Example ACFs for 5nM Cy3B in 40% sucrose before (left) and after (right) calibration.
Increasing the number of excitation spots also causes an increase in the background due to out-of-focus light. This optical cross-talk interferes with the ability to trivially scale to higher numbers of channels, such as using the full 32x32 array. To solve this problem the geometry of the excitation pattern must be changed, such as by significantly increasing the spot separation in the sample plane in order to avoid cross contributions from other spots. This introduces challenges in identifying the optimal excitation geometry for good signal strength while also fitting all 32x32 spots within the field of view, and will be the subject of future work.
4. DISCUSSION AND CONCLUSIONS
The feasibility of single molecule HT-FCS has been demonstrated with a sub-array (8x8 pixels) of a 32x32 SPAD array, using Cy3B at low concentration. New measurements with larger sub-arrays are in progress.
A highly flexible spot generation approach using an LCOS has been developed. It allows rapid changes to spot position, spacing, and angle, and it is very convenient for the complicated task of multi-pixel alignment. A 32x32 photon-counting SPAD array has been employed for the first time in HT-FCS, which has led to a 64X increase in single-molecule spectroscopy throughput. New user-friendly LabVIEW programs have been developed for automated acquisition and analysis of the substantial quantity of data generated with multi-channel FCS. Future developments will focus on improving the illumination contrast of the excitation geometry when scaling to larger numbers of pixels so that HT-FCS and other high-throughput single-molecule spectroscopy techniques can make use of the full 32x32 SPAD array
Acknowledgments
This work was supported in part by NIH grants R01 GM084327 and R01 EB006353, and by NSF grant DBI-0552099. We thank Dr. Ted Laurence and Dr. Michael Culbertson for providing C code to implement multitau algorithms for time stamped and binned data, respectively.
References
- 1.Thompson NL. Fluorescence Correlation Spectroscopy. In: Lakowicz JR, editor. Topics in Fluorescence Spectroscopy. Vol. 1. Plenum Press; New York: 1991. [Google Scholar]
- 2.Michalet X, Colyer RA, Scalia G, Kim T, Levi M, Aharoni D, Cheng A, Guerrieri F, Arisaka G, Millauda J, Rech I, Resnati D, Marangoni S, Gulinatti A, Ghioni M, Tisa S, Zappa F, Cova S, Weiss S. High-throughput single-molecule fluorescence spectroscopy using parallel detection. Proceeding SPIE. 2010;7608 doi: 10.1117/12.846784. [DOI] [PMC free article] [PubMed] [Google Scholar]
- 3.Colyer RA, Scalia G, Rech I, Gulinatti A, Ghioni M, Cova S, Weiss S, Michalet X. High-throughput FCS using an LCOS spatial light modulator and an 8x1 SPAD array. Biomedical Optics Express. 2010;1(5):1408–31. doi: 10.1364/BOE.1.001408. [DOI] [PMC free article] [PubMed] [Google Scholar]
- 4.Colyer RA, Scalia G, Kim T, Rech I, Resnati D, Marangoni S, Ghioni M, Cova S, Weiss S, Michalet X. High-throughput multispot single-molecule spectroscopy. Proceedings of SPIE. 2010;7571:75710G. doi: 10.1117/12.841398. [DOI] [PMC free article] [PubMed] [Google Scholar]
- 5.Rech I, DR, Marangoni S, Ghioni M, Cova S. Compact-eight channel photon counting module with monolithic array detector. Proc of SPIE. 2007;6771(13):1–9. [Google Scholar]
- 6.Dai HT, Liu YJ, Wang X, Liu J. Characteristics of LCoS Phase-only spatial light modulator and its applications. Optics Communications. 2004;238:269–276. [Google Scholar]
- 7.Wang XW, Dai H, Xu K. Tunable reflective lens array based on liquid crystal on silicon. Optics Express. 2005;13(2):352–357. doi: 10.1364/opex.13.000352. [DOI] [PubMed] [Google Scholar]
- 8.Marangoni S, Rech I, Ghioni M, MacCagnani P, Chiari M, Cretich M, et al. A 6 × 8 photon-counting array detector system for fast and sensitive analysis of protein microarrays. Sensors and Actuators, B: Chemical. 2010;149(2):420–426. [Google Scholar]
- 9.Dupont EP, Labonne E, Vandevyver C, Lehmann U, Charbon E, Gijs MA. Monolithic Silicon Chip for Immunofluorescence Detection on Single Magnetic Beads. Anal Chem. 2010;82(1):49–52. doi: 10.1021/ac902241j. [DOI] [PubMed] [Google Scholar]
- 10.Zappa F, Tisa S, Tosi A, Cova S. Principles and features of Single Photon Avalanche Diode Arrays. Sensors & Actuactors A: Physical. 2007;140(Issue 1):103–112. [Google Scholar]
- 11.Zappa F, Tosi A, Dalla Mora A, Guerrieri F, Tisa S. Single-photon avalanche diode arrays and CMOS microelectronics for counting, timing, and imaging quantum events. Proc of SPIE. 2010;7608 [Google Scholar]
- 12.Charbon E. Single-photon Imaging in CMOS. Proc of SPIE. 2010;7780 [Google Scholar]
- 13.Tisa S, Guerrieri F, Zappa F. Variable-Load Quenching Circuit for Single-Photon Avalanche Diodes. Optic Express. 2008 Jan;16(Issue 3):2232–2244. doi: 10.1364/oe.16.002232. [DOI] [PubMed] [Google Scholar]
- 14.Guerrieri F, Tisa S, Tosi A, Zappa F. Two-Dimensional SPAD-Imaging Camera for Photon Counting. IEEE Photonic Journal. 2010 Oct; [Google Scholar]
- 15.www.opalkelly.com/products/xem3010 (User Manual)
- 16.Laurence TA, Huser SFT. Fast, flexible algorithm for calculating photon correlations. Optics Letters. 2006;31(6):829–831. doi: 10.1364/ol.31.000829. [DOI] [PubMed] [Google Scholar]
- 17.Culbertson MJ, DLB A distributed algorithm for multi-tau autocorrelation. Review of Scientific Instruments. 2007;78(4):044102-1-6. doi: 10.1063/1.2721116. [DOI] [PubMed] [Google Scholar]


