Abstract
With the rapid development of microscopy for cell imaging, there is a strong and growing demand for image analysis software to quantitatively study cell morphology. Automatic cell segmentation is an important step in image analysis. Despite substantial progress, there is still a need to improve the accuracy, efficiency, and adaptability to different cell morphologies. In this paper, we propose a fully automatic method for segmenting cells in fluorescence images of confluent cell monolayers. This method addresses several challenges through a combination of ideas. 1) It realizes a fully automatic segmentation process by first detecting the cell nuclei as initial seeds and then using a multi-object geometric deformable model (MGDM) for final segmentation. 2) To deal with different defects in the fluorescence images, the cell junctions are enhanced by applying an order-statistic filter and principal curvature based image operator. 3) The final segmentation using MGDM promotes robust and accurate segmentation results, and guarantees no overlaps and gaps between neighboring cells. The automatic segmentation results are compared with manually delineated cells, and the average Dice coefficient over all distinguishable cells is 0.88.
Keywords: Cell segmentation, immunofluorescence microscopy, cell nuclei, cell junction network, multi-object geometric deformable model (MGDM)
1. INTRODUCTION
With the rapid development of immunofluorescence microscopy for cell imaging, there is a strong and growing demand for image analysis software to quantitatively study cell morphology. Automatic cell segmentation, separating the individual cells from the background, is the initial step prior to any other automatic image analysis procedures. The segmentation result determines the quality of all subsequent analysis.
Various segmentation methods have been proposed for different types of cell images. The watershed algorithm and its many variants1,2 have gained great popularity for their simplicity and efficiency in separating clusters of cells. Other more advanced algorithms, such as active contours3 and level sets4 offer more powerful tools for cell segmentation, as they offer a high degree of accuracy, robustness to noise and weak boundaries, and have the ability to incorporate all image features and prior information about the cell shape. Other promising approaches include the graph-cut methods5 and dynamic programming6.
In an ideal fluorescence image of a confluent monolayer, the cells cover the plane with no overlaps or gaps and the cell junctions are stained so they appear in a specific color in the image. One challenge is that the images often appear noisy due to various defects. Baggett7 and Mucllough6 used dynamic programming with user interactions to achieve accurate results on this kind of cell image. Frolkovic8 presented an automatic approach by first detecting the centers of nuclei as starting points and then using level set methods to segment individual cells. Since cells were segmented separately in this approach, it cannot guarantee that there’s no overlaps or gaps between multiple cells.
In this work, we propose a fully automatic whole cell segmentation method for the fluorescence images of confluent cell monolayers. First, cell nuclei are automatically detected as initial seeds for subsequent segmentation. To deal with different defects, the cell junctions are enhanced by applying an order-statistic filter and a principal curvature-based image operator. The multi-object geometric deformable model (MGDM)9 is used for the final segmentation, which promotes robust and accurate segmentation of the whole cells, and guarantees no overlaps and gaps between multiple cells.
The rest of the paper is organized as follows. Section 2 describes the proposed segmentation method, which includes three main steps: cell nucleus detection, cell junction enhancement, and final segmentation using MGDM. Section 3 shows qualitative and quantitative evaluation of the segmentation results. Section 4 gives the conclusion and a discussion of future work.
2. METHOD
The cells studied in this work are the human umbilical vein endothelial cells (HUVECs). The cells are immunostained for DAPI and VE-cadherin, so that the cell nuclei appear blue and cell junctions appear green in the fluorescence images. Fig. 1 shows an example of the fluorescence images and the individual green and blue channels. The following sections describe the three main steps of our method: 1) Cell nucleus detection, which provides an initial segmentation; 2) Cell junction enhancement; 3) Final segmentation using MGDM.
Figure 1.
Fluorescence images of HUVECs. (a) Merged DAPI (blue) and VE-cadherin (green) channel. (b) Cell nuclei. (c) Cell junction network.
2.1 Cell Nucleus Detection
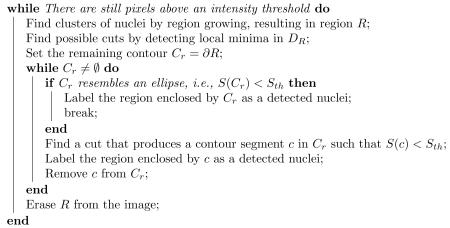
In order to localize each cell in the image, the cell nuclei (see Fig. 1) are automatically detected and used as initial seeds for subsequent segmentation. The main challenge for cell nucleus detection is overlap due to clustering or multiple nuclei. The popular watershed methods often involve careful seed finding before (or region merging after) the watershed operation to prevent over-segmentation. To avoid this, we present a different approach by analyzing the contour of the nuclei cluster and separating the touching nuclei using the shape characteristic of nuclei. First, a connected region R representing a nucleus or a cluster of nuclei is detected by region growing. ∂R, the boundary of R, is represented by an ordered set of points {pi}, i ∈ I = {1, 2, … , NR}. Candidate cuts between touching nuclei are generated by detecting local minima in the contour distance map. The contour distance map DR of a region R is a NR × NR matrix expressing the pair-wise distances between points in {pi}, e.g. DR(i, j) is the distance between pi and pj. As shown in Fig. 2, the true cut between two touching cells is one of the local minimas in DR. Then the true cuts are identified by checking the similarity of the segmented contours to an ellipse shape. For a segmented contour c, represented by a set of points {pik}, ik ∈ Ic ⊂ I, an ellipse Ec is fitted to the point set {pik}. The similarity of c to an ellipse is quantified by the mean distance from {pik} to Ec:
where dist(p,Ec) is the shortest distance from a point p to the ellipse Ec.
Figure 2.
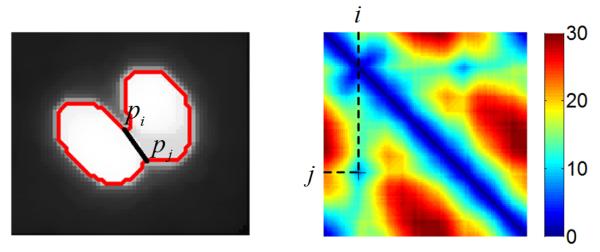
The cut between two touching cells and the corresponding local minima in the contour distance map DR(i, j).
The automatic cell nucleus detection algorithm can be summarized as follows:
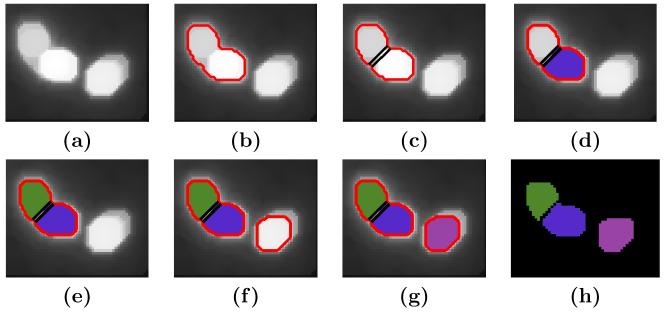
Fig. 3 shows the cell nuclei sequentially detected by running the above procedures. Fig. 3(g) is an image with zero in the background and the region of each cell nucleus labeled with a different color. This labeled image is used as the initialization for the final segmentation using the geometric deformable model in Sec 2.3.
Figure 3.
Cell nucleus detection and initial segmentation. (a) Image of cell nuclei. (b) First contour generated by region growing. (c) Possible cut. (d) First nucleus labeled. (e) Second nucleus labeled. (f) Second contour by region growing. (g) Third nucleus labeled. (h) The labeled image as an initial segmentation.
2.2 Cell Junction Enhancement
The image of the cell junction network is the main input for final segmentation. The quality of the cell junction network directly affects the segmentation results. Ideally, we expect the cell junctions to have a dark background and a bright curvilinear structure. However, real images have various kinds of defects. As shown in Fig. 4, there are bright spots scattered throughout the image and smooth intensity peaks around the cell nuclei. Cell junctions have an irregular appearance and are very weak or even indistinguishable in some areas. In our method, we suppress the defects and enhance the curvilinear structure by first applying an order-statistic filter and then computing the principal curvature of the image intensity surface.
Figure 4.
Cell junction enhancement. (a) Original image of cell junction network. (b) After order-statistic filtering; (c) After applying image operator C.
1) Order-statistic filtering
Order-statistic filtering replaces each pixel p in an image by the k-th largest intensity value in a certain neighborhood of p. Here we use a 3 × 3 neighborhood and choose k = [0.2n], where n is the number of pixels in the neighborhood. The bright spots are eliminated since they often have high intensities but small areas. On the other hand, the curvilinear structure is not affected much since the high intensity area can cover substantial area in the neighborhood of p. Fig. 4(b) shows a typical image of cell junction network after order-statistic filtering.
2) Curvilinear structure enhancement
Second derivatives of image intensity are often used for the detection and enhancement of curvilinear structures10,11. The differential structure of the intensity surface at a point p = (x, y) is captured by the Hessian matrix,
| (1) |
where r..(x, y) are second order derivatives of a smooth version of the original image.
The two eigenvectors indicate the directions along which the local surface has the greatest and least curvature, and the corresponding eigenvalues, κ1(x, y) and κ2(x, y) (κ1(x, y) ≥ κ2(x, y)), are the respective curvature values, called the principal curvatures. For a point on the cell junction, the largest principal curvature κ1(x, y) should be negative with large absolute value. As a result, κ1(x, y) can be used to identify the curvilinear structure in the image and suppress other structures such as low frequency intensity variations. We define an image operator C o I(x, y) = max(−κ1(x, y), 0), which will have a big value for a convex curvilinear structure. Fig. 4(c) shows the image of cell junctions after applying the operator C. The smooth intensity peaks at the cell nuclei are effectively suppressed, and the cell junction becomes a nice curvilinear structure and weak cell junctions are enhanced.
2.3 Final segmentation by MGDM
Geometric deformable models using the level set representations4 have gained great popularity in segmentation problems. Most of these methods have been proposed for single objects, however, which makes them unsuitable for the multiple cell segmentation task here. Various extensions of level set techniques to multiple objects have been proposed9,12,13. The Multi-object Geometric Deformable Model (MGDM)9 is ideally suited for our problem because it is computationally efficient even with large numbers of objects and can apply different forces (called speeds in the level set segmentation literature) to different boundaries between objects. In our model, MGDM has N + 1 objects, with N cell objects and one background object. In the final segmentation, we would like: 1) the boundary of cell objects to coincide with the cell junction in the image; 2) no overlaps and gaps between neighboring cells ; 3) the boundary to be smooth and robust to noise in the image. In the following, we describe the external and internal forces used in MGDM to achieve these goals.
External force
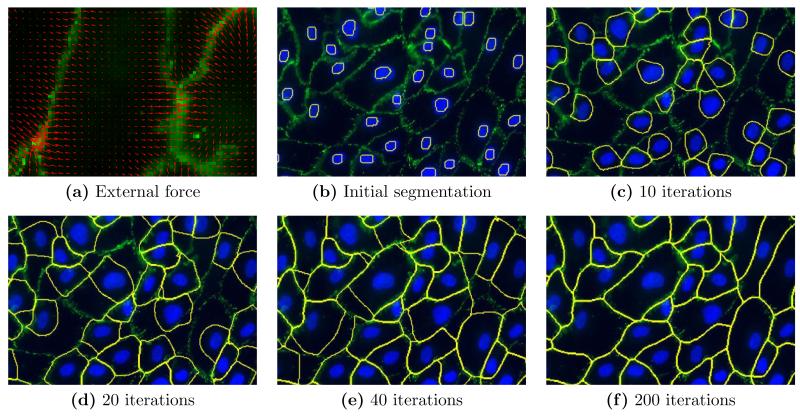
Gradient vector flow (GVF)14 has been widely adopted in the active contour and level set methods to drive an object boundary to desired edges. It is computed as a diffusion of the gradient vectors of the edge map derived from the image. GVF has the advantages of large capture range compared to traditional gradient field, and can force object contours into boundary concavities. In our method, we use a weighted sum of GVF and the gradient field as the external forces. As shown in Fig. 5, the external force is a smoothly changing vector field pointing to the cell junction, with small magnitude in the middle of the cell and large magnitude near the cell junction.
Figure 5.
(a) The external force field and (b)–(f) the MGDM evolution.
Internal force
The internal force includes a balloon force15 and a curvature smoothing force16. In our method, we assume that each cell contains only one nucleus, and the nucleus is completely contained within the cell border. The outward balloon force, in the form , makes each cell object expand from the initial nucleus region. It should be noted that, the balloon force is only applied to the cell objects (not to the background object). Therefore, the cell boundary will expand over the background, but once it touches the boundary of a neighboring cell, the touching boundary stops the expansion because the balloon forces from the two cell objects offset, and the boundary is then driven by other forces (external force and curvature force). The curvature smoothing force preserves the smoothness of the boundary and is applied to all objects.
Considering both internal and external forces, the total force applied to the level set ϕi can be written as,
| (2) |
Figs. 5 (b)–(f) show the evolution of the segmented regions. For the initial iterations, the cell objects expand under the balloon forces. As the cell boundary gets close to the cell junction in the image, the GVF field dominates and drives the boundary to the cell junctions. Since there is no balloon force applied to the background object, it shrinks so that at convergence, there are no gaps between neighboring cells.
3. EXPERIMENT
The automatic segmentation algorithm is tested on six representative images, containing over 1300 cells in total. The “ground truth” segmentation was obtained by manual delineation of the boundaries of individual cells. Only the cells with no ambiguity and a distinguishable boundary are delineated and evaluated. We also exclude those cells having multiple nuclei, since our algorithm assumes that each cell has only one nucleus. In all, about 900 cells are manually delineated. As shown in Fig. 6, the automatically segmented boundary coincides with the manually delineated boundary in most places. The manual delineation may have gaps between neighboring cells, while the automatic segmentation does not have this problem. In order to quantitatively evaluate the segmentation result, for each manually delineated cell, we first identify the corresponding automatically segmented region, and then compute the Dice coefficient between the automatic segmented region and the manually delineated region. Let , i = 1, 2, … , M be the region of a manually delineated cell. Let , j = 1, 2, … , L be the region of a detected nuclei in the automatic segmentation and the corresponding whole cell region growing from . For each manually delineated cell , we assign
as the automatically segmented cell region, and the Dice coefficient between Ui and Wki is computed as
where | · | indicates the area of a region.
Figure 6.
Comparison between automatically segmented and manually delineated cell boundaries in one image.
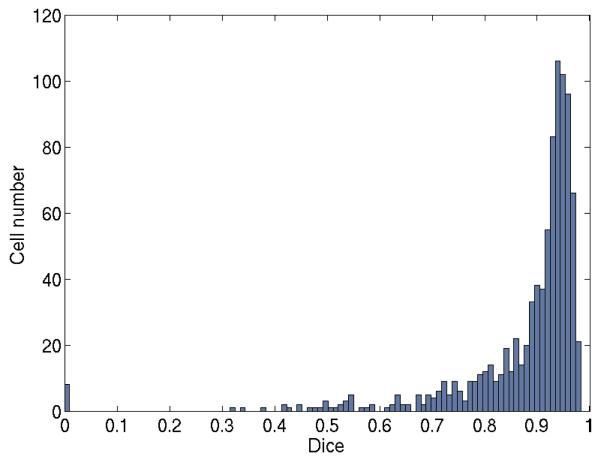
Fig. 7 shows the histogram of the Dice coefficients computed from the M delineated cells. We can see that there is a peak in the Dice distribution around 0.95 and 81% of the cells had Dice over 0.80. The average Dice is 0.88. The errors are mainly due to the irregular appearance of the cell junctions. The resulting boundary at a weak or broken cell junction is somewhat arbitrary. It may stop at where the growing boundaries of the two neighboring cells touched, or may be driven to a strong junction nearby under the GVF force. In a few extreme cases, the whole cell object shrink and disappear, resulting in a Dice of zero. This problem can be alleviated by further improving the cell junction enhancement and incorporating prior knowledge about the region and shape of each cell in MGDM, e.g., the final segmented cell region should always contain the cell nucleus.
Figure 7.
Histogram of the Dice coefficients computed from the delineated cells in all test images.
4. CONCLUSION
We propose a fully automatic whole cell segmentation method for the fluorescence images of confluent cell monolayers, addressing several challenging problems. First the cell nuclei are automatically detected and used as initial seeds for segmentation. The cell junction is enhanced by order-statistic filtering and a principal curvature based image operator. The multi-object geometric deformable model is used for the final segmentation that promotes robust, accurate segmentation, and guarantees no overlaps and gaps between neighboring cells. Experiments show promising results of the automatic algorithm. Future work would involve: 1) incorporating region and shape prior of cells in MGDM to further improve the robustness and accuracy of the algorithm; 2) introduce a belief measure for each segmented cell quantifying to what degree the segmentation can be trusted; 3) making the algorithm adaptable to other types of cells or cell images.
REFERENCES
- [1].Lin G, Adiga U, Olson K, Guzowski J, Barnes C, Roysam B. A hybrid 3D watershed algorithm incorporating gradient cues and object models for automatic segmentation of nuclei in confocal image stacks. Cytometry Part A. 2003;56(1):23–36. doi: 10.1002/cyto.a.10079. [DOI] [PubMed] [Google Scholar]
- [2].Pinidiyaarachchi A, Wählby C. Seeded watersheds for combined segmentation and tracking of cells. Image Analysis and Processing-ICIAP 2005. 2005:336–343. [Google Scholar]
- [3].Kass M, Witkin A, Terzopoulos D. Snakes: Active contour models. International journal of computer vision. 1988;1:321–331. [Google Scholar]
- [4].Sethian J. Level set methods and fast marching methods: evolving interfaces in computational geometry, fluid mechanics, computer vision, and materials science. 3. Cambridge Univ Pr; 1999. [Google Scholar]
- [5].Boykov Y, Funka-Lea G. Graph cuts and efficient ND image segmentation. International Journal of Computer Vision. 2006;70(2):109–131. [Google Scholar]
- [6].McCullough D, Gudla P, Harris B, Collins J, Meaburn K, Nakaya M, Yamaguchi T, Misteli T, Lockett S. Segmentation of whole cells and cell nuclei from 3-D optical microscope images using dynamic programming. Medical Imaging, IEEE Transactions on. 2008;27(5):723–734. doi: 10.1109/TMI.2007.913135. [DOI] [PMC free article] [PubMed] [Google Scholar]
- [7].Baggett D, Nakaya M, McAuliffe M, Yamaguchi T, Lockett S. Whole cell segmentation in solid tissue sections. Cytometry Part A. 2005;67(2):137–143. doi: 10.1002/cyto.a.20162. [DOI] [PubMed] [Google Scholar]
- [8].Frolkovic P, Mikula K, Peyriéras N, Sarti A. Counting number of cells and cell segmentation using advection-diffusion equations. Kybernetika. 2007;43(6):817–829. [Google Scholar]
- [9].Fan X, Bazin P, Prince J. A multi-compartment segmentation framework with homeomorphic level sets; Computer Vision and Pattern Recognition, 2008. CVPR 2008. IEEE Conference on; IEEE. 1-6; 2008. [DOI] [PMC free article] [PubMed] [Google Scholar]
- [10].Steger C. An unbiased detector of curvilinear structures. Pattern Analysis and Machine Intelligence, IEEE Transactions on. 1998;20(2):113–125. [Google Scholar]
- [11].Sato Y, Nakajima S, Atsumi H, Koller T, Gerig G, Yoshida S, Kikinis R. CVRMed-MRCAS’97. Springer; 1997. 3D multi-scale line filter for segmentation and visualization of curvilinear structures in medical images; pp. 213–222. [DOI] [PubMed] [Google Scholar]
- [12].Paragios N, Deriche R. Coupled geodesic active regions for image segmentation: A level set approach. Computer VisionECCV 2000. 2000:224–240. [Google Scholar]
- [13].Vese L, Chan T. A multiphase level set framework for image segmentation using the Mumford and Shah model. International Journal of Computer Vision. 2002;50:271–293. [Google Scholar]
- [14].Xu C, Prince J. Snakes, shapes, and gradient vector flow. Image Processing, IEEE Transactions on. 1998;7:359–369. doi: 10.1109/83.661186. [DOI] [PubMed] [Google Scholar]
- [15].Cohen L. On active contour models and balloons. CVGIP: Image understanding. 1991;53(2):211–218. [Google Scholar]
- [16].Osher S, Sethian J. Fronts propagating with curvature-dependent speed: algorithms based on Hamilton-Jacobi formulations. Journal of computational physics. 1988;79(1):12–49. [Google Scholar]


