Abstract
The tumour suppressor p53 is a crucial regulator of cell cycle arrest and apoptosis by acting as a transcription factor to regulate a variety of genes. At least in part, this control is exerted by p53 via regulating expression of numerous microRNAs. We identified two abundantly expressed microRNAs, miR-16 and miR-26a, whose expression is regulated by p53 during the checkpoint arrest induced by the genotoxic drug, doxorubicin. Importantly, among the targets of these miRs are two critical checkpoint kinases, Chk1 and Wee1. The p53-dependent augmentation of miR-16 and miR-26a expression levels led to the cell cycle arrest of tumour cells in G1/S and increased apoptosis. Strikingly, the bioinformatics analysis of survival times for patients with breast and prostate cancers has revealed that co-expression of mir-16 and miR-26a correlated with a better survival outcome. Collectively, our data provide a novel mechanism whereby p53 represses Chk1 and Wee1 expression, at least partially, via upregulation of miR-16 and miR-26a and thus sensitizes tumour cells to genotoxic therapies.
Keywords: microRNAs, p53, Wee1, Chk1, checkpoint kinases, genotoxic stress
TP53 is a universal tumour suppressor whose major function is to control the stability of genome in response to various forms of genotoxic stress. Acting mostly as a transcription factor, p53 regulates the gene expression programme to prevent damaged cells from propagation. Products of p53-dependent genes induce DNA repair, cell cycle arrest in G1/S and G2/M phases, and apoptosis.1 G1/S arrest is mediated mostly by the p21 protein whose expression is induced by p53.1, 2, 3, 4 The former binds to and inhibits the kinase activity of cdk2/cyclin E and cdk4/cyclin D complexes, which are essential for G1/S transition. The p53-mediated G2 arrest involves, in addition to the p21 protein, other p53 targets such as members of the 14-3-3 family of proteins5, 6 and GADD45.7 The 14-3-3 protein binds to and inhibits the phosphatase activity of Cdc25, whereas GADD45 attenuates the activity of mitotic cdc2 (cdk1) kinase by sequestering its cyclin partner, cyclin B.8 Activity of cdk1 is also regulated by two checkpoint kinases Chek1 and Wee1. On DNA damage, Chk1 and Wee1 phosphorylate and inhibit cdk1, thus preventing entry into mitosis.9, 10, 11 CHK1 also phosphorylates p53 and together with ATM/ATR stabilizes and activates p53, further enhancing the G2-M checkpoint in the cell cycle.12
Recently, it has been demonstrated that microRNAs (miRNAs) are the integral part of the p53 network.13, 14 miRNAs are a group of small (20–25 nucleotides) non-coding RNA molecules, which are expressed endogenously in cells and that regulate gene expression at the post-transcriptional level.15 To date, there is more than a dozen of different families of microRNA genes controlled by p53.16, 17 Importantly, p53 has been shown to regulate both transcription and maturation of miRNA genes, whose products aid in the processes of cell cycle arrest and apoptosis.16
Here, we report an identification of two abundantly expressed microRNAs, miR-16 and miR-26a, whose expression is regulated by p53 during the genotoxic stress. Importantly, among the targets of these miRs are two critical checkpoint kinases, Chk1 and Wee1. The p53-dependent augmentation of miR-16 and miR-26a expression levels led to the cell cycle arrest of tumour cells in G1/S and increased apoptosis. Strikingly, the bioinformatics analysis of survival times for patients with breast and prostate cancers has revealed that co-expression of miR-16 and miR-26a correlated with a better survival outcome. Collectively, our data provide a novel mechanism whereby p53 represses Chk1 and Wee1 expression, at least in part, via upregulation of miR-16 and miR-26a and thus sensitizes tumour cells to genotoxic therapies.
Results
p53 and genotoxic stress control the expression of miR-16 and miR-26a
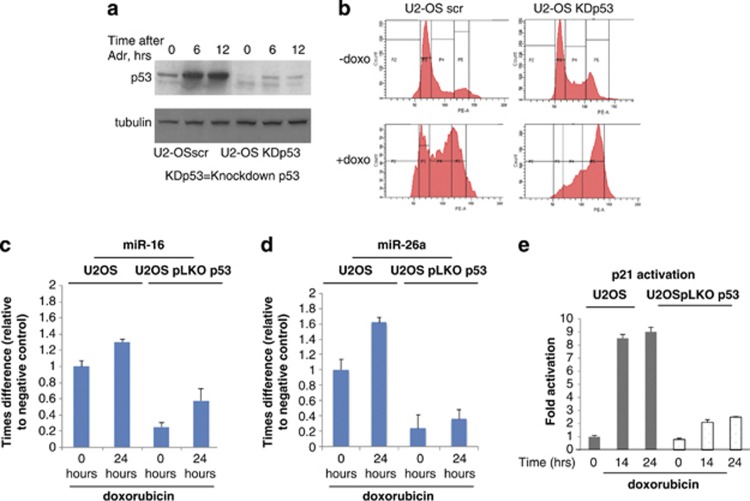
To define the spectrum of microRNA regulated by p53 on genotoxic stress, we employed the microarray expression analysis of microRNAs in a matching pair of cell lines that differ in their p53 expression status. Control U2-OS cells stably expressing non-specific scrambled shRNA (U2-OS scr) showed low levels of p53, as these cells overexpress p53-specific E3 ubiquitin ligase, Mdm2, which targets p53 for the 26S proteasome-dependent degradation.18, 19, 20, 21, 22 A matching cell line (U2-OS KDp53) with suppressed expression of p53 due to the presence of p53-specific shRNA also showed very low level of p53 expression. However, doxorubicin treatment stabilized p53 in U2-OS scr cells (Figure 1, left), whereas in U2-OS KDp53 cells the level of p53 was still low (Figure 1a).
Figure 1.
Expression of miR-16 and miR-26a is induced in the presence of p53 by doxorubicin. (a) Comparison of the p53 levels in U2-OS cells stably expressing scrambled shRNA versus p53-specific shRNA (U2-OS KDp53) on treatment with doxorubicin. U2-OS cells with wild type and knocked-down expression of p53 were continuously treated with 0.5 μM of doxorubicin for 0, 6, and 12 h before harvesting. Cell lysates were then prepared and analysed by western blotting using p53-speicific antibody. Anti-tubulin serum was used as loading control. (b) Cell cycle distribution of U2-OS cells with wild type and knocked-down expression of p53 on doxorubicin treatment. Both cell types were treated with 0.5 μM of doxorubicin for 12 h, fixed with formaldehyde and stained with propidium iodine for subsequent cell cycle analysis. The same cells were treated with doxorubicin for 24 h and total RNA was extracted, converted to cDNA and analysed by real-time PCR for expression levels of miR-16 (c); miR-26a (d), and p21, as a positive control (e)
To further assess the validity of the cell system used in our experiments, both U2-OS scr and U2-OS KDp53 cell lines treated with doxorubicin were analysed for their ability to elicit G1/S checkpoint arrest characteristic of the intact p53 function (Figure 1b). On genotoxic stress, U2-OS scr (p53+) cells exhibited cell cycle arrest in G1/S phase along with the accumulation of cells in G2/M. On the contrary, doxorubicin-treated U2-OS KDp53 cells (p53-) were arrested preferentially in G2/M phase, which is indicative of non-functional p53 (Figure 1b, bottom panels). Importantly, cell cycle profiles of both cell lines were similar in the absence of DNA damage (Figure 1b, upper panels). Thus, collectively, our data confirmed that U2-OS cells, in which p53 was stably knocked down by specific shRNA behaved similarly to authentic p53-null cells.
To uncover specific microRNAs regulated by p53 during cell cycle arrest in response to doxorubicin, a global analysis of microRNA expression patterns in U2-OS scr and KDp53 cells was performed (data not shown). Among several microRNAs that were regulated by p53 (including miR-34a), we focused on two highly expressed microRNAs: miR-26a-1 and miR-16-2. As a validation of our microarray results Q-RT-PCR of miR-16 and miR-26a showed a statistically significant increase of their expression levels (1.4 and 1.6 fold, respectively) on 24 h of doxorubicin treatment versus control cells (Figures 1c and d, respectively). Notably, the level of miR-16 and miR-26a expression in U2-OS KDp53 cells versus the wild-type U2-OS cells was lower even in the absence of DNA damage, suggesting that p53 regulates these genes at basal level. Importantly, DNA damage enhanced miR-16 and miR-26a expression in U2-OS KDp53 cells at a lower rate compared with U2-OS scr cells with wild-type p53 (2.2 and 4 fold for miR-16 and miR-26a, respectively). As a positive control for p53 function, we analysed transcription of the p21 gene, which is a known p53 target in these cells (Figure 1e). Collectively, our data strongly support the results of microarray experiment, which identified miR-26a and miR-16 as p53- and doxorubicin-dependent microRNAs.
p53 controls transcription of miR-16-2 and miR-26a-1 in luciferase assay
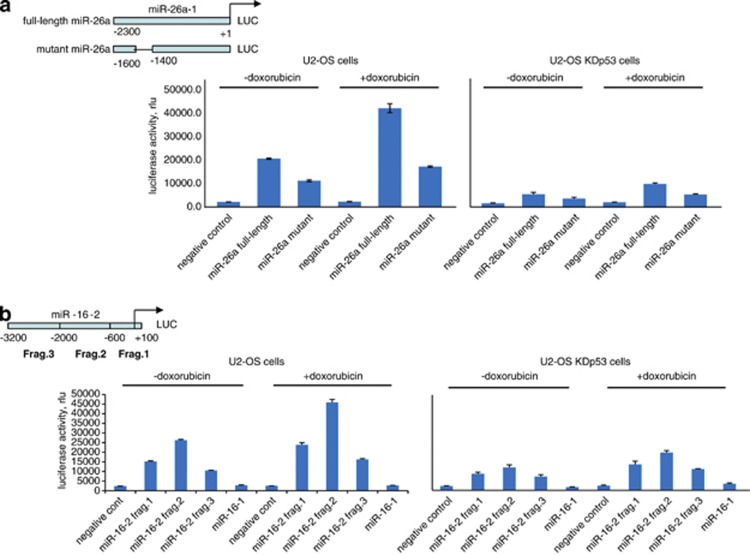
It should be noted that the mature products of miR-16 and 26a each comprise RNAs transcribed from two different genes. Specifically, miR-16 is encoded by the miR-16-1 and miR-16-2 genes located on the chromosomes 4 and 13, respectively. Analogously, miR-26a is the product of expression of two genes, miR-26a-1 and miR-26a-2, located on the chromosome 3 and 14, respectively. Thus, to elucidate which specific genes contribute to the upregulation of miR-16 and miR-26a by p53, we tested promoters of the respective genes in the luciferase reporter assay (Figures 2a and b). We found that miR-16-1 and miR-26a-2 promoters were not dependent on the presence of p53 (Figure 2b and data not shown, respectively). Both in the absence or presence of doxorubicin treatment the luciferase activity of the miR-26a full-length promoter was higher than that of the deletion mutant lacking several putative p53-binding sites (region from −1600 to −1400) (Figure 2a). Importantly, in U2-OS KDp53 cells the transcriptional activity of both miR-26a promoter constructs was significantly attenuated compared with the cells with wild-type p53 even after doxorubicin treatment (Figure 2a, right panel).
Figure 2.
p53 and doxorubicin treatment activate promoters of miR-16-2 and miR-26a genes in luciferase assay. (a) Shown is the scheme of the promoter and its deletion mutant for the miR-26a-1 gene situated in front of the luciferase gene. U2-OS cells stably expressing scrambled shRNA (U2-OS scr) versus p53-specific shRNA (U2-OS KDp53) were treated or not treated with doxorubicin for 14 h before harvesting. Cell extracts were then prepared, normalized for transfection efficiency by measuring beta-galactosidase activity and assayed for luciferase activity. Empty luciferase vector with minimal HSP70 promoter was used as negative control. (b) Shown are three fragments of the miR-16-2 promoter, which were assayed for their ability to drive luciferase activity in response to doxorubicin. Cells were treated and assayed as described above. A fragment of the miR-16-1 promoter driving transcription of the luciferase gene that does not respond to p53 was used as a negative control
Similar results were obtained for the miR-16-2 promoter (Figure 2b). Three fragments encompassing 3200 bp of the upstream sequence were tested individually for their response to doxorubicin and p53. Fragments 1 and 2 of the miR-16-2 promoter exhibited the highest activity in the p53-positive cells both in the absence and in the presence of doxorubicin (Figure 2b, left panel and right panel, respectively). Importantly, ablation of p53 in U2-OS KDp53 cells correlated with a threefold decrease of luciferase activity for both miR-16-2 fragment 1- and 2-containing constructs (Figure 2b, right panel). The miR-16-1 promoter-containing construct (a kind gift of G Calin) displayed the activity only marginally higher than the background level, indicating that this promoter did not depend on the presence of p53. Taken together, these data confirm the results of microarray experiments suggesting that both miR-26a-1 and miR-16-2 are upregulated by p53 in response to doxorubicin.
p53 directly binds to the regulatory regions of miR-16-2 and miR-26a-1 genes
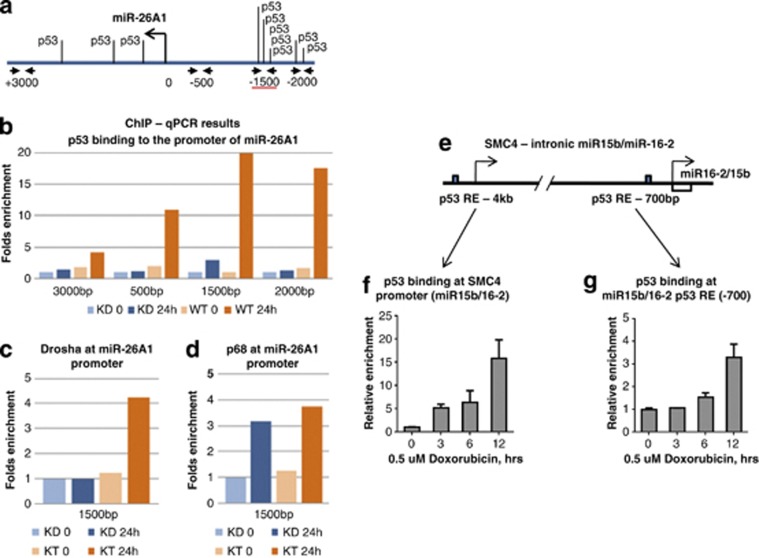
To determine whether p53 was directly bound to the promoters of miR-16-2 and miR-26a-1 genes, we performed ChIP assay using p53-specific antibody (Figure 3).To independently validate the results of luciferase assay, we analysed p53 binding in the region from −2000 to +3000 of the miR-26a-1 gene using a series of primers (Figure 3a). As shown in Figure 3b, maximal p53 binding after DNA damage was detected in the amplicon −1500. Also, p53 binding was detected in the amplicon −2000. Importantly, much lower binding of p53 was observed at the amplicons −500 and +3000, indicating that the maximal p53 binding occurs in the region from −2000 to −1500. p53 binding was significantly lower in U2-OS KDp53 cells, thus confirming the specificity of p53 binding in our assay.
Figure 3.
Analysis of p53 binding to the regulatory regions of miR-16-2 and miR-26a genes by ChIP assay. (a) Shown is the scheme of the miR-26a-1 regulatory region. Putative p53-binding sites are depicted. Positions of nucleotides are given in respect to the transcription start site. (b) A summary of results of ChIP assay for p53 biniding on U2-OS scr (WT) and U2-OS shRNA-p53 (KD) cells. Cells were non-treated or treated for 24 h with doxorubicin and analysed for p53 binding to different amplicons of the sequence of the miR-26a-1 gene. (c) ChIP assay of Drosha and (d) p68 binding to the region −1500, where maximal p53 binding was detected. (e) Shown is the scheme of the SMC4 gene with intronic regulatory region for miR-16-2. (f) ChIP assay of p53 binding in the promoter of SMC4 gene and (G) in the upstream sequence of miR-16-2
As p53 was shown to interact with the Drosha microprocessing complex,23, 24 we hypothesized that p53 can recruit components of the Drosha complex to the target promoters thus enhancing the processing of specific miRs. To test this hypothesis, we performed ChIP assay using antibodies against Drosha and p68, which is an ATPase enzyme often associated with Drosha.24 The maximal binding of Drosha was detected at the replicon −1500 of the miR-26a-1 promoter in the p53-specific manner (Figure 3c). Unexpectedly, the recruitment of p68 did not depend on the presence of p53, but did depend on the treatment with doxorubicin (Figure 3d). Thus, we found that Drosha, but not p68, is recruited by p53 to the promoter of miR-26a-1 on DNA damage.
We also tested the ability of p53 to bind the regulatory regions of miR-16-2 (Figure 3e). Our luciferase reporter experiments identified the region −2000 to +1 as the most responsive to p53. Thus, to analyse p53 binding we used an amplicon −700 bp, which is located between the promoter fragments 1 and 2. It should be noted that miR-16-2 is coded by an intronic gene, located within the SMC4 (structural maintenance of chromosomes) gene (Figure 3e). The promoter region of SMC4 has been shown to contain the binding sites for E2F1 to control miR-16-2/miR-15b expression.25 Since E2F1 binding sites often overlap with the p53 ones, we decided to test whether p53 also binds this region upon DNA damage (−4 kb). As shown in Figures 3f and g, p53 bound to both regions (−4 kb and −700 bp) in the time- and doxorubicin-dependent manner reaching its maximum at 12 h.
p53 regulates the expression of miR-16-2 and miR-26a-1 by different mechanisms
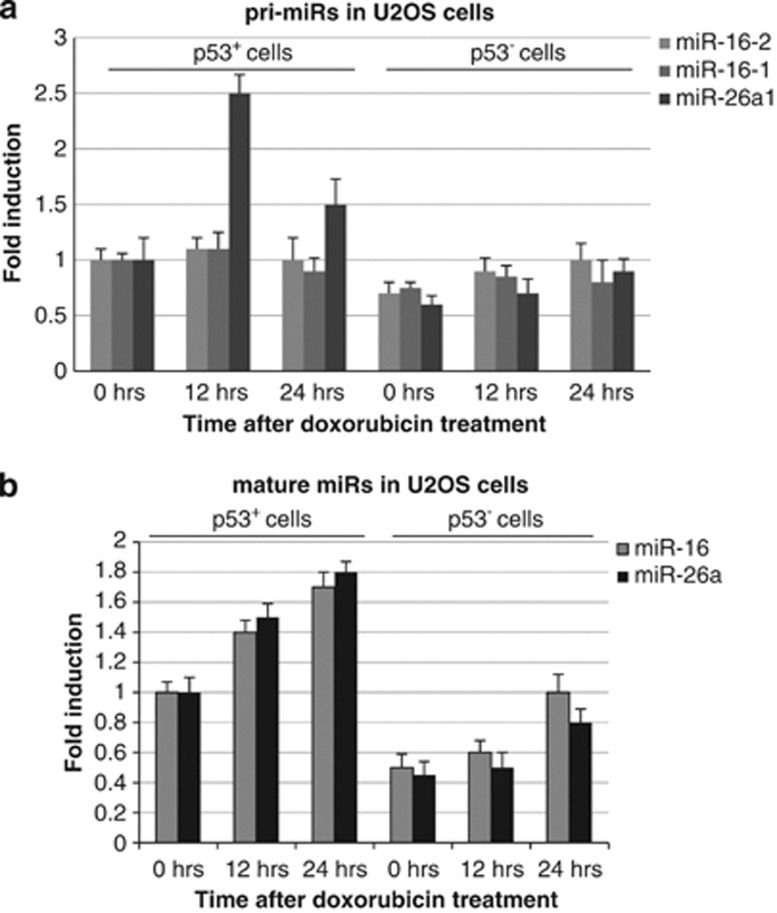
Previously published studies suggested that p53 has role in regulation of microRNA expression both on the transcriptional and post-transcriptional levels.23 Having this in mind, we examined the expression of miR-16 and miR-26a both at the level of transcription (primary miRs) and after their processing (mature miRs) (Figures 4a and b, respectively). Analysis of the primary miRs (pri-miRs) levels suggests that only the miR-26a-1 gene, but not miR-16-1 or miR-16-2, was regulated transcriptionally by p53 in response to doxorubicin (Figure 4a). On the contrary, both mature miR-26a and miR-16 showed their dependency on p53 and doxorubicin (Figure 4b). Collectively, these results suggest that p53 controls the expression of miR-26a and miR-16 differently, that is, miR-26a transcriptionally and miR-16 post-transcriptionally, on the level of its maturation.
Figure 4.
p53 differentially affects expression of primary and mature miR-16-2 and miR-26a. Effect of p53 activation by doxorubicin on the transcription of primary miR-16-1, miR-16-2, and miR-26a-1 gene in p53+ and p53− U2-OS cells was measured by Q-RT-PCR. Levels of pri-miRs expression were normalized to the signal of U6 RNA. (b) Shown are the expression levels of mature (transcription-independent) miR-16 and miR-26a, relative to U6
miR-16 and miR-26a target checkpoint kinases Chek1 and Wee1
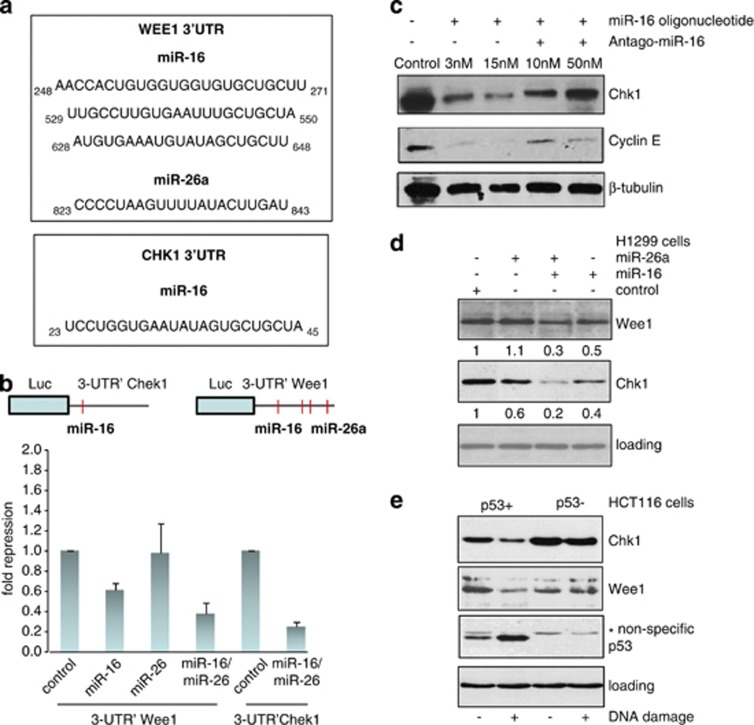
Next, we wished to identify the targets of miR-16 and miR-26a. miR-16 has been reported to target several cell cycle regulators, including cyclin E, Chk1, cyclin D1, and Cdk6.26, 27 To identify the targets for miR-26a, we compared the lists of the first 50 putative targets predicted by PicTar and MiRanda algorithms (http://pictar.mdc-berlin.de/ and http://www.microrna.org, respectively). Among a few common targets found in these lists, we chose Wee1 for future experiments, due to its pharmacological relevance. Importantly, Wee1 was predicted to be also the target for miR-16 (Figure 5a). To test whether miR-26a and miR-16 indeed target Chk1 and Wee1, we employed a luciferase reporter assay in which the activity of the luciferase gene fused to 3′UTR of either Wee1 or Chk1 was assayed in the presence of miR-16 or miR-26, or both together (Figure 5b). Transfection of miR-16 decreased the Luc 3-UTR Wee1 construct activity compared with control, suggesting that miR-16 directly targets Wee1. Unexpectedly, despite the bioinformatics prediction, miR-26a did not affect the activity of Luc 3-UTR Wee1 (Figure 5b). However, when both miRs were co-transfected together, a synergistic effect was observed, resulting in a more than threefold decrease of the luciferase activity. Similarly, activity of the Luc 3-UTR Chek1 construct was also attenuated fivefold versus the control activity when both miRs were co-transfected (Figure 5b).
Figure 5.
Chk1 and Wee1 are the targets of p53-dependent miR-16 and miR-26a. (a) Effect of miR-16 overexpression alone or together with its antago-miR (inhibitor) on expression levels of Chk1 and cyclin E was assessed by western blotting using specific antibodies. Beta-tubulin was used as a loading control. (b) Effect of individual or simultaneous overexpression of miR-16 and miR-26a on expression levels of Wee1 and Chk1 in H1299 cells. Expression levels of Wee1 and Chk1 in the cells transfected with control oligo were arbitrarily set as 1. Intensities of bands corresponding to the Wee1 and Chk1 proteins were calculated using ImageQuant software. (c) To determine the effect of p53 activation on cellular levels of the Chk1 and Wee1 proteins isogenic HCT116 cell lines with different p53 status were treated with doxorubicin for 16 h followed by western blotting against the respective proteins. Note, that anti-p53 antibody gave a non-specific band in samples prepared from p53-deficient cells. (d) Shown are the regions of homology between Wee1 and Chk1 3-UTRs and miR-16 and miR-26a sequences. (e) A schematic presentation of putative miR-16- and miR-26a-binding sites in the 3-UTR regions of Chk1 and Wee1. Below are shown the results of luciferase assay in which the activities of 3-UTRs of Chk1 and Wee1 fused to the luciferase gene constructs were measured in the presence of individually or simultaneously expressed miR-16 and/or miR-26a. Binding of these miRs to 3-UTRs of the respective genes should result in repression of the protein synthesis and hence decrease luciferase activity. Fold repression was calculated against the value of luciferase activity of the cells transfected with respective vectors in the absence of miRs, which was set as 1
Next, we decided to confirm the previously published targets for miR-16 by transfecting synthetic pre-curser of miR-16 or its inhibitor, antago-miR-16, into p53-deficient H1299 cells and probe the levels of cyclin E and Chk1 expression by western blotting (Figure 5c). As evident from the figure, 15 nM of miR-16 pre-cursor completely eliminated cyclin E and severely attenuated the level of Chk1 expression. This effect was specific, because the expression levels of both cyclin E and Chk1 were restored when miR-16 pre-cursor was co-transfected with antago-miR-16 inhibitor (Figure 5c).
To further validate our results obtained in the luciferase test, we examined how miR-16 and miR-26a pre-cursors affect Wee1 and Chk1 on the protein level (Figures 5d and e). On transfection with miR-26a pre-cursor, the level of Wee1 did not change, which is consistent with the results of the luciferase assay (Figure 5d, upper panel). Unexpectedly, despite the fact that miR-26a has no predicted binding sites in the 3′-UTR of Chk1, it affected the Chk1 protein levels (Figure 5d, middle panel). Consistent with the results of the luciferase assay, ectopic expression of miR-16 attenuated the expression of both Wee1 and Chk1 (twofold). Notably, the levels of Wee1 and Chk1 expression were synergistically downregulated (threefold and fivefold, respectively) by co-transfection of the miR-16 and miR-26a pre-cursors (Figure 5d, middle panel).
We hypothesized that as DNA damage activates expression of miR-16 and miR-26 mediated by p53, then the expression of Chk1 and Wee1 should be negatively regulated by DNA damage in a p53-dependent manner. To validate this hypothesis, isogenic HCT116 cell lines (p53+ and p53−) were untreated or treated with doxorubicin and analysed for the presence of Chk1 and Wee1 proteins (Figure 5e). In accord with our predictions, the levels of both Chk1 and Wee1 proteins were diminished on activation of p53 in HCT116 p53+ cells, but not in the p53− ones (Figure 5e). Taken together, these results suggest that expression of the Wee1 and Chk1 proteins may be controlled by p53-dependent miR-16 and -26a.
Overexpression of miR-16 and miR-26a on DNA damage augments G1/S cell cycle arrest and apoptosis
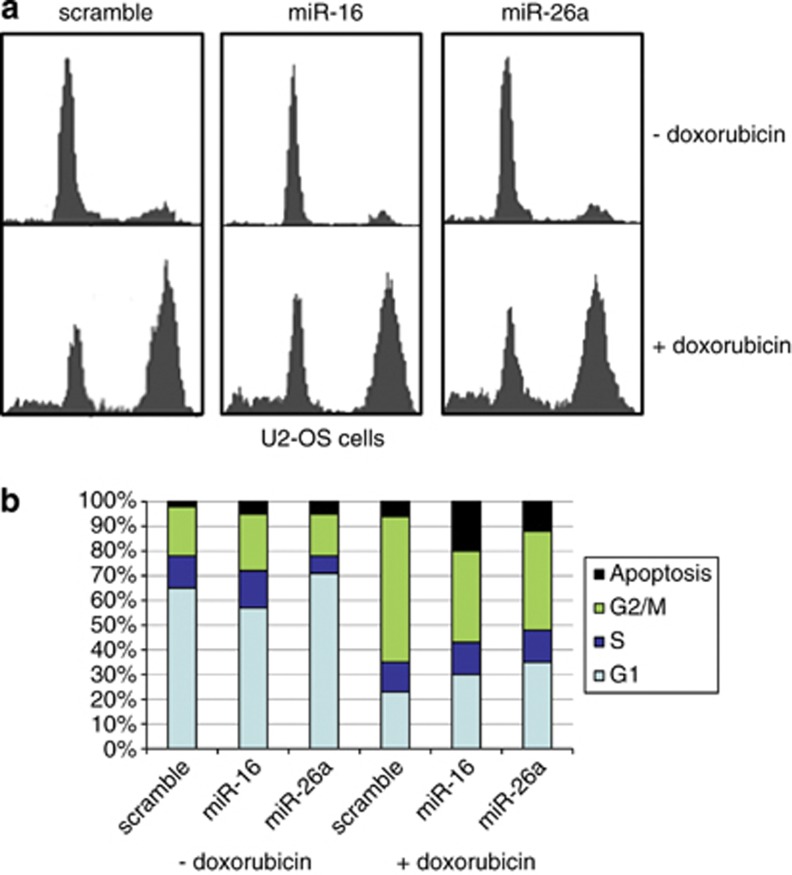
As both Chk1 and Wee1 kinases participate in regulation of the cell cycle progression through G2/M, we sought to ascertain their effect on cell cycle on DNA damage by miR-dependent ablation of these proteins (Figure 6). U2-OS cells transfected with scrambled miR, miR-16, or miR-26a were non-treated or treated with doxorubicin. In the absence of doxorubicin, all three cell lines showed similar cell cycle distribution patterns (Figure 6a, upper panel). However, doxorubicin treatment affected these cell lines differently: control cells were arrested in G2/M phase (60%) with only 20% arrested in G1 and 5% undergone apoptosis (Figure 6a, lower panel, and Figure 6b), whereas cells expressing miR-16 or miR-26a exhibited a more pronounced cell cycle arrest in G1 phase (30% and 35%, respectively) and an increased apoptosis (20% and 15%, respectively).
Figure 6.
Cell cycle analysis of U2-OS cells transfected with scramble, miR-16, and miR-26a oligonucleotides. (a) Cell cycle profiles of U2-OS cells transfected with indicated miR oligos in the absence or presence of 0.5 μM doxorubicin. Following transfection, the cells were treated with doxorubicin for 14 h before fixing with methanol and staining with propidium iodine. (b) Graphic representation of the results shown in a
Augmented expression of Chek1 and Wee1 is associated with poor survival prognosis
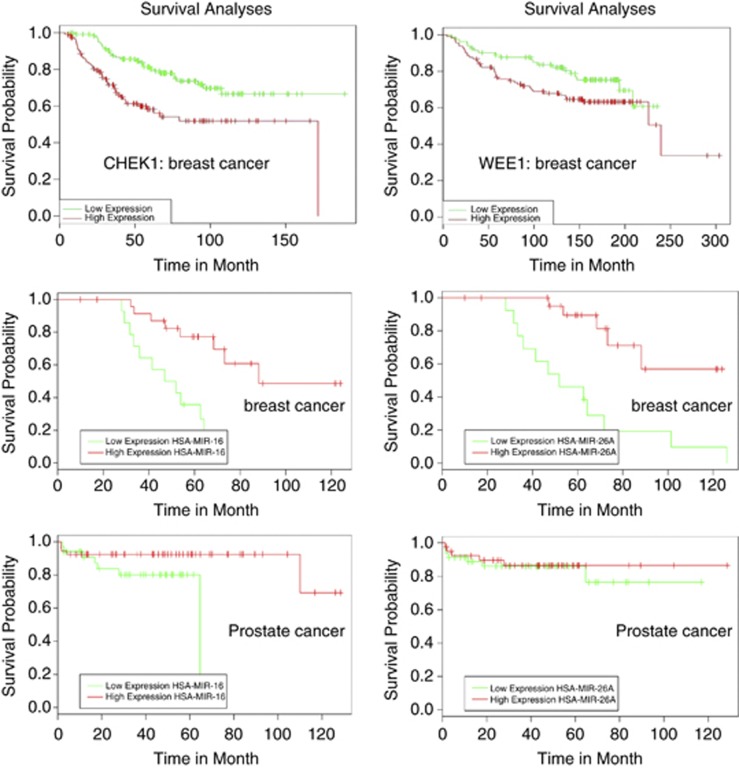
To assess the biological significance of our in vitro findings on Wee1 and Chk1 inhibition by p53-dependent miR-16 and miR-26a, we determined the role of these checkpoint kinases in survival of breast cancer patients using bioinformatics (PPISURV,28 bioprofiling.de29) (Figure 7, upper panels). Both kinases had negative impact on the survival of breast cancer patients. Next, we wanted to determine whether the in vitro effects of miR-16 and miR-26a correlated with survival rates of patients diagnosed with breast or prostate cancer using a publically available bioinformatics tool MiruMir30 (Figure 7). Importantly, high levels of expression for miR-16 and miR-26a correlated with better survival rates for both breast and prostate cancer patients. These results suggest that miR-16 and miR-26a are important prognostic markers and that their targets, including Wee1 and Chk1, negatively contribute to the survival rates of cancer patients.
Figure 7.
A bioinformatics analysis of the effect of Chk1, Wee1, miR-16 and miR-26a expression on survival rates for both breast and prostate cancer patients. The two upper panels show correlations between the levels of expression of Chk1 and Wee1 and survival rates of breast cancer patients. The two middle and two bottom panels show correlations between miR-16 and miR-26a levels of expression and the survival rates of breast and prostate cancer patients, respectively
We also investigated whether these two microRNAs were co-regulated in breast cancer samples and whether this phenomenon was dependent on p53. To this end, we computed individual Pearson correlations for miR-16 and miR-26a expression profiles with all other measured 410 microRNAs from 51 different breast cancer cell lines described in Riaz et al.31 The value of correlation between miR-16 and miR-26a was 0.57 and has rank 7 for both microRNAs among 410 microRNAs tested. This provides an estimation of significance of the correlation: the probability to select randomly a partner for either miR-16 or miR-26a with correlation higher than 0.57 is calculated as 6/410∼ 0.014. This calculated P-value confirms that the correlation between miR-16 and miR-26 is significant.
Moreover, when considering only the TP53-positive cell lines, Pearson correlation for both miR-26a and miR-16 expression profiles increased to 0.71, which statistically supports our hypothesis that TP53 is closely involved in regulation of both microRNAs.
Discussion
The biological response to DNA damage requires the activation of the cell death pathway by p53 or its family members.32, 33, 34 p53 is a powerful transcription factor35 that drives a large number of promoters,36 including novel pathways such as the connection between IL-7Ra and telomere erosion37 or the silencing of repeats and non-coding RNA,38 and the metabolism of the cell via the pathways of mevalonate39 or serine.40 As a consequence of transactivation of so many different promoters described so far, p53 is able to control different biochemical pathways affecting the regulation of life41 and death42 of the cell, or its senescence43 and hypoxia.44
Because of such versatility, p53 is considered as a critical tumour suppressor and thus, perhaps not surprisingly, found mutated or deleted in more than half of all human tumours.45
Our microarray data showed that among several microRNAs regulated by p53 in response to genotoxic stress, miR-16 and miR-26a belonged to the most abundantly expressed ones. Importantly, both luciferase assay and ChIP analysis showed that p53 bound the promoters of miR-16 and miR-26a genes (Figures 2 and 3). However, despite the activation of miR-16-2 promoter observed in the luciferase assay, we failed to detect any appreciable transcriptional induction of the endogenous miR-16-2 gene. This result argues that the artificial reporter systems do not always faithfully reproduce regulatory events on the endogenous promoters. Importantly, we also found that p53 regulated miR-16-2 not transcriptionally, but post-transcriptionally, which is consistent with previously published data.23
The p53-regulated miR-16 and miR-26a are known to have anti-proliferative and pro-apoptotic effects in cancer cells.25, 46, 47 Significantly, the miR-26a-1-encoding locus at 3p21.3 is contained within a region that is frequently deleted in small cell lung carcinomas, renal cell carcinomas, and breast carcinomas, suggesting that this micro-RNA is a tumour suppressor.48 Likewise, the miR-16-1-containing locus is either deleted or inactivated in chronic lymphocytic leukaemia, prostate cancer, and non-small lung carcinoma.49, 50, 51 Among the known targets of miR-16 are the cell cycle-regulating and anti-apoptotic proteins (cyclin D1 and D3, cyclin E, cdk6, and bcl-2, respectively).26, 46
Our bioinformatics analysis predicted that in addition to the targets mentioned above, miR-16 and miR-26a may also target cell cycle kinases, Chk1 and Wee1. In line with our findings is a recently published report showing that the miR-15/16/195/424/497 family sensitized cisplatin-resistant cells to apoptosis by targeting the WEE1 and CHK1 gene expression.27 Our data suggest that miR-26a by itself did not affect the translation levels of 3-UTR'Wee1-luc, but synergistically inhibited its expression when co-transfected with miR-16. This finding was confirmed by western blot analysis (Figure 5b). It can be hypothesized that when acting together, these miRs de-stabilize the 3′-UTR of Wee1 more efficiently to prevent the loading of translation factors. Although no binding sites for miR-26a was predicted in the 3′-UTR of the CHEK1 gene, we detected a 50% decrease of the expression level of Chk1 on ectopic expression of miR-26a, as judged by western blotting (Figure 5b). One possibility is that miR-26a targets the coding region of Chk1, which is unusual for miRs. Alternatively, miR-26a may affect the expression of Chk1 indirectly, by targeting its positive regulator(s).
The significance of our findings is underscored by the fact that both Chk1 and Wee1 are important pharmacological targets.52 As a consequence of their inactivation, cancer cells undergo unscheduled mitosis and halt in G1 or get eliminated via apoptosis. Accordingly, genetic ablation or pharmacological inhibition of Chk1 and/or Wee1 results in sensitization of cancer cells to genotoxic therapy.27 Moreover, several clinical studies suggest that the pharmacological inhibition of these kinases is a new promising therapy to treat various tumours.53
The biological importance of our results is supported by the bioinformatics analysis across several expression platforms, whereby the expression of both miR-16 and miR-26a correlates with a better survival prognosis for breast cancer and prostate cancer patients (Figure 7).
In addition, our data provide a new insight to a long-standing observation that p53 represses Wee1 and Chk1 on genotoxic stress.54, 55 Thus, according to our hypothesis, upregulation of miR-16 and miR-26a by p53 during genotoxic stress attenuates the expression of Chk1 and Wee1 kinases, resulting in the loss of G2/M checkpoint and unscheduled mitosis. This causes an accumulation of cells in G1 phase and their apoptosis (Figure 8).
Figure 8.
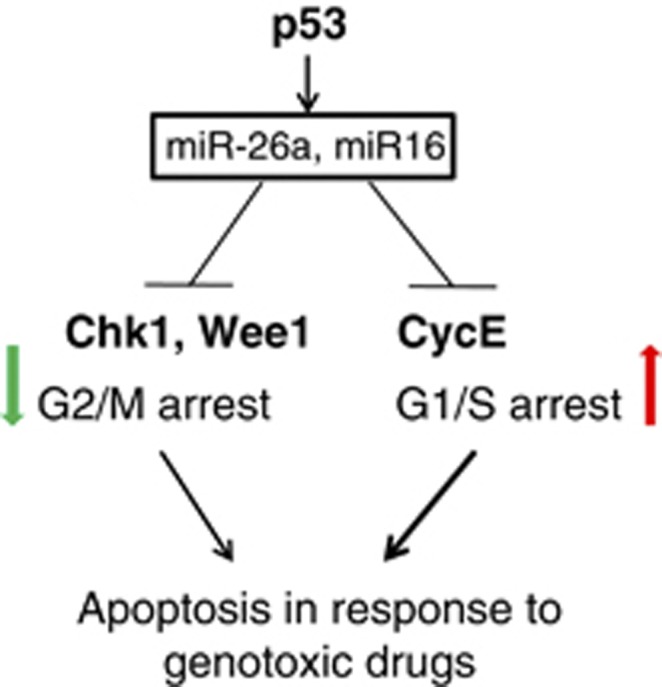
A schematic model of how p53 via activation of miR-26a and miR-16 promotes G1/S arrest and apoptosis in response to genotoxic drugs. On the one hand, miR-16 and 26a downregulate G2/M checkpoint kinases, Chk1 and Wee1, resulting in slippage of damaged cancer cells from the mitotic checkpoint arrest and their elimination via apoptosis. On the other hand, miR-16 represses expression of several cell cycle promoting genes, including cyclin E, cyclin D, cdk4 and cdk6 resulting in their arrest in G1/S, which subsequently elicits apoptosis
Materials and Methods
Cells
The human lung adenocarcinoma cell line H1299, human osteosarcoma cell line U2-OS, and human embryonic kidney cell line HEK-293 were purchased from the ATCC (Manassas, VA, USA). Human colon adenocarcinoma cell lines HCT116 (p53+) and p53(−) were kindly provided by B Vogelstein. U2-OS cells with stable expression of shRNA against p53 were obtained by lentiviral transfection with either empty or bearing shRNA against p53 pLKO vectors as described previously.56 These cells were maintained in DMEM medium (Gibco, Carlsbad, CA, USA) or DMEM medium (Gibco) supplemented with 10% fetal bovine serum (Gibco). Cells were grown at 37 °C in a humidified atmosphere with 5% CO2.
miR-16 and miR-26a overexpression or knockdown
miR-16 and miR-26a overexpression was achieved by transfecting cells with pre-miR-16 (a synthetic RNA oligonucleotide duplex mimicking miR-16 precursor), whereas miR-16 knockdown was achieved by transfecting cells with anti-miR-16 (a chemically modified single-stranded antisense oligonucleotide designed to specifically target against mature miR-16). Scrambled negative control RNA (pre-miR-control and anti-miR-control) served as negative control. Synthetic RNA molecules, including pre-miR-16, anti-miR-16 and scrambled negative control RNA, were purchased from Dharmacon (Thermo Scientific). Cells were seeded on 60-mm dishes and were transfected the following day using Lipofectamine 2000 (Invitrogen, Carlsbad, CA, USA) according to the manufacturer's instructions. For each well, equal doses (200 pmol) of pre-miR-control, pre-miR-16, anti-miR-control or anti-miR-16 were added. Similar procedures were done for miR-26a. Cells were harvested 24 h after transfection.
RNA isolation and relative quantification RT-PCR
Total RNA was extracted from the cultured cells using TRIzol Reagent (Invitrogen) according to the manufacturer's instructions. Assays to quantify mature miR-16 and miR-26a were carried out using microRNA kit (Applied Biosystems, Foster City, CA, USA) according to the manufacturer's instructions. miRNA expression in cells was normalized to that of the U6 snRNA. The amount of miR-16 relative to the internal control U6 was calculated with the equation 2−ΔΔCT, in which ΔΔCT=(CT miR−CT U6)target−(CT miR−16−CT U6)control.
For relative quantification RT-PCR analysis of p21 and β-actin mRNA, 1 μg of total RNA was reverse-transcribed to cDNA with oligod(T) using Ready-to-Go kit (GE Healthcare, Amersham, UK). Then real-time PCR was performed on RotorGene 6000 PCR machine (Qiagen, Hilden, Germany) using SYBR green dye (Invitrogen). The 20-μl PCR reaction included 1 μl RT product, 1 × QuantiTect SYBR green PCR Master Mix, and 0.5 μM each sense and antisense primers. The reactions were incubated in a 96-well plate at 95 °C for 5 min, followed by 40 cycles of 95 °C for 30 s, 60 °C for 30 s, and 72 °C for 30 s. All reactions were run in triplicate. After the reactions, the CT values were determined using fixed threshold settings. The relative amount of p21 mRNA was normalized to β-actin mRNA. Expression of p21 was analysed by RT-PCR using the following primers: 5′-GACACCACTGGAGGGTGACT, 3′-CTCTTGGAGAAGATCAGCCG. Primers to beta-actin were purchased from (PrimerDesign, Southampton, UK).
Microarray procedures
RNA was extracted by using TRIzol (Invitrogen), according to the manufacturer's protocol. RNA was labelled and hybridized on microRNA microarray chips as previously described.57 Briefly, 5 μg of RNA from each sample was biotin labelled during reverse transcription using random hexamers. Raw data were normalized and analysed by GeneSpring GX software version 7.3 (Agilent Technologies, Santa Clara, CA, USA) as described.57
miR-16 and miR-26a target prediction
The miRNA target prediction and analysis was performed with the algorithms from TargetScan (http://www.targetscan.org/) PicTar (http://pictar.mdc-berlin.de) and miRanda (http://www.microrna.org/).
ChIP assay
Chromatin immunoprecipitation (ChIP) assays were performed as described previously.56 Briefly, 3 × 10⁶ cells per sample were cross-linked with 1% formaldehyde for 15 min. Cross-linking was neutralized with 0.125 M glycine, and cells were scraped in PBS. Chromatin was sonicated using the Diagenode (Liège, Belgium) Bioruptor for 15 min with 30-s pulse/pause cycles in polycarbonate tubes on ice to shear chromatin to 300- to 600-bp fragments. Unsheared debris was spun down, and then the chromatin was incubated overnight with the appropriate antisera, concurrent with the blocking of protein G-Sepharose beads using 2.5% BSA. Immune complexes were then precipitated using ‘blocked' protein G beads for 4 h at 4 °C, washed three times, and then eluted. Immunoprecipitated DNA was purified and quantitative PCR was performed with 1 μl of DNA to assess p53, Drosha and p68 binding levels. The following antibodies were used: anti-p53 (Ab-6, Millipore, Billerica, MA, USA), anti-Drosha (Abcam, Cambridge, UK; ab37165) and anti-p68 (Santa Cruz Biotechnology, Santa Cruz, CA, USA). The following primers were used to analyse miR-26a: +500 bp: 5′-CCTTCTTTCAGTCACCCATGA, 3′-GCTGGCCGAGGAATTCTATAC; +1500 bp, 5′-CTTCAACCCCAGACCTTCCT; 3′-TCCAGGCCCAGCATATTG; +2000 bp, 5′-CTGCCATTGCAGGTGTATGT, 3′-GCCAAGCTGGCAGTAAAGAG; −3000 bp, 5′-TGGATCCCAAGTGAAGAACC; 3-GAAAAACCATTCCCCAGCTT.
CHIP primers for miR 15b/16-2: SMC4 promoter/1st exon: 5′-GCAGGAGCGACAATAAGATGG; 3′-CGCTCCTACCGGTGTTTCG; miR-16-2 (−700) (700 bp up from the miR 15b/16-2 gene, p53BS) 5′-TTCCATGCTGTTTTGGTCCC, 3′-AGGCTTGTTTGGAGGTGGGT.
Western blotting
p53, Chk1, Cyclin E and Wee1 protein levels were quantified by western blot analysis of whole-cell extracts using antibodies against the corresponding proteins. These samples were normalized by blotting with an antibody against α-tubulin. The following antibodies were used: anti-p53 (Ab-6, Millipore), anti-Cyclin E (HE12; Santa Cruz Biotechnology), anti-Wee1 (Cell Signalling, Danvers, MA, USA), Chk1 (Cell Signalling), and anti-α-tubulin (B-7, Santa Cruz Biotechnology).
Luciferase assay of 3′-UTR constructs
The entire 3′-UTRs of human Wee1 and Chek1 were amplified from human genomic DNA using PCR. The PCR products were inserted as Xba1 fragments into the p-MIR-report plasmid (Ambion, Life Technologies, Carlsbad, CA, USA). The following primers were used to amplify Wee1 3′UTR: 5′-CCAAGTCTAGAGAACCGCTCTGTCAGCCTTA and 3′-AAAGATCTAGAAGAAAACAGGCATCACAAGGA. Chk1 3′UTR was amplified using the following primers: 5′-ACCGATCTAGAAGCCAGAAGATTTGGCTTCC and 3′-TTCGGTCTAGAGGCTTCGCTTCACAGACTGA.
Efficiency of the cloning was confirmed by sequencing. For luciferase reporter assays, cells were cultured in six-well plates, and each well was transfected with 0.5 μg of firefly luciferase reporter plasmid, 0.5 μg of β-galactosidase expression plasmid (Ambion), and equal amounts of scrambled negative control RNA, pre-miR-26a, pre-miR-16, or anti-miR-16 using Lipofectamine 2000 (Invitrogen). The β-galactosidase plasmid was used as a transfection control. At 24 h post transfection, cells were assayed using luciferase assay kits (Promega, Madison, WI, USA). The data depicted are representative of three independent experiments performed on different days.
Cell cycle assay
Cells were harvested, washed once with PBS, and fixed in 70% ethanol overnight. Staining for DNA content was performed with 50 mg ml−1 propidium iodide and 1 mg ml−1 RNase A for 30 min. Analysis was performed on a FACS Canto II flow cytometer (BD Biosciences, Franklin Lakes, NJ, USA) with Cell Quest Pro software. Cell cycle modelling was performed with Modfit 3.0 software (Verity Software House, Topsham, ME, USA).
Statistical analysis
All presented images of western blotting and cell cycle assay are representative of at least three independent experiments. Relative quantification RT-PCR, luciferase reporter, and cell viability assays were performed in triplicate, and each experiment was repeated three to five times. The data shown are the mean±S.D. of at least three independent experiments. Statistical significance was considered at P<0.05 using the Student's t-test.
miRs expression analysis in respect to survival outcome
Effects of miR-16 and miR-26a expression on survival outcome of cancer patients were analysed using a bioinformatics tool, MIRUMIR. This algorithm exploits rank information from the publically available clinical miR expression data sets annotated with patient survival information. For each available data set, samples are grouped with respect to expression rank of the user-specified miR. The ‘low expression' and ‘high expression' groups are those where expression rank of miR is less or more than average expression rank across the data set, respectively. This separation of patients into ‘low' and ‘high' groups along with survival information is next used to find any statistical differences in survival outcome. The R statistical package is used to perform survival analyses and to draw KM plots.
Acknowledgments
We are grateful to Dr George Calin for the gift of the miR-16-1-luciferase plasmid. The work was supported by MRC to GM and by the Russian Ministry of Education (11.G34.31.0069 to GM and 8280-10.08.2012 to NAB) and the Russian Foundation for Basic Research (A_2013 13-04-01024 to NAB).
Glossary
- miR
micro RNA
- dox
doxorubicin
- shRNA
small hairpin RNA
- Q-RT-PCR
quantitative reverse transcription PCR
- KD
knock down
- scr
scrambled shRNA
- adr
adriamycin
- PBS
phosphate saline buffer
The authors declare no conflict of interest.
Footnotes
Edited by A Stephanou
References
- Bourdon JC, De Laurenzi V, Melino G, Lane D. p53: 25 years of research and more questions to answer. Cell Death Differ. 2003;10:397–399. doi: 10.1038/sj.cdd.4401243. [DOI] [PubMed] [Google Scholar]
- Brown JP, Wei WY, Sedivy JM. Bypass of senescence after disruption of p21(CIP1/WAF1) gene in normal diploid human fibroblasts. Science. 1997;277:831–834. doi: 10.1126/science.277.5327.831. [DOI] [PubMed] [Google Scholar]
- Deng C, Zhang P, Harper JW, Elledge SJ, Leder P. Mice lacking p21CIP1/WAF1 undergo normal development, but are defective in G1 checkpoint control. Cell. 1995;82:675–684. doi: 10.1016/0092-8674(95)90039-x. [DOI] [PubMed] [Google Scholar]
- Waldman T, Kinzler KW, Vogelstein B. P21 is necessary for the P53-mediated G(1) arrest in human cancer-cells. Cancer Res. 1995;55:5187–5190. [PubMed] [Google Scholar]
- Chan TA, Hwang PM, Hermeking H, Kinzler KW, Vogelstein B. Cooperative effects of genes controlling the G(2)/M checkpoint. Gene Dev. 2000;14:1584–1588. [PMC free article] [PubMed] [Google Scholar]
- Hermeking H, Lengauer C, Polyak K, He TC, Zhang L, Thiagalingam S, et al. 14-3-3 sigma is a p53-regulated inhibitor of G2/M progression. Mol Cell. 1997;1:3–11. doi: 10.1016/s1097-2765(00)80002-7. [DOI] [PubMed] [Google Scholar]
- Jin SQ, Antinore MJ, Lung FT, Dong X, Zhao HC, Fan FY, et al. The GADD45 inhibition of Cdc2 kinase correlates with GADD45-mediated growth suppression. J Biol Chem. 2000;275:16602–16608. doi: 10.1074/jbc.M000284200. [DOI] [PubMed] [Google Scholar]
- Taylor WR, Stark GR. Regulation of the G2/M transition by p53. Oncogene. 2001;20:1803–1815. doi: 10.1038/sj.onc.1204252. [DOI] [PubMed] [Google Scholar]
- Liu QH, Guntuku S, Cui XS, Matsuoka S, Cortez D, Tamai K, et al. Chk1 is an essential kinase that is regulated by Atr and required for the G(2)/M DNA damage checkpoint. Gene Dev. 2000;14:1448–1459. [PMC free article] [PubMed] [Google Scholar]
- Stumpff J, Duncan T, Homola E, Campbell SD, Su TT. Drosophila Wee1 kinase regulates Cdk1 and mitotic entry during embryogenesis. Curr Biol. 2004;14:2143–2148. doi: 10.1016/j.cub.2004.11.050. [DOI] [PMC free article] [PubMed] [Google Scholar]
- Krajewska M, Heijink AM, Bisselink YJWM, Seinstra RI, Sillje HHW, de Vries EGE, et al. Forced activation of Cdk1 via wee1 inhibition impairs homologous recombination. Oncogene. 2013;32:3001–3008. doi: 10.1038/onc.2012.296. [DOI] [PubMed] [Google Scholar]
- Shieh SY, Ahn J, Tamai K, Taya Y, Prives C. The human homologs of checkpoint kinases Chk1 and Cds1 (Chk2) phosphorylate p53 at multiple DNA damage-inducible sites. Gene Dev. 2000;14:750. [PMC free article] [PubMed] [Google Scholar]
- Hermeking H. p53 enters the microRNA world. Cancer Cell. 2007;12:414–418. doi: 10.1016/j.ccr.2007.10.028. [DOI] [PubMed] [Google Scholar]
- Barlev NA, Sayan BS, Candi E, Okorokov AL. The microRNA and p53 families join forces against cancer. Cell Death Differ. 2010;17:373–375. doi: 10.1038/cdd.2009.73. [DOI] [PubMed] [Google Scholar]
- Bartel DP. MicroRNAs: Genomics, biogenesis, mechanism, and function. Cell. 2004;116:281–297. doi: 10.1016/s0092-8674(04)00045-5. [DOI] [PubMed] [Google Scholar]
- Hermeking H. MicroRNAs in the p53 network: micromanagement of tumour suppression. Nat Rev Cancer. 2012;12:613–626. doi: 10.1038/nrc3318. [DOI] [PubMed] [Google Scholar]
- Xi YG, Shalgi R, Fodstad O, Pilpel Y, Ju JF. Differentially regulated micro-RNAs and actively translated messenger RNA transcripts by tumor suppressor p53 in colon cancer. Clin Cancer Res. 2006;12:2014–2024. doi: 10.1158/1078-0432.CCR-05-1853. [DOI] [PubMed] [Google Scholar]
- Kulichkova VA, Tsimokha AS, Fedorova OA, Moiseeva TN, Bottril A, Lezina L, et al. 26S proteasome exhibits endoribonuclease activity controlled by extra-cellular stimuli. Cell Cycle. 2010;9:840–849. doi: 10.4161/cc.9.4.10829. [DOI] [PubMed] [Google Scholar]
- Moiseeva TN, Bottrill A, Melino G, Barlev NA. DNA damage-induced ubiquitylation of proteasome controls its proteolytic activity. Oncotarget. 2013;4:1338–1348. doi: 10.18632/oncotarget.1060. [DOI] [PMC free article] [PubMed] [Google Scholar]
- Morgunkova A, Barlev NA. Lysine methylation goes global. Cell Cycle. 2006;5:1308–1312. doi: 10.4161/cc.5.12.2820. [DOI] [PubMed] [Google Scholar]
- Mittenberg AG, Moiseeva TN, Barlev NA. Role of proteasomes in transcription and their regulation by covalent modifications. Front Biosci. 2008;13:7184–7192. doi: 10.2741/3220. [DOI] [PubMed] [Google Scholar]
- Fedorova OA, Moiseeva TN, Nikiforov AA, Tsimokha AS, Livinskaya VA, Hodson M, et al. Proteomic analysis of the 20S proteasome (PSMA3)-interacting proteins reveals a functional link between the proteasome and mRNA metabolism. Biochem Biophys Res Commun. 2011;416:258–265. doi: 10.1016/j.bbrc.2011.10.126. [DOI] [PubMed] [Google Scholar]
- Suzuki HI, Yamagata K, Sugimoto K, Iwamoto T, Kato S, Miyazono K. Modulation of microRNA processing by p53. Nature. 2009;460:529–533. doi: 10.1038/nature08199. [DOI] [PubMed] [Google Scholar]
- Fukuda T, Yamagata K, Fujiyama S, Matsumoto T, Koshida I, Yoshimura K, et al. DEAD-box RNA helicase subunits of the Drosha complex are required for processing of rRNA and a subset of microRNAs. Nat Cell Biol. 2007;9:604–611. doi: 10.1038/ncb1577. [DOI] [PubMed] [Google Scholar]
- Ofir M, Hacohen D, Ginsberg D. miR-15 and miR-16 Are Direct Transcriptional Targets of E2F1 that Limit E2F-Induced Proliferation by Targeting Cyclin E. Mol Cancer Res. 2011;9:440–447. doi: 10.1158/1541-7786.MCR-10-0344. [DOI] [PubMed] [Google Scholar]
- Liu Q, Fu H, Sun F, Zhang H, Tie Y, Zhu J, et al. miR-16 family induces cell cycle arrest by regulating multiple cell cycle genes. Nucleic Acids Res. 2008;36:5391–5404. doi: 10.1093/nar/gkn522. [DOI] [PMC free article] [PubMed] [Google Scholar]
- Pouliot LM, Chen YC, Bai J, Guha R, Martin SE, Gottesman MM, et al. Cisplatin sensitivity mediated by WEE1 and CHK1 is mediated by miR-155 and the miR-15 family. Cancer Res. 2012;72:5945–5955. doi: 10.1158/0008-5472.CAN-12-1400. [DOI] [PMC free article] [PubMed] [Google Scholar]
- Antonov AV, Krestyaninova M, Knight RA, Rodchenkov I, Melino G, Barlev NA.PPISURV: a novel bioinformatics tool for uncovering the hidden role of specific genes in cancer survival outcome Oncogene 2013. e-pub ahead of print 20 May 2013doi: 10.1038/onc.2013.119 [DOI] [PubMed]
- Antonov AV. BioProfiling.de: analytical web portal for high-throughput cell biology. Nucleic Acids Res. 2011;39:W323–W327. doi: 10.1093/nar/gkr372. [DOI] [PMC free article] [PubMed] [Google Scholar]
- Antonov AV, Knight RA, Melino G, Barlev NA, Tsvetkov PO. MIRUMIR: an online tool to test microRNAs as biomarkers to predict survival in cancer using multiple clinical data sets. Cell Death Differ. 2013;20:367. doi: 10.1038/cdd.2012.137. [DOI] [PMC free article] [PubMed] [Google Scholar]
- Riaz M, van Jaarsveld MT, Hollestelle A, Prager-van der Smissen WJ, Heine AA, Boersma AW, et al. miRNA expression profiling of 51 human breast cancer cell lines reveals subtype and driver mutation-specific miRNAs. Breast Cancer Res. 2013;15:R33. doi: 10.1186/bcr3415. [DOI] [PMC free article] [PubMed] [Google Scholar]
- Melino G, Knight RA, Nicotera P. How many ways to die? How many different models of cell death. Cell Death Differ. 2005;12 (Suppl 2:1457–1462. doi: 10.1038/sj.cdd.4401781. [DOI] [PubMed] [Google Scholar]
- Tomasini R, Mak TW, Melino G. The impact of p53 and p73 on aneuploidy and cancer. Trends Cell Biol. 2008;18:244–252. doi: 10.1016/j.tcb.2008.03.003. [DOI] [PubMed] [Google Scholar]
- Conforti F, Sayan AE, Sreekumar R, Sayan BS. Regulation of p73 activity by post-translational modifications. Cell Death Dis. 2012;3:e285. doi: 10.1038/cddis.2012.27. [DOI] [PMC free article] [PubMed] [Google Scholar]
- Levine AJ. The paths to death and differentiation. Cell Death Differ. 2011;18:1391–1392. doi: 10.1038/cdd.2011.41. [DOI] [PMC free article] [PubMed] [Google Scholar]
- Brady CA, Jiang D, Mello SS, Johnson TM, Jarvis LA, Kozak MM, et al. Distinct p53 transcriptional programs dictate acute DNA-damage responses and tumor suppression. Cell. 2011;145:571–583. doi: 10.1016/j.cell.2011.03.035. [DOI] [PMC free article] [PubMed] [Google Scholar]
- Kibe R, Zhang S, Guo D, Marrero L, Tsien F, Rodriguez P, et al. IL-7Ralpha deficiency in p53null mice exacerbates thymocyte telomere erosion and lymphomagenesis. Cell Death Differ. 2012;19:1139–1151. doi: 10.1038/cdd.2011.203. [DOI] [PMC free article] [PubMed] [Google Scholar]
- Leonova KI, Brodsky L, Lipchick B, Pal M, Novototskaya L, Chenchik AA, et al. p53 cooperates with DNA methylation and a suicidal interferon response to maintain epigenetic silencing of repeats and noncoding RNAs. Proc Natl Acad Sci USA. 2013;110:E89–E98. doi: 10.1073/pnas.1216922110. [DOI] [PMC free article] [PubMed] [Google Scholar]
- Freed-Pastor WA, Mizuno H, Zhao X, Langerod A, Moon SH, Rodriguez-Barrueco R, et al. Mutant p53 disrupts mammary tissue architecture via the mevalonate pathway. Cell. 2012;148:244–258. doi: 10.1016/j.cell.2011.12.017. [DOI] [PMC free article] [PubMed] [Google Scholar]
- Maddocks OD, Berkers CR, Mason SM, Zheng L, Blyth K, Gottlieb E, et al. Serine starvation induces stress and p53-dependent metabolic remodelling in cancer cells. Nature. 2013;493:542–546. doi: 10.1038/nature11743. [DOI] [PMC free article] [PubMed] [Google Scholar]
- Ahmed A, Yang J, Maya-Mendoza A, Jackson DA, Ashcroft M. Pharmacological activation of a novel p53-dependent S-phase checkpoint involving CHK-1. Cell Death Dis. 2011;2:e160. doi: 10.1038/cddis.2011.42. [DOI] [PMC free article] [PubMed] [Google Scholar]
- Huang BH, Zhuo JL, Leung CH, Lu GD, Liu JJ, Yap CT, et al. PRAP1 is a novel executor of p53-dependent mechanisms in cell survival after DNA damage. Cell Death Dis. 2012;3:e442. doi: 10.1038/cddis.2012.180. [DOI] [PMC free article] [PubMed] [Google Scholar]
- Peche LY, Scolz M, Ladelfa MF, Monte M, Schneider C. MageA2 restrains cellular senescence by targeting the function of PMLIV/p53 axis at the PML-NBs. Cell Death Differ. 2012;19:926–936. doi: 10.1038/cdd.2011.173. [DOI] [PMC free article] [PubMed] [Google Scholar]
- Sermeus A, Michiels C. Reciprocal influence of the p53 and the hypoxic pathways. Cell Death Dis. 2011;2:e164. doi: 10.1038/cddis.2011.48. [DOI] [PMC free article] [PubMed] [Google Scholar]
- Harris CC. p53: at the crossroads of molecular carcinogenesis and risk assessment. Science. 1993;262:1980–1981. doi: 10.1126/science.8266092. [DOI] [PubMed] [Google Scholar]
- Linsley PS, Schelter J, Burchard J, Kibukawa M, Martin MM, Bartz SR, et al. Transcripts targeted by the microRNA-16 family cooperatively regulate cell cycle progression. Mol Cell Biol. 2007;27:2240–2252. doi: 10.1128/MCB.02005-06. [DOI] [PMC free article] [PubMed] [Google Scholar]
- Kota J, Chivukula RR, O'Donnell KA, Wentzel EA, Montgomery CL, Hwang HW, et al. Therapeutic microRNA delivery suppresses tumorigenesis in a murine liver cancer model. Cell. 2009;137:1005–1017. doi: 10.1016/j.cell.2009.04.021. [DOI] [PMC free article] [PubMed] [Google Scholar]
- Kashuba VI, Li JF, Wang FL, Senchenko VN, Protopopov A, Malyukova A, et al. RBSP3 (HYA22) is a tumor suppressor gene implicated in major epithelial malignancies. Proc Natl Acad Sci USA. 2004;101:4906–4911. doi: 10.1073/pnas.0401238101. [DOI] [PMC free article] [PubMed] [Google Scholar]
- Calin GA, Dumitru CD, Shimizu M, Bichi R, Zupo S, Noch E, et al. Frequent deletions and down-regulation of micro-RNA genes miR15 and miR16 at 13q14 in chronic lymphocytic leukemia. Proc Natl Acad Sci USA. 2002;99:15524–15529. doi: 10.1073/pnas.242606799. [DOI] [PMC free article] [PubMed] [Google Scholar]
- Bonci D, Coppola V, Musumeci M, Addario A, Giuffrida R, Memeo L, et al. The miR-15a-miR-16-1 cluster controls prostate cancer by targeting multiple oncogenic activities. Nat Med. 2008;14:1271–1277. doi: 10.1038/nm.1880. [DOI] [PubMed] [Google Scholar]
- Bandi N, Zbinden S, Gugger M, Arnold M, Kocher V, Hasan L, et al. miR-15a and miR-16 are implicated in cell cycle regulation in a Rb-dependent manner and are frequently deleted or down-regulated in non-small cell lung cancer. Cancer Res. 2009;69:5553–5559. doi: 10.1158/0008-5472.CAN-08-4277. [DOI] [PubMed] [Google Scholar]
- Zhang JM, Yang PL, Gray NS. Targeting cancer with small molecule kinase inhibitors. Nat Rev Cancer. 2009;9:28–39. doi: 10.1038/nrc2559. [DOI] [PubMed] [Google Scholar]
- Kawabe T. G(2) checkpoint abrogators as anticancer drugs. Mol Cancer Therapeut. 2004;3:513–519. [PubMed] [Google Scholar]
- Gottifredi V, Karni-Schmidt G, Shieh SY, Prives C. p53 down-regulates CHK1 through p21 and the retinoblastoma protein. Mol Cell Biol. 2001;21:1066–1076. doi: 10.1128/MCB.21.4.1066-1076.2001. [DOI] [PMC free article] [PubMed] [Google Scholar]
- Leach SD, Scatena CD, Keefer CJ, Goodman HA, Song SY, Yang LY, et al. Negative regulation of Wee1 expression and Cdc2 phosphorylation during p53-mediated growth arrest and apoptosis. Cancer Res. 1998;58:3231–3236. [PubMed] [Google Scholar]
- Ivanov GS, Ivanova T, Kurash J, Ivanov A, Chuikov S, Gizatullin F, et al. Methylation-acetylation interplay activates p53 in response to DNA damage. Mol Cell Biol. 2007;27:6756–6769. doi: 10.1128/MCB.00460-07. [DOI] [PMC free article] [PubMed] [Google Scholar]
- Kulshreshtha R, Ferracin M, Wojcik SE, Garzon R, Alder H, Agosto-Perez FJ, et al. A microRNA signature of hypoxia. Mol Cell Biol. 2007;27:1859–1867. doi: 10.1128/MCB.01395-06. [DOI] [PMC free article] [PubMed] [Google Scholar]


