

Abstract
The dystonias are a group of disorders characterized by involuntary twisting and repetitive movements. DYT1 dystonia is an inherited form of dystonia caused by a mutation in the TOR1A gene, which encodes torsinA. TorsinA is expressed in many regions of the nervous system, and the regions responsible for causing dystonic movements remain uncertain. Most prior studies have focused on the basal ganglia, although there is emerging evidence for abnormalities in the cerebellum too. In the current studies, we examined the cerebellum for structural abnormalities in a knock-in mouse model of DYT1 dystonia. The gross appearance of the cerebellum appeared normal in the mutant mice, but stereological measures revealed the cerebellum to be 5% larger in mutant compared to control mice. There were no changes in the numbers of Purkinje cells, granule cells, or neurons of the deep cerebellar nuclei. However, Golgi histochemical studies revealed Purkinje cells to have thinner dendrites, and fewer and less complex dendritic spines. There also was a higher frequency of heterotopic Purkinje cells displaced into the molecular layer. These results reveal subtle structural abnormalities of the cerebellum that are similar to those reported for the basal ganglia in the DYT1 knock-in mouse model.
Keywords: Mouse mutant, anatomy, Golgi histochemistry, stereology, cerebellum, Purkinje cells, deep cerebellar neuron, heterotopic cells
Introduction
The dystonias comprise a group of disorders characterized by involuntary sustained or intermittent muscle contractions with abnormal postures or repetitive movements (Albanese et al., 2013). Dystonia may occur in isolation, or it may be combined with other neurological defects (Fung et al., 2013). One inherited cause for isolated dystonia involves deletion of a GAG codon in the TOR1A gene at the DYT1 locus, resulting in the loss of a single amino acid in torsinA (Ozelius et al., 1997). This protein is a member of AAA+ family of ATPases, and it is thought to function as a molecular chaperone (Tanabe et al., 2009). However, the biochemical and cellular mechanisms by which the mutation leads to abnormal motor control in DYT1 dystonia remain unknown.
Delineating the regions of the nervous system that are most relevant for the expression of dystonia is important for guiding research regarding which neurons to target for more detailed investigation. Traditionally, dystonia has been linked with dysfunction of the basal ganglia (Hallett, 2006; Mink, 2006; Perlmutter and Mink, 2004; Peterson et al., 2010; Wichmann, 2008). However, recent studies have pointed to dysfunction of the cerebellum too (Avanzino and Abbruzzese, 2012; Filip et al., 2013; Neychev et al., 2011; Sadnicka et al., 2012; Zoons et al., 2011). TorsinA is expressed at high levels in most neurons of the cerebellum (Puglisi et al., 2013). Functional neuroimaging of human DYT1 dystonia has revealed abnormal metabolic activity of the cerebellum (Argyelan et al., 2009), and 2-deoxyglucose autoradiography has indicated abnormal cerebellar activity in a knock-in mouse model of DYT1 dystonia (Zhao et al., 2011). Although histological studies have revealed no gross structural abnormalities of the cerebellum in humans with DYT1 dystonia (Standaert, 2011) or its mouse models (Oleas et al., 2013), diffusion tensor tractography studies have implied subtle structural defects of cerebellar outflow pathways in both humans (Argyelan et al., 2009) and mice (Ulug et al., 2011).
In the current studies, subtle structural abnormalities of the cerebellum were explored in a knock-in mouse model of DYT1 dystonia using a combination of quantitative stereological assessments of the volumes of its major compartments, stereological and morphometric assessments of the numbers and morphologies of Purkinje cells (PCs), granule cells (GCs), and neurons of the deep cerebellar nuclei (DCN). The fine structure of PCs in Golgi stains was also examined by detailed morphometric evaluations. The results demonstrate multiple microstructural defects similar to those reported for neurons of the basal ganglia (Song et al., 2013). The results imply that mutations in torsinA have broad consequences for neuronal structure and function, and they raise questions regarding which of consequences may be most relevant for the expression of abnormal movement in DYT1 dystonia.
Materials & Methods
Animals
All experiments were carried out with approval of the Institutional Animal Care and Use Committee at Emory University. Heterozygous DYT1(ΔE) mutant knock-in mice (Goodchild et al., 2005) were maintained congenically through crosses with the C57BL/6J strain (Jackson Laboratories, Bar Harbor ME) and genotyped using a primer pair for the 34 base pair loxP site in the DYT1 mutant as described previously (Song et al., 2013). All mice were housed on a 12 hr light/dark cycle with food and water ad libitum and used at 3 months of age.
Stereological studies
Six DYT1 mutants (3 males and 3 females) and six controls (3 males and 3 females) were randomly selected from the breeding colony and used for quantitative stereological studies. After anesthetizing the mice with 2,2,2-tribromoethanol, they were perfused transcardially with a rinse solution consisting of 137 mM NaCl, 22.2 mM dextrose, 23.4 mM sucrose, 2 mM CaCl2 and 1.6 mM sodium cacodylate at pH 7.2. They then received 4% paraformaldehyde fix solution containing 117 mM sucrose and 67 mM sodium cacodylate at pH 7.2. The brain was removed from the skull and post-fixed with 4% paraformaldehyde for 16 hrs, and then stored in 67 mM sodium cacodylate. The brains were embedded within a gelatin matrix using the Multibrain process (Neuroscience Associates, Knoxville TN), and serial coronal sections were cut at 40 μm through the entire cerebellum. Every sixth section at 240 μm intervals was thionin-stained for Nissl substance, yielding ~15 sections for each mouse.
All quantitative studies were conducted by a microscopist blinded to genotype. Sections were examined under an Olympus BX51 light microscope (Melville NY) with a motorized stage (MAC5000, Ludl Electronic Products, Hawthorne NY) controlled by a computer with StereoInvestigator software (MicroBrightField, Willston VT). The size (volume) of the cerebellum was estimated using the Cavalieri method with a virtual grid spaced at 100 μm across the regions of interest each section and a 4x objective. For this analysis separate measures were taken for the cerebellar granular cell layer (GCL), molecular cell layer (MCL) and cerebellar white matter (WM). The flocculus and paraflocculus were excluded because these regions often were stretched or torn during removal from the skull.
To count GCs, the entire GCL was outlined with a 10x objective, and the cells were counted at 100x using the optical fractionator method with a 12 μm depth and 1 μm top guard zone. The virtual frame size for GC counting was 8 × 8 μm in a grid size of 500 × 1450 μm. To count neurons in the DCN, the entire area was outlined with a 10x objective, and the cells were counted at 60x using the optical fractionator method with a 12 μm depth and 1 μm top guard zone. The virtual frame size was 80 × 80 μm in a grid size of 250 × 250 μm. All stereological measures yielded a Gundersen coefficient error of <0.1.
The total numbers of PCs also were estimated. Because of their laminar layout, systematic random sampling methods typical of stereological studies were not applied. Instead, all PCs were counted at two different levels at approximately −5.8 mm and −6.8 mm from bregma in the anterior-posterior (AP) direction according to the mouse brain atlas (Paxinos and Franklin, 2001). For sections where the PC layer appeared more than one cell thick because of a tangential plane of section, only PCs in direct contact with the MCL were counted. The length of the PC layer counted also was traced, and the numbers of PCs were divided by length to estimate PC density (PCs/mm). Heterotopic PCs, defined as large cells with staining characteristics of typical PCs but completely surrounded by molecular layer on all sides, were counted separately at 20x through the entire cerebellum.
Golgi histochemistry
Brains from 6 DYT1 mutants (3 male and 3 female) and 6 controls (3 male and 3 female) were randomly selected from the breeding colony and processed with the FD Rapid Golgi Stain Kit (FD NeuroTechnologies, Baltimore MD) as described previously (Song et al., 2013). Briefly, mice were decapitated, and the brain was removed rapidly. The unfixed brain was immersed in solution A containing potassium dichromate and mercuric chloride, and solution B containing potassium chromate for 2 weeks in the dark. The brains then were placed in sucrose for 48 hrs at 4°C, and frozen-sectioned in the sagittal plane at 100 μm using a Microm HM440E sliding microtome (Microm, Waldorf, Germany). The sections were stained with a mixture consisting of solution D and E in distilled water for 15 min, and rinsed with distilled water 3 times. Sections were mounted on glass slides, dehydrated through graded alcohols, and cover-slipped with Permount.
Four PCs with complete staining of all dendrites near the mid-sagittal plane were chosen for each mouse (24 control neurons and 24 mutant neurons) for detailed analysis by a microscopist blinded to genotype. Each neuron was reconstructed by 3-dimensional digital tracing with NeuroLucida software (MicroBrightField, Williston VT) and a Wacom Intuos 2 digitizing tablet connected with an Olympus BX51 microscope and a 60x objective. Morphometric features of the cell soma and dendrites were determined by NeuroExplorer software version 10.21 as previously described (Mikolaenko et al., 2005; Song et al., 2013). Dendrite thicknesses, numbers and lengths were measured according to branch order. Branch order was defined as previously described (Mikolaenko et al., 2005; Song et al., 2013) with the first dendrites arising directly from the soma defined as the first branch, and each branch point marking a successively higher order. For dendritic spines, twenty distal dendrites with length >10 μm were selected at random for each neuron, and dendritic spines were counted at 100x. For counting, spines were defined as any discrete protrusion visibly connected to a dendrite (Mikolaenko et al., 2005; Song et al., 2013). The total spines were divided by the dendrite lengths and presented as a spine density (spines/μm).
Statistical analysis
All of the data are presented as mean ± SEM. For stereological measurements and PC density, the data were examined by Analysis of Variance (ANOVA) with genotype and sex as potential explanatory variables. For morphometric data in Golgi histochemistry, 24 control and 24 mutant PCs were examined by ANOVA with genotype and sex as explanatory variables, and branch order was treated as a repeated measurement. The numbers of heterotopic PCs were examined by Kruskal-Wallis tests for non-parametric data because of their small numbers. For all analyses, statistical significance was defined as p<0.05.
Results
Gross cerebellar morphology
In keeping with prior studies of other DYT1 mouse models (Oleas et al., 2013), there were no obvious defects in the overall structure of the cerebellum, or the laminar arrangement of the GCL, MCL, or PC layer (Figures 1). However, more precise evaluations of the different cerebellar compartments using stereological volumetric measures suggested subtle enlargement of the cerebellum in the mutants. The data for regional volumes were examined by ANOVA with genotype, sex, and compartment (layer) as explanatory variables. There were significant main effects of genotype (F=10.0; p<0.01) and compartment (F=4357.5; p<0.01), but not for sex (F=1.9; p>0.10). There was a significant interaction between genotype and compartment (F=3.3; p<0.05), but no interaction between genotype and sex (F=0.1; p>0.10). The total volume of the cerebellum including GCL, MCL and DCN was slightly increased in the mutants, and post-hoc tests suggested a 5% increase specifically of the GCL volume (p<0.05, Figure 1E). Combining volumes across sex, total cerebellar volume was 18.36 ± 0.23 mm3 in controls and 19.05 ± 0.13 mm3 in mutants. For the individual compartments, the GCL volume was 7.56 ± 0.10 mm3 in controls vs. 7.91 ± 0.10 mm3 in mutants, the MCL was 7.49 ± 0.15 mm3 in controls vs. 7.84 ± 0.10 mm3 in mutants, the DCN was 0.60 ± 0.01 mm3 in controls vs. 0.62 ± 0.02 mm3 in mutants, and the WM was 2.71 ± 0.07 mm3 in controls vs. 2.68 ± 0.07 mm3 in mutants.
Figure 1.

Gross cerebellar structure. No obvious abnormalities were found in Nissl stains of the cerebellum hemispheres between controls (A) and mutants (B). The distribution of deep cerebellar nucleus (DCN) neurons was not different between controls (C) and mutants (D). However, stereological measures of tissue volumes revealed mutants (white bars) to have 4% higher total cerebellar volumes and more specifically 5% higher granular cell layer compared to controls (black bars) (E–F). There were no significant increases in the volumes of the molecular cell layer (MCL), white matter (WM) or DCN. All data represent average values ± SEM, and asterisks denote statistical significance at p<0.05.
DCN neurons
DCN neurons receive inhibitory inputs from PCs and excitatory inputs from mossy fiber and climbing fibers, and are the major source of output from the cerebellum. They were examined because of imaging studies suggesting abnormalities of cerebellar outflow pathways in human DYT1 dystonia and DYT1 knock-in mice (Argyelan et al., 2009; Ulug et al., 2011). No obvious abnormalities were found in the morphological features of mutant DCN or neurons in Nissl stains (Figure 2A–B). Stereological measures revealed similar numbers of total DCN neurons in mutants (15779 ± 700 cells) compared with controls (16923 ± 601 cells) (Figure 2C). ANOVA showed no main effects of genotype (F=1.63; p>0.10) or sex (F=0.29; p>0.10) and no interaction between genotype and sex (F=0.53; p>0.10). The volume of DCN neurons was 0.603 ± 0.013 mm3 in controls and 0.617 ± 0.019 mm3 in mutants, but the difference was not significant (F=0.5; p>0.10). The results suggest no apparent structural abnormality of the DCN in the DYT1 mutant mice.
Figure 2.
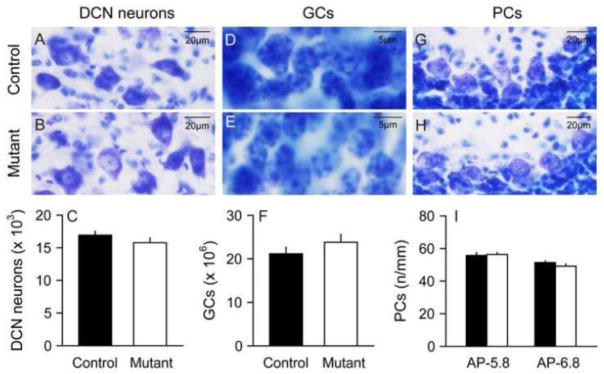
Deep cerebellar nucleus neurons, granule cells and Purkinje cells. Deep cerebellar nucleus (DCN) neurons had similar morphologies in control (A) and mutant mice (B), and stereological counting revealed similar total numbers of DCN neurons in normal and mutant mice (C). Granule cells (GCs) also had similar morphologies in normal (D) and mutant (E) mice, and stereological studies revealed similar total numbers of GCs in normal and mutant mice (F). Purkinje cells (PCs) also had similar morphologies in normal (G) and mutant mice (H), and their linear density was similar in normal and mutant mice (I). In each graph, average results for control mice are shown with black bars and mutants with white bars. The error bars show standard error of the mean.
GCs
GCs are the most numerous type of neuron in the entire brain. They were examined because of stereological results above suggesting an increase in the volume of the GCL. There were no obvious morphological abnormalities of GCs in Nissl stains (Figure 2D–E). Stereological counts of cells revealed a trend for increased GCs in mutants (23,837,563 ± 1,772,047) compared with controls (21,160,641 ± 1,509,827) but the difference was not statistically significant (Figure 2F). ANOVA showed no main effects of genotype (F=2.0; p>0.10) or sex (F=4.9; p>0.10) and no interaction between genotype and sex (F=0.01; p>0.10).
PCs
The PCs of the cerebellum play a major role in integrating inputs to the cerebellum and are the sole source of output from the cerebellar cortex. These neurons were explored in detail because of multiple studies suggesting abnormal function or morphology of PCs in different types of dystonia (Neychev et al., 2008; Pizoli et al., 2002; Prudente et al., 2012; Raike et al., 2012). In keeping with prior studies, there were no obvious abnormalities in the layout or general appearance of these neurons in Nissl stains (Figures 2G–H). PCs were counted at two levels (AP −5.8 mm and AP −6.8 mm), and the results examined by ANOVA with genotype, sex and AP level as explanatory variables. For total counted PCs, there was a significant main effect of level (F=6.4; p<0.05) with 8% more cells at AP −5.8 than AP −6.8. However, there were no main effects of genotype (F= 0.2; p>0.10) or sex (F= 2.4; p>0.10). There were no interactions between genotype and sex (F= 0.01; p>0.10) or genotype and level (F= 0.01; p>0.10). Combining PCs across sex and section levels, there were 1330 ± 28 PCs in controls and 1349 ± 36 PCs in mutants. For total PC layer length measured, there were no main effects of genotype (F= 1.4; p>0.10), sex (F= 0.07; p>0.10), or level (F= 1.5; p>0.10). There were no interactions between genotype and sex (F= 0.1; p>0.10) or genotype and level (F= 1.2; p>0.10). Combining cells across sex and section levels, the total PC layer length examined was 24.9 ± 0.4 mm in controls and 25.6 ±0.5 mm in mutants.
When PC density was examined by dividing PC counts by total PC layer length, there were no main effects of genotype (F=0.6; p>0.10), sex (F=2.3; p>0.10), or level (F=0.5; p>0.10). There were no interactions between genotype and sex (F=1.8; p>0.10) or genotype and level (F=0.6; p>0.10). Combining PC density across sex and section levels, there were 53.6 ± 1.2 cells/mm in controls vs. 52.7 ± 1.4 cells/mm in mutants (Figure 2I). These results suggest no obvious change in PC numbers or densities in the DYT1 mutants.
Heterotopic PCs
Heterotopic PCs are neurons that are abnormally displaced into the MCL from their normal location between the MCL and GCL (Figure 3A). They were quantified because they are seen in a number of neurodevelopmental and neurodegenerative diseases (Gomez et al., 1997; Nakamura et al., 1999; Yamada et al., 2008). Since heterotopic PCs are sparse, they were counted in all sections from each cerebellum, with approximately 15 sections per mouse. There were 33% more heterotopic PCs in mutants (25.0 ± 2.6) compared to controls (18.8 ± 2.0), a difference that was statistically significant by the Kruskal-Wallis test for non-parametric measures (Figure 3B; p<0.05). Heterotopic PCs appeared to be more frequent in the caudal cerebellum compared to the anterior cerebellum (Figure 3C–D), although there were too few for rigorous statistical comparisons.
Figure 3.

Heterotopic Purkinje cells. Heterotopic Purkinje cells (PCs) were seen rarely in both normal and mutant mice (A, black arrow). The average number of heterotopic PCs (± SEM) was 33% higher in mutants (white bar) compared to controls (black bar) (B). Panels C and D show a 3-dimensional reconstruction of representative heterotopic PCs of controls and mutants, respectively, with X, Y and Z axes indicating medio-lateral, ventro-dorsal and anterio-caudal directions, respectively, and the pictures are a left-view of heterotopic cells (red) on 15 coronal sections marked for granular cell layer and molecular cell layer (yellow) and white matter (white). There was a trend that DYT1 mutants have the heterotopic cells distributed more in caudal cerebellum. Asterisk denotes statistical significance at p<0.05.
Fine structure of PCs in Golgi histochemistry
In keeping with prior studies, PCs had large soma and extensive dendritic trees with considerable variation from cell to cell (Figure 4). This variation made it difficult to identify any obvious differences between mutant and normal mice. To obtain more precise measures, 24 mutant and 24 normal PCs randomly selected in the midsaggital plane were digitally reconstructed by a microscopist blinded to genotype (Figure 4). PC soma sizes were estimated by calculating total soma areas and perimeters from the digital traces. ANOVA with genotype and sex as potentially explanatory variables revealed no significant main effect of genotype for area (F=0.8; p>0.10) or perimeter (F=1.4; p>0.10). There also were no significant effects for sex on area (F=0.2; p>0.10) or perimeter (F=0.01; p>0.10). There were no interactions between genotype and sex for area (F=0.4; p>0.10) or perimeter (F=0.6; p>0.10). Combining data across sex, soma area was 446.4 ± 20.0 μm2 in controls vs. 421.8 ± 20.1 μm2 in mutants. Soma perimeter was 80.5 ± 1.8 μm in controls vs. 77.5 ± 1.9 μm in mutants.
Figure 4.

Golgi histochemistry of Purkinje cells. The morphology of Purkinje cells (PCs) in Golgi stains was variable in both controls (A–C) and DYT1 mutants (G–I). The varied structures were more obvious in 3-dimensional digital tracings of controls (D–F) and DYT1 mutants (J–L). In both groups of mice some PCs had a single major dendrite, while others had two or more. There were no overt structural differences between control and mutant mice.
Although PCs had normal soma sizes and perimeters in the DYT1 mutants, digital reconstructions revealed subtle abnormalities among the dendritic trees (Figure 5). Morphometric parameters (dendrite thickness, dendrite numbers and dendrite lengths) were examined by ANOVA with genotype and sex as explanatory variables, with branch order as a repeated measure. For dendrite thickness (Figure 5A), ANOVA revealed main effects for genotype (F=4.7; p<0.05) and branch order (F=221.2; p<0.01), but not for sex (F=1.2; p>0.10). There were no interactions between genotype and branch order (F=0.4; p>0.10) or genotype and sex (F=0.5; p>0.10). For dendrite number (Figure 5B), the effect for genotype showed a borderline trend for statistical significance (F=2.9; p=0.09). The effect of branch order was highly significant (F=121.9; p<0.01), but the effect of sex was not (F=1.9; p>0.10). There were significant interactions between genotype and branch order (F=3.0; p<0.05), but no interactions between genotype and sex (F=0.3; p>0.10). Post-hoc tests revealed fewer dendrites in the mutants compared to controls for branch orders 13–17 (p<0.05). For total dendritic lengths (Figure 5C), ANOVA revealed significant main effects for branch order (F=102.8; p<0.01) and a trend of borderline significance for genotype (F=3.4; p=0.07) and sex (F=3.9; p=0.05). There were significant interactions between genotype and branch order (F=3.0; p<0.05), but no interactions between genotype and sex (F=0.4; p>0.10). Post-hoc tests revealed shorter total dendrite lengths for branch orders 13–17 (p<0.05), corresponding to the same selves where fewer dendrites were found. When dendritic lengths were normalized to dendritic numbers by calculating mean dendritic lengths for each branch order (Figure 5D), ANOVA revealed significant main effects of branch order (F=57.6; p<0.01), but not for genotype (F=0.07; p>0.10) or sex (F=0.3; p>0.10). There were no interactions between genotype and branch order (F=1.5; p>0.10) or genotype and sex (F=0.04; p>0.10). These results imply that reduced dendritic lengths might be explained by the loss of dendrite numbers, rather than shorter dendrites at branch orders 13–17.
Figure 5.

Dendritic structure of Purkinje cells. Dendritic structure was evaluated according to branch order for both normal (closed circles) and DYT1 mutant mice (open circles). Data represent average values ± SEM for 24 PCs from controls and 24 PCs from mutants. Mutant PC dendrites were generally thinner regardless of branch order (A). There were fewer dendrites at branch orders 13–17 in mutant PCs compared to controls (B). Total dendrite lengths also were shorter at branch orders 13–17 in mutant PCs compared to controls (C), but the mean lengths of dendrites were not different between controls and mutants (D).
Dendritic spines are specialized protrusions from the surface of dendrites, and provide an important locus for synaptic inputs. They are dynamic structures that are modified through synaptic activity and various pathological states (Bonhoeffer and Yuste, 2002; Fiala et al., 2002), with morphology that varies from short stubby knobs to longer protrusions with mushroomed or bifurcated ends. The spines of PCs are sparse among primary and secondary dendrites, but dense in distal dendrites. Dendritic spines of PCs were morphologically variable in both control and mutant mice, but spines in mutant PC appeared thinner and less complex (Figures 6A–D). Spines were counted for 20 distal dendrites randomly selected for each digitally reconstructed neuron, and normalized against total dendritic lengths to yield spine density in spines/μm. ANOVA revealed main effects of genotype (F=37.8; p<0.01) and sex, with 14% lower spine density in mutants compared to controls, and 5% lower spine density in females compared to males. However, there was no interaction between genotype and sex (F=0.8; p>0.10). Combining data across sex, spine density was 2.00 ± 0.03 spines/μm in controls and 1.76 ± 0.02 spines/μm in mutants. These morphometric studies suggest subtle alterations of PC dendrites and spines in the DYT1 mutant mice.
Figure 6.
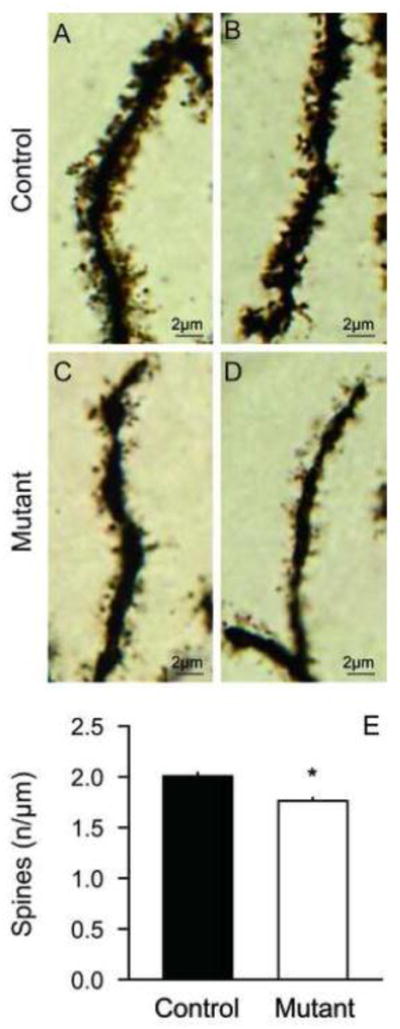
Dendritic spines of Purkinje cells. In Golgi stains, dendritic spines appeared denser and more complicated in control (A–B) compared to DYT1 mutant mice (C–D). The data in panel E show average spine densities ± SEM for 20 randomly selected distal dendrites from each of 24 control PCs (n=480 dendrites, black bar) and the same number of mutant PCs (n=480 dendrites, white bar). The density of dendritic spines was 12% reduced in DYT1 mutants. Asterisk denotes statistical significance at p<0.05.
Discussion
These analyses reveal subtle anatomical alterations in the cerebellum of a knock-in mouse model of DYT1 dystonia. The volume of cerebellum, especially the GCL, was increased in the mutant mice. There were no differences in the numbers of DCN neurons, GCs or PCs between the controls and mutants, but mutants had more heterotopic PCs. In addition, mutant PCs had thinner and fewer dendrites with fewer and less complex spines. These findings are consistent with prior studies showing that torsinA is expressed at high levels in most cerebellar neurons (Puglisi et al., 2013), and other studies implying metabolic and imaging abnormalities in this region in mouse models of DYT1 dystonia or affected humans. The results raise the possibility that anatomical abnormalities of the cerebellum may be related to the expression of dystonic movements.
Subtle histological changes associated with DYT1 dystonia
The current findings of subtle structural changes in the cerebellum in a DYT1 knock-in mouse model of dystonia are consistent with several other studies showing subtle structural changes in other regions of the DYT1 brain or its models. Although most histopathological studies of human DYT1 brains collected at autopsy show no obvious defects (Standaert, 2011), one study of 3 brains described ubiquitin-positive inclusions in brainstem neurons (McNaught et al., 2004). Brainstem ubiquitin-positive inclusions also have been found in different rodent models of DYT1 dystonia (Dang et al., 2005; Grundmann et al., 2007; Shashidharan et al., 2005). At the ultrastructural level, several investigators have reported “blebs” of the nuclear envelope in several brain regions in mouse or rat models of DYT1 dystonia (Goodchild et al., 2005; Grundmann et al., 2012; Grundmann et al., 2007). These subtle structural abnormalities have led to the suggestion that defects of the nuclear envelop play a role in the expression of dystonia, and that DYT1 dystonia should be considered among disorders of the nuclear envelope, or the “nuclear envelopathies”.
Another subtle anatomical finding has been slight enlargement of dopaminergic neurons of the substantia nigra for both humans with DYT1 dystonia (Rostasy et al., 2003) and a knock-in mouse model (Song et al., 2012). A recent study described multiple subtle structural abnormalities in the striatum of a DYT1 knock-in mouse model including enlarged cholinergic and parvalbumin-positive interneurons, and a reduction in dendritic complexity and spines among GABAergic medium spiny projection neurons (Song et al., 2013). Additionally, a diffusion tension imaging study implied abnormal connections between the cerebellum and thalalmus (Ulug et al., 2011). Some of the subtle structural features examined in the current studies were also examined in a prior study of another DYT1 mouse model (Zhang et al., 2011). However, the anatomical assessments in this prior study were limited to measurements of the proximal dendrite of Purkinje cells and dendritic spines at the fourth branch order of these neurons in Golgi-stained material. While the more detailed results of the current study cannot be directly compared to this the study because of multiple methodological differences, it is interesting to note that shorter proximal dendrites and fewer spines were found in both studies. Other studies have shown abnormal neurite outgrown in culture models of DYT1 dystonia (Hewett et al., 2006). Taken together, all of these anatomical findings support suggestions that the expression of motor dysfunction in DYT1 dystonia is related to abnormal neuronal signaling, and that it may be considered a “synaptopathy” rather than a “nuclear envelopathy” (Granata et al., 2009; Warner et al., 2010).
In addition to subtle defects in the nuclear envelope, neuronal soma, dendrites and spines, the increase in heterotopic PCs suggests that abnormal locations of neurons may also occur. Heterotopic PCs are not specific to DYT1 dystonia, since they have been observed in other neurodevelopmental and degenerative disorders (Gomez et al., 1997; Kuo et al., 2011; Nakamura et al., 1999; Yamada et al., 2008). A subtle redistribution of subpopulations of striatal neurons also was observed in a prior study of the DYT1 mouse model studied here,(Song et al., 2013) and defects in neuronal migration have been described for a DYT1 knockout model (McCarthy et al., 2012). How these many subtle anatomical abnormalities in different cellular compartments and brain regions may be related to each other remains to be established. However, the finding of structural abnormalities, even subtle ones, helps to provide clues to the cellular and regional defects responsible for DYT1 dystonia. Subtle structural anomalies appear to exist in different cellular compartments for human DYT1 dystonia or its animal models in the brainstem, midbrain, striatum, and cerebellum. The current findings add to the list of subtle structural alterations that may be caused by abnormal torsinA.
The numerous subtle structural abnormalities are not surprising, given the apparent role of torsinA in numerous different cellular processes and widespread expression in the brain (Augood et al., 1999; Konakova et al., 2001; Konakova and Pulst, 2001; Shashidharan et al., 2000; Xiao et al., 2004). As summarized in several recent reviews (Granata et al., 2009; Tanabe et al., 2009), torsinA is thought to function as a molecular chaperone, participating in the folding and translocation of various proteins in different cellular compartments. It interacts with numerous proteins, with consequences in the nuclear envelope, endoplasmic reticulum, neurites, and synapse. These functions may translate into subtle structural abnormalities such as abnormal cell sizes or changes in neurites or their spinous processes. Further work is needed to decipher which cellular compartment and brain regions are most relevant for causing dystonia.
Relevance to imaging studies of DYT1 dystonia
The histological studies also are relevant to understanding results of prior imaging studies of human DYT1 dystonia. Although there are no overt structural defects in routine clinical imaging studies, one voxel-based morphometric study of DYT1 dystonia suggested reduced volumes of the striatum (Draganski et al., 2009). Additionally, numerous functional imaging studies have revealed abnormalities in several brain regions. Studies of regional blood flow or regional metabolic activity via positron-emission tomography have revealed abnormalities in several cortical areas, striatum, and cerebellum (Carbon et al., 2010; Carbon et al., 2008; Carbon et al., 2004; Detante et al., 2004; Eidelberg et al., 1998). Finally, a diffusion tensor imaging study suggested abnormal connectivity in pathways connecting cerebellum, thalamus and cortex (Argyelan et al., 2009).
While these human imaging studies imply that some subtle structural defects may occur in the human DYT1 brain, obtaining histological evidence defining the exact defects in the human brain has been elusive. Human autopsy specimens are difficult to obtain, because the disorder is very rare. Additionally, the types of abnormalities so far uncovered in animal models require methods that are not usually applied to human brains. For example, subtle changes in neuronal sizes will require quantitative comparisons of DYT1 brains with appropriately matched controls using rigorous stereological or morphometric measurements. Subtle changes in dendrites or spines require special histological methods, such as Golgi histochemistry, which are rarely applied to human specimens. Nevertheless, the results from animals point to the types of abnormalities that may have to be examined to obtain a more complete understanding of the histological basis for the imaging abnormalities reported.
Structure and function in DYT1 dystonia
Although multiple subtle structural abnormalities have been described for DYT1 dystonia, their functional consequences remain unclear. Some of these changes may reflect pathological consequences of mutant torsinA, some may reflect compensatory adaptive changes, and others may be inconsequential. Considering that PC dendrites and spines are a critical locus for integrating inputs into the cerebellar cortex and determining PC output, it seems likely that a loss of dendrites and spines would be associated with altered cerebellar signaling. Thus structural defects among PC dendrites and spines could cause abnormal cerebellar signaling and abnormalities in motor control. On the other hand, dendrites and spines are highly plastic even in the normal brain, with dramatic adaptive changes in response to many normal physiological inputs. Thus structural abnormalities among PC dendrites may also be an adaptive change that reflects a pathological process in some distant brain region.
For DYT1 dystonia, there are numerous physiological studies demonstrating abnormal cortico-striatal signaling (Calabresi et al., 1997; Centonze et al., 2003; Martella et al., 2009; Pisani et al., 2006; Sciamanna et al., 2012a; Sciamanna et al., 2012b), but there are no similar studies addressing cerebellar signaling. However, several studies of other animal models of dystonia have demonstrated an important causal role for abnormal cerebellar signaling. Dystonic movements in the Dt mutant rat are associated with abnormal cerebellar signaling, and surgical removal of the cerebellum or selective destruction of the DCN eliminates their dystonic movements (LeDoux et al., 1998; LeDoux et al., 1993; LeDoux et al., 1995). Dystonic movements in the tottering mouse model of paroxysmal dystonia also are associated with abnormal cerebellar signaling (Chen et al., 2009), and surgical removal of the cerebellum or selective elimination of PCs also eliminates their dystonic movements (Campbell et al., 1999; Neychev et al., 2008; Raike et al., 2012; Shirley et al., 2008). Dystonic movements can even be elicited in normal rodents by local disruption of cerebellar signaling (Alvarez-Fischer et al., 2012; Pizoli et al., 2002; Raike et al., 2012), an effect that seems to be mediated by glutamate receptors (Fan et al., 2012). Electrophysiological studies of the cerebellum are clearly needed in DYT1 models to determine if the histological abnormalities are associated with aberrant cerebellar signaling, and delineating which of the many structural and functional alterations is most relevant for causing abnormal movements is an important challenge for future research.
Highlights.
Cerebellum was slightly enlarged in a mouse model of DYT1 dystonia.
Number of granule cells or neurons of the deep nuclei was normal in the mutants.
Number of Purkinje neurons was also normal in the mutants.
Mutant Purkinje neurons had thinner dendrites, and fewer and less complex spines.
Heterotopic Purkinje neurons were detected more in the mutants.
Acknowledgments
We thank Dr. William Dauer for making the DYT1 knock-in mice available for these studies. This work was supported in part by The Dystonia Medical Research Foundation, NIH grants NS040470 and NS033592.
Abbreviations
- ΔE
deletion of a single GAG codon in Tor1A gene
- GC
granule cell
- GCL
granule cell layer
- MCL
molecular cell layer
- WM
white matter
- DCN
deep cerebellar nuclei
- PC
Purkinje cell
- AP
region from bregma in the anterior-posterior direction
Footnotes
Publisher's Disclaimer: This is a PDF file of an unedited manuscript that has been accepted for publication. As a service to our customers we are providing this early version of the manuscript. The manuscript will undergo copyediting, typesetting, and review of the resulting proof before it is published in its final citable form. Please note that during the production process errors may be discovered which could affect the content, and all legal disclaimers that apply to the journal pertain.
Bibliography
- Albanese A, et al. Phenomenology and classification of dystonia: A consensus update. Mov Disord. 2013;28:863–873. doi: 10.1002/mds.25475. [DOI] [PMC free article] [PubMed] [Google Scholar]
- Alvarez-Fischer D, et al. Prolonged generalized dystonia after chronic cerebellar application of kainic acid. Brain Res. 2012;1464:82–88. doi: 10.1016/j.brainres.2012.05.007. [DOI] [PubMed] [Google Scholar]
- Argyelan M, et al. Cerebellothalamocortical connectivity regulates penetrance in dystonia. J Neurosci. 2009;29:9740–7. doi: 10.1523/JNEUROSCI.2300-09.2009. [DOI] [PMC free article] [PubMed] [Google Scholar]
- Augood SJ, et al. Distribution of the mRNAs encoding torsinA and torsinB in the normal adult human brain. Ann Neurol. 1999;46:761–9. [PubMed] [Google Scholar]
- Avanzino L, Abbruzzese G. How does the cerebellum contribute to the pathophysiology of dystonia. Basal Ganglia. 2012;2:231–235. [Google Scholar]
- Bonhoeffer T, Yuste R. Spine motility: phenomenology, mechanisms, and function. Neuron. 2002;35:1019–1027. doi: 10.1016/s0896-6273(02)00906-6. [DOI] [PubMed] [Google Scholar]
- Calabresi P, et al. Endogenous adenosine mediates the presynaptic inhibition induced by aglycemia at corticostriatal synapses. J Neurosci. 1997;17:4509–4516. doi: 10.1523/JNEUROSCI.17-12-04509.1997. [DOI] [PMC free article] [PubMed] [Google Scholar]
- Campbell DB, et al. Tottering mouse motor dysfunction is abolished on the Purkinje cell degeneration (pcd) mutant background. Exp Neurol. 1999;160:268–278. doi: 10.1006/exnr.1999.7171. [DOI] [PubMed] [Google Scholar]
- Carbon M, et al. Increased sensorimotor network activity in DYT1 dystonia: a functional imaging study. Brain. 2010;133:690–700. doi: 10.1093/brain/awq017. [DOI] [PMC free article] [PubMed] [Google Scholar]
- Carbon M, et al. Increased cerebellar activation during sequence learning in DYT1 carriers: an equiperformance study. Brain. 2008;131:146–154. doi: 10.1093/brain/awm243. [DOI] [PMC free article] [PubMed] [Google Scholar]
- Carbon M, et al. Regional metabolism in primary torsion dystonia: effects of penetrance and genotype. Neurology. 2004;62:1384–90. doi: 10.1212/01.wnl.0000120541.97467.fe. [DOI] [PubMed] [Google Scholar]
- Centonze D, et al. Distinct roles of D1 and D5 dopamine receptors in motor activity and striatal synaptic plasticity. J Neurosci. 2003;23:8506–8512. doi: 10.1523/JNEUROSCI.23-24-08506.2003. [DOI] [PMC free article] [PubMed] [Google Scholar]
- Chen G, et al. Low-frequency oscillations in the cerebellar cortex of the tottering mouse. J Neurophysiol. 2009;101:234–45. doi: 10.1152/jn.90829.2008. [DOI] [PMC free article] [PubMed] [Google Scholar]
- Dang MT, et al. Generation and characterization of Dyt1 deltaGAG knock-in mouse as a model for early-onset dystonia. Exp Neurol. 2005;196:452–463. doi: 10.1016/j.expneurol.2005.08.025. [DOI] [PubMed] [Google Scholar]
- Detante O, et al. Globus pallidus internus stimulation in primary generalized dystonia: A H215O PET study. Brain. 2004;127:1899–1908. doi: 10.1093/brain/awh213. [DOI] [PubMed] [Google Scholar]
- Draganski B, et al. Genotype-phenotype interactions in primary dystonias revealed by differential changes in brain structure. Neuroimage. 2009;47:1141–7. doi: 10.1016/j.neuroimage.2009.03.057. [DOI] [PMC free article] [PubMed] [Google Scholar]
- Eidelberg D, et al. Functional brain networks in DYT1 dystonia. Ann Neurol. 1998;44:303–312. doi: 10.1002/ana.410440304. [DOI] [PubMed] [Google Scholar]
- Fan X, et al. Selective and sustained alpha-amino-3-hydroxy-5-methyl-4-isoxazolepropionic acid receptor activation in cerebellum induces dystonia in mice. J Pharmacol Exp Ther. 2012;340:733–41. doi: 10.1124/jpet.111.190082. [DOI] [PMC free article] [PubMed] [Google Scholar]
- Fiala JC, et al. Dendritic spine pathology: cause or consequence of neurological disorders. Brain Res Rev. 2002;39:29–54. doi: 10.1016/s0165-0173(02)00158-3. [DOI] [PubMed] [Google Scholar]
- Filip P, et al. Dystonia and the cerebellum: A new field of interest in movement disorders? Clin Neurophysiol. 2013;124:1269–1274. doi: 10.1016/j.clinph.2013.01.003. [DOI] [PubMed] [Google Scholar]
- Fung VS, et al. Assessment of the patient with dystonia: An update on dystonia syndromes. Mov Disord. 2013;28:889–898. doi: 10.1002/mds.25549. [DOI] [PMC free article] [PubMed] [Google Scholar]
- Gomez CM, et al. Spinocerebellar ataxia type 6: gaze-evoked and vertical nystagmus, Purkinje cell degeneration, and variable age of onset. Ann Neurol. 1997;42:933–50. doi: 10.1002/ana.410420616. [DOI] [PubMed] [Google Scholar]
- Goodchild RE, et al. Loss of the dystonia-associated protein torsinA selectively disrupts the neuronal nuclear envelope. Neuron. 2005;48:923–932. doi: 10.1016/j.neuron.2005.11.010. [DOI] [PubMed] [Google Scholar]
- Granata A, et al. TorsinA and dystonia: from nuclear envelope to synapse. J Neurochem. 2009;109:1596–1609. doi: 10.1111/j.1471-4159.2009.06095.x. [DOI] [PubMed] [Google Scholar]
- Grundmann K, et al. Generation of a novel rodent model for DYT1 dystonia. Neurobiol Dis. 2012;47:61–74. doi: 10.1016/j.nbd.2012.03.024. [DOI] [PubMed] [Google Scholar]
- Grundmann M, et al. Overexpression of human wildtype torsinA and human deltaGAG torsinA in a transgenic mouse model causes phenotypic abnormalities. Neurobiol Dis. 2007;27:190–206. doi: 10.1016/j.nbd.2007.04.015. [DOI] [PubMed] [Google Scholar]
- Hallett M. Pathophysiology of dystonia. J Neural Transm Suppl. 2006;70:485–488. doi: 10.1007/978-3-211-45295-0_72. [DOI] [PubMed] [Google Scholar]
- Hewett JW, et al. Dystonia-causing mutant torsinA inhibits cell adhesion and neurite extension through interference with cytoskeletal dynamics. Neurobiol Dis. 2006;22:98–111. doi: 10.1016/j.nbd.2005.10.012. [DOI] [PubMed] [Google Scholar]
- Konakova M, et al. Cellular distribution of torsin A and torsin B in normal human brain. Arch Neurol. 2001;58:921–7. doi: 10.1001/archneur.58.6.921. [DOI] [PubMed] [Google Scholar]
- Konakova M, Pulst SM. Immunocytochemical characterization of torsin proteins in mouse brain. Brain Res. 2001;922:1–8. doi: 10.1016/s0006-8993(01)03014-1. [DOI] [PubMed] [Google Scholar]
- Kuo SH, et al. Increased number of heterotopic Purkinje cells in essential tremor. J Neurol Neurosurg Psychiatry. 2011;82:1038–40. doi: 10.1136/jnnp.2010.213330. [DOI] [PMC free article] [PubMed] [Google Scholar]
- LeDoux MS, et al. Single-unit activity of cerebellar nuclear cells in the awake genetically dystonic rat. Neurosci. 1998;86:533–545. doi: 10.1016/s0306-4522(98)00007-4. [DOI] [PubMed] [Google Scholar]
- LeDoux MS, et al. Cerebellectomy eliminates the motor syndrome of the genetically dystonic rat. Exp Neurol. 1993;120:302–310. doi: 10.1006/exnr.1993.1064. [DOI] [PubMed] [Google Scholar]
- LeDoux MS, et al. Selective elimination of cerebellar output in the genetically dystonic rat. Brain Res. 1995;697:91–103. doi: 10.1016/0006-8993(95)00792-o. [DOI] [PubMed] [Google Scholar]
- Martella G, et al. Impairment of bidirectional synaptic plasticity in the striatum of a mouse model of DYT1 dystonia: role of endogenous acetylcholine. Brain. 2009;132:2336–49. doi: 10.1093/brain/awp194. [DOI] [PMC free article] [PubMed] [Google Scholar]
- McCarthy DM, et al. Neurogenesis and neuronal migration in the forebrain of the TorsinA knockout mouse embryo. Dev Neurosci. 2012;34:366–78. doi: 10.1159/000342260. [DOI] [PMC free article] [PubMed] [Google Scholar]
- McNaught KS, et al. Brainstem pathology in DYT1 primary torsion dystonia. Ann Neurol. 2004;56:541–547. doi: 10.1002/ana.20225. [DOI] [PubMed] [Google Scholar]
- Mikolaenko I, et al. A Golgi study of neuronal architecture in a genetic mouse model for Lesch-Nyhan disease. Neurobiol Dis. 2005;20:479–490. doi: 10.1016/j.nbd.2005.04.005. [DOI] [PubMed] [Google Scholar]
- Mink JW. Abnormal circuit function in dystonia. Neurology. 2006;66:959. doi: 10.1212/01.wnl.0000215937.63781.9a. [DOI] [PubMed] [Google Scholar]
- Nakamura R, et al. An immunohistochemical study of Purkinje cells in a case of hereditary cerebellar cortical atrophy. Acta Neuropathol. 1999;97:196–200. doi: 10.1007/s004010050974. [DOI] [PubMed] [Google Scholar]
- Neychev V, et al. The basal ganglia and cerebellum interact in the expression of dystonic movement. Brain. 2008;131:2499–2509. doi: 10.1093/brain/awn168. [DOI] [PMC free article] [PubMed] [Google Scholar]
- Neychev VK, et al. The functional neuroanatomy of dystonia. Neurobiol Dis. 2011;42:185–201. doi: 10.1016/j.nbd.2011.01.026. [DOI] [PMC free article] [PubMed] [Google Scholar]
- Oleas J, et al. Engineering animal models for dystonia: What have we learned? Mov Disord. 2013;28:990–1000. doi: 10.1002/mds.25583. [DOI] [PMC free article] [PubMed] [Google Scholar]
- Ozelius LJ, et al. The early-onset torsion dystonia gene (DYT1) encodes an ATP-binding protein. Nature Genet. 1997;17:408. doi: 10.1038/ng0997-40. [DOI] [PubMed] [Google Scholar]
- Paxinos G, Franklin KBJ. The mouse brain in stereotaxic coordinates. Academic Press; San Diego: 2001. [Google Scholar]
- Perlmutter JS, Mink JW. Dysfunction of dopaminergic pathways in dystonia. Adv Neurol. 2004;94:163–170. [PubMed] [Google Scholar]
- Peterson DA, et al. Convergent evidence for abnormal striatal synaptic plasticity in dystonia. Neurobiol Dis. 2010;37:558–73. doi: 10.1016/j.nbd.2009.12.003. [DOI] [PMC free article] [PubMed] [Google Scholar]
- Pisani A, et al. Altered responses to dopaminergic D2 receptor activation and N-type calcium currents in striatal cholinergic interneurons in a mouse model of DYT1 dystonia. Neurobiol Dis. 2006;24:318–325. doi: 10.1016/j.nbd.2006.07.006. [DOI] [PubMed] [Google Scholar]
- Pizoli CE, et al. Abnormal cerebellar signaling induces dystonia in mice. J Neurosci. 2002;22:7825–7833. doi: 10.1523/JNEUROSCI.22-17-07825.2002. [DOI] [PMC free article] [PubMed] [Google Scholar]
- Prudente CN, et al. Neuropathology of cervical dystonia. Exp Neurol. 2012;241:95–104. doi: 10.1016/j.expneurol.2012.11.019. [DOI] [PMC free article] [PubMed] [Google Scholar]
- Puglisi F, et al. Torsin A Localization in the mouse cerebellar synaptic circuitry. PLOS One. 2013;8:e6803. doi: 10.1371/journal.pone.0068063. [DOI] [PMC free article] [PubMed] [Google Scholar]
- Raike RS, et al. Limited regional cerebellar dysfunction induces focal dystonia in mice. Neurobiol Dis. 2012;49:200–210. doi: 10.1016/j.nbd.2012.07.019. [DOI] [PMC free article] [PubMed] [Google Scholar]
- Rostasy K, et al. TorsinA protein and neuropathology in early onset generalized dystonia with GAG deletion. Neurobiol Dis. 2003;12:11–24. doi: 10.1016/s0969-9961(02)00010-4. [DOI] [PubMed] [Google Scholar]
- Sadnicka A, et al. The cerebellum in dystonia - Help or hindrance? Clin Neurophysiol. 2012;123:65–70. doi: 10.1016/j.clinph.2011.04.027. [DOI] [PubMed] [Google Scholar]
- Sciamanna G, et al. Cholinergic dysregulation produced by selective inactivation of the dystonia-associated protein torsinA. Neurobiol Dis. 2012a;47:416–27. doi: 10.1016/j.nbd.2012.04.015. [DOI] [PMC free article] [PubMed] [Google Scholar]
- Sciamanna G, et al. Cholinergic dysfunction alters synaptic integration between thalamostriatal and corticostriatal inputs in DYT1 dystonia. J Neurosci. 2012b;32:11991–2004. doi: 10.1523/JNEUROSCI.0041-12.2012. [DOI] [PMC free article] [PubMed] [Google Scholar]
- Shashidharan P, et al. Immunohistochemical localization and distribution of torsinA in normal human and rat brain. Brain Res. 2000;853:197–206. doi: 10.1016/s0006-8993(99)02232-5. [DOI] [PubMed] [Google Scholar]
- Shashidharan P, et al. Transgenic mouse model of early-onset dyt1 dystonia. Human Mol Genet. 2005;14:125–133. doi: 10.1093/hmg/ddi012. [DOI] [PubMed] [Google Scholar]
- Shirley TL, et al. Paroxysmal dyskinesias in mice. Mov Disord. 2008;23:259–264. doi: 10.1002/mds.21829. [DOI] [PMC free article] [PubMed] [Google Scholar]
- Song CH, et al. Subtle microstructural changes of the striatum in a DYT1 knock-in mouse model of dystonia. Neurobiol Dis. 2013;54:362–371. doi: 10.1016/j.nbd.2013.01.008. [DOI] [PMC free article] [PubMed] [Google Scholar]
- Song CH, et al. Functional analysis of dopaminergic systems in a DYT1 knock-in mouse model of dystonia. Neurobiol Dis. 2012;48:66–78. doi: 10.1016/j.nbd.2012.05.009. [DOI] [PMC free article] [PubMed] [Google Scholar]
- Standaert DG. Update on the pathology of dystonia. Neurobiol Dis. 2011;42:148–51. doi: 10.1016/j.nbd.2011.01.012. [DOI] [PMC free article] [PubMed] [Google Scholar]
- Tanabe LM, et al. Primary dystonia: molecules and mechanisms. Nat Rev Neurol. 2009;5:598–609. doi: 10.1038/nrneurol.2009.160. [DOI] [PMC free article] [PubMed] [Google Scholar]
- Ulug AM, et al. Cerebellothalamocortical pathway abnormalities in torsinA DYT1 knock-in mice. Proc Natl Acad Sci U S A. 2011;108:6638–43. doi: 10.1073/pnas.1016445108. [DOI] [PMC free article] [PubMed] [Google Scholar]
- Warner TT, et al. TorsinA and DYT1 dystonia: a synaptopathy? Biochem Soc Trans. 2010;38:452–6. doi: 10.1042/BST0380452. [DOI] [PubMed] [Google Scholar]
- Wichmann T. Commentary: Dopaminergic dysfunction in DYT1 dystonia. Exp Neurol. 2008;212:242–6. doi: 10.1016/j.expneurol.2008.04.020. [DOI] [PMC free article] [PubMed] [Google Scholar]
- Xiao J, et al. Developmental expression of rat torsinA transcript and protein. Brain Res Dev Brain Res. 2004;152:47–60. doi: 10.1016/j.devbrainres.2004.05.012. [DOI] [PubMed] [Google Scholar]
- Yamada M, et al. CAG repeat disorder models and human neuropathology: similarities and differences. Acta Neuropathol. 2008;115:71–86. doi: 10.1007/s00401-007-0287-5. [DOI] [PubMed] [Google Scholar]
- Zhang L, et al. Altered dendritic morphology of Purkinje cells in Dyt1 DeltaGAG knock-in and purkinje cell-specific Dyt1 conditional knockout mice. PLoS One. 2011;6:e18357. doi: 10.1371/journal.pone.0018357. [DOI] [PMC free article] [PubMed] [Google Scholar]
- Zhao Y, et al. The DYT1 carrier state increases energy demand in the olivocerebellar network. Neuroscience. 2011;177:183–94. doi: 10.1016/j.neuroscience.2011.01.015. [DOI] [PMC free article] [PubMed] [Google Scholar]
- Zoons E, et al. Structural, functional and molecular imaging of the brain in primary focal dystonia--a review. Neuroimage. 2011;56:1011–20. doi: 10.1016/j.neuroimage.2011.02.045. [DOI] [PubMed] [Google Scholar]