

Abstract
To identify genes that contribute to chemotherapy resistance in glioblastoma, we conducted a synthetic lethal screen in a chemotherapy-resistant glioblastoma derived cell line with the clinical alkylator temozolomide (TMZ) and an siRNA library tailored towards “druggable” targets. Select DNA repair genes in the screen were validated independently, confirming the DNA glycosylases UNG and MYH as well as MPG to be involved in the response to high dose TMZ. The involvement of UNG and MYH is likely the result of a TMZ-induced burst of reactive oxygen species. We then compared the human TMZ sensitizing genes identified in our screen with those previously identified from alkylator screens conducted in E. coli and S. cerevisiae. The conserved biological processes across all three species composes an Alkylation Functionome that includes many novel proteins not previously thought to impact alkylator resistance. This high-throughput screen, validation and cross-species analysis was then followed by a mechanistic analysis of two essential nodes: base excision repair (BER) DNA glycosylases (UNG, human and mag1, S. cerevisiae) and protein modification systems, including UBE3B and ICMT in human cells or pby1, lip22, stp22 and aim22 in S. cerevisiae. The conserved processes of BER and protein modification were dual targeted and yielded additive sensitization to alkylators in S. cerevisiae. In contrast, dual targeting of BER and protein modification genes in human cells did not increase sensitivity, suggesting an epistatic relationship. Importantly, these studies provide potential new targets to overcome alkylating agent resistance.
Keywords: Temozolomide, chemotherapy resistance, alkylation response, siRNA, DNA Repair
Introduction
Glioblastoma multiforme (GBM) is the most common and aggressive primary brain tumor (1). Temozolomide (TMZ), radiation and surgery are currently used for treatment of GBM, yet median survival is still less than 2 years (2-4). Chemotherapy resistance and difficulties in surgical removal contribute to poor prognosis (1). TMZ methylates several bases in DNA, including the O6 position of guanine (O6-MeG), the N7 position of guanine (N7-MeG) and the N3 position of adenine (N3-MeA). Two of the lesions (N7-MeG and N3-MeA) account for greater than 80% of the DNA lesions induced by TMZ, yet result in negligible clinical toxicity due to robust repair mechanisms. These lesions are predominantly repaired by the base excision repair (BER) pathway (5), initiated by one of eleven lesion specific DNA glycosylases (6).
Virtually all of TMZ’s clinical cytotoxicity is attributable to the O6-methylguanine (O6-MeG) lesion, which accounts for approximately 5% of TMZ induced lesions (7). The O6-MeG lesion is repaired via a direct reversal mechanism by the protein O6-methylguanine-DNA methyltransferase (MGMT), which transfers the O6-methyl group from the guanine base onto a Cys residue in the MGMT protein (8). If the O6-MeG lesion is not removed by MGMT, during cellular replication the mis-pairing of O6-MeG with thymine is detected by the mismatch repair enzymes, triggering apoptosis signaling and cytotoxicity (9). However, 5-year survival rates still remain low in TMZ treated patients (3, 4), and TMZ resistance and/or recurrence with chemotherapy resistant tumors is common. Resistant cells can harbor mutations in mismatch repair proteins such as mutS homolog 6 (MSH6) (10) or have elevated expression of MGMT (as in the T98G cell line) (11). Earlier endeavors to enhance TMZ efficacy by using MGMT inhibitors to prevent the repair of O6-MeG lesions have not shown an increase in sensitivity or efficacy in clinical trials (12), especially in TMZ-resistant GBM (13).
Because GBM tumors can be resistant to TMZ therapy and recurring tumors may acquire resistance to the O6-MeG lesion (14, 15), we explored novel mechanisms of TMZ resistance in tumor cells independent of the O6-MeG lesion. To discover genes that sensitize cells to TMZ, we undertook a synthetic lethal screen using Ambion’s Silencer® Human Druggable Genome siRNA library, the chemotherapeutic agent TMZ and the T98G cell line, a TMZ resistant cell line derived from a GBM tumor (16). We determined that several biological pathways were enriched for TMZ sensitizing genes, including proteins involved in BER, response to DNA damage, cellular proliferation, and protein modification. Many similar biological processes were also highly enriched in previous DNA alkylation screens performed in S. cerevisiae and E. coli (17, 18). We combined the selected hits from all three species and performed a functionome analysis to identify significantly enriched biological processes conserved across all three organisms (19). This allowed us to create a cross-species network representing the shared alkylation response from bacteria, yeast and humans and demonstrates an Alkylation Functionome that includes many novel proteins not previously thought to impact alkylation resistance. Our identification of evolutionarily conserved mechanisms affecting TMZ sensitivity suggests that although many proteins and processes impact sensitivity to alkylators, several critical survival pathways can be targeted to improve chemotherapy efficacy. Simultaneous inhibition of both DNA repair and protein modification processes in yeast yielded greater sensitivity to alkylating agents than inhibition of either process alone. However, knockdown of both protein modification and DNA repair genes did not have an increased effect on alkylation-induced toxicity in human cells. This potential epistatic interaction between the ubiquitin protein ligase E3B (UBE3B) and the DNA repair protein uracil-DNA glycosylase (UNG) suggests they may be in the same survival pathway. Importantly, the biological processes and corresponding genes identified in our functionome analysis represent novel potential drug targets to increase TMZ efficacy independent of O6-MeG mediated toxicity as well as potential epistatic relationships that would provide mechanistic insight into the function of specific activities.
Materials and methods
Chemicals and reagents
DharmaFECT 2 transfection reagent and the siGENOME Non-Targeting siRNA #1 were from Dharmacon (Lafayette, CO). CellTiter-Blue Cell Viability Assay and CellTiter 96 AQueous One Solution Cell Proliferation Assay were from Promega (Madison, WI). The Silencer Druggable Genome siRNA Library (Version 1.1) and 5x siRNA resuspension buffer were from Ambion (Austin, TX). Tissue culture-treated 384-well microtiter plates were from Greiner Bio-One (GmbH, Frickenhausen, Germany). OptiMEM, EMEM, phosphate buffered saline (PBS) and Hoechst 33342 were from InVitrogen (Carlsbad, CA). The shRNA vectors used for stable knockdown (KD) cell line creation were obtained as glycerol stocks from Sigma-Aldrich and the UPCI lentiviral core facility (http://www.upci.upmc.edu/vcf/lenti.cfm). Temozolomide was from the National Cancer Institute Developmental Therapeutics Program (Bethesda, MD). Puromycin was from Clontech Laboratories (Mountain View, CA) and gentamicin was obtained from Irvine Scientific (Santa Ana, CA). We used the following primary antibodies: UNG antibody (#MBS200056) was from MyBioSource (San Diego, CA) and PCNA antibody (#sc-56) was from Santa Cruz (Santa Cruz, CA). Secondary antibodies: GAM-HRP conjugates were from Bio-Rad (Hercules, CA). Signal generation substrates were from Bio-Rad (Hercules, CA) and Thermo Fisher Scientific (Waltham, MA). All electrophoresis reagents were from Bio-Rad (Hercules, CA).
Cell lines and culture conditions
Cell line and culture conditions were as previously described (20-22). Briefly, the T98G glioblasoma cell line was purchased from American Type Culture Collection (ATCC) (obtained in 2004) and cultured in EMEM with 10% heat-inactivated FBS, non-essential amino acids, sodium pyruvate, antibiotic/antimycotic and gentamicin (16). The LN428 cells were cultured in alpha MEM with 10% heat-inactivated FBS, antibiotic/antimycotic and gentamicin as we have described (23). The T98G cell line was tested for cross species contamination and authenticated by RADIL cell check services as of 11/16/2010 (after the completion of the siRNA screen). The genetic profile provided by RADIL was checked against the ATCC STR loci database to confirm the identity of the T98G cell line.
Pathway analysis and network visualization
Several different programs were used to analyze the hit list for pathway enrichment and network visualization, including NIH DAVID (DAVID), Princeton GO term finder and Ingenuity Pathway Analysis (IPA). DAVID and Princeton GO term finder both classify genes based on their gene ontology (GO) (24-26). Each gene is classified based on it’s molecular function, biological process, or cellular compartment and are referred to as “GO terms” (25). Enriched GO terms and their associated genes are more likely to be true hits because multiple genes affecting the same process all yield sensitization (24, 27). The gene enrichment calculations used the 5,520 genes screened as the background, due to the relatively small number of genes screened, instead of the entire human genome. The analysis with NIH DAVID was performed using multiple classification stringencies, gene ontology hierarchies, protein interaction databases and pathways. The hit list was also analyzed with IPA (Ingenuity® Systems, www.ingenuity.com), utilizing a proprietary, manually curated, interaction database. Because IPA utilizes a different scheme and algorithm to organize proteins into networks not based on GO terms, it was used as a distinct method to analyze the hit list for enriched protein functions and networks. The Functional Analysis identified the biological functions that were most significant to the data set. Right-tailed Fisher’s exact test was used to calculate a p-value determining the probability that each biological function assigned to that data set is due to chance alone. Fisher’s exact test was used with α = 0.05 to compute the probability of correct functional assignment for the genes in the hit list. The enriched networks created by IPA were visualized with genes serving as nodes and edges representing known interactions. Genes colored green modulate toxicity to alkylating agents as determined in the screen.
Generation of lentiviral knockdown cell lines
The shuttle vectors for expression of shRNA were from Sigma (St. Louis, MO). Lentiviruses were prepared in collaboration with the UPCI Lentiviral facility. Lentiviral particles were generated by co-transfection of 4 plasmids [the shuttle vector plus three packaging plasmids: pMD2.g(VSVG), pVSV-REV and PMDLg/pRRE] into 293-FT cells (28, 29) using FuGene 6 Transfection Reagent (Roche, Indianapolis, IN), as described previously (21). Lentiviral transduction was performed as described earlier (21). Briefly, 6.0 × 10⁴ cells were seeded into a 6-well plate 24 hours before transduction. Cells were transduced for 18 hours at 32°C and then cultured for 72 hours at 37°C. Cells were then selected by culturing in growth media with 1.0 μg/mL puromycin, as previously described (21). Stable LN428 glycosylase-KD cell lines are available from Trevigen, Inc (Gaithersburg, MD).
Quantitative RT-PCR analysis
Expression of mRNA for each of ten glycosylases and five protein modification genes (OGG1, SMUG1, MBD4, UNG, MYH, NTHL1, MPG, NEIL1, NEIL2, NEIL3, UBE3B, ICMT, B4GALT7, CHRM3, and PADI1) after shRNA-mediated knockdown was measured by quantitative RT-PCR (qRT-PCR) using an Applied Biosystems StepOnePlus system as described previously (21). Applied Biosystems TaqMan® Gene Expression Assays used are as follows: human OGG1: Hs00213454_m1; human SMUG1: Hs00204820_m1; human MBD4: Hs00187498_m1; human UNG: Hs00422172_m1; human MYH: Hs01014856_m1; human NTHL1: Hs00267385; human MPG: Hs01012594_m1; human NEIL1: Hs0022637_m1; human NEIL2: Hs00376746_m1; human NEIL3: Hs00217387_m1; human UBE3B: Hs00296200_m1; Human ICMT: Hs00202655_m1; Human B4GALT7: Hs01011258_m1; Human CHRM3: Hs00265216_s1; Human PADI1: Hs00203458_m1. Gene expression of each gene was normalized to the expression of human ß-actin (part #4333762T).
Cell extract preparation and immunoblot
Nuclear extracts were prepared and protein concentrations were determined as described previously (21). Fifteen micrograms of protein was loaded on a pre-cast 4-20% Tris-Glycine gel (InVitrogen, Carlsbad, CA). The following primary antibodies were used in immunoblot assays: anti-human UNG from MyBioSource.com (#MBS200056) and anti-human proliferating cell nuclear antigen (PCNA; Santa Cruz Biotechnology). Immunoblot membranes were stripped before re-probing for PCNA. The membranes were stripped with Restore PLUS Western Blot Stripping buffer (#46430) from Thermo Fisher Scientific (Waltham, MA) per the manufacturer’s instructions.
DNA glycosylase molecular beacon activity assay and data analysis
All oligodeoxyribonucleotides in the molecular beacon assay were purchased from Integrated DNA Technologies (Coralville, USA) including the following: FD-Con, 6-FAM-dGCACTATTGAATTGACACGCCATGTCGATCAATTCAATAGTGC-Dabcyl, where 6-FAM is carboxyfluorescein and Dabcyl is 4-(4’-dimethylaminophenylazo) benzoic acid; FD-UNG1, 6-FAM-dGCACTUAAGAATTGACACGCCATGTCGATCAATTCTTAAGTGC-Dabcyl, where U is 2’-deoxyuridine. All DNA glycosylase molecular beacon activity assay experiments and data analysis were done as previously described (22, 30). A more detailed description of the assay is also available (31).
Briefly, the molecular beacons form a stem-loop structure containing a 13-nucleotide loop and a 15 base pair stem forcing 6-FAM fluorophore at the 5’ end and the Dabcyl quencher at the 3’ end into close proximity. When in a stem-loop structure, the 6-FAM fluorescence is efficiently quenched by Dabcyl in a non-fluorescent manner via Förster Resonance Energy Transfer (FRET) (32, 33). However, if the uracil is removed by UNG and the DNA backbone is hydrolyzed by APE1, the 6-FAM containing oligonucleotide (5 bases in length) will dissociate from the hairpin at 37°C (Fig. 4B). This will decrease Dabcyl quenching of 6-FAM and the increase in fluorescence is proportional to uracil removal. Any increase in fluorescence in a control beacon with no base lesion is the result of non-specific DNA backbone cleavage.
Figure 4.
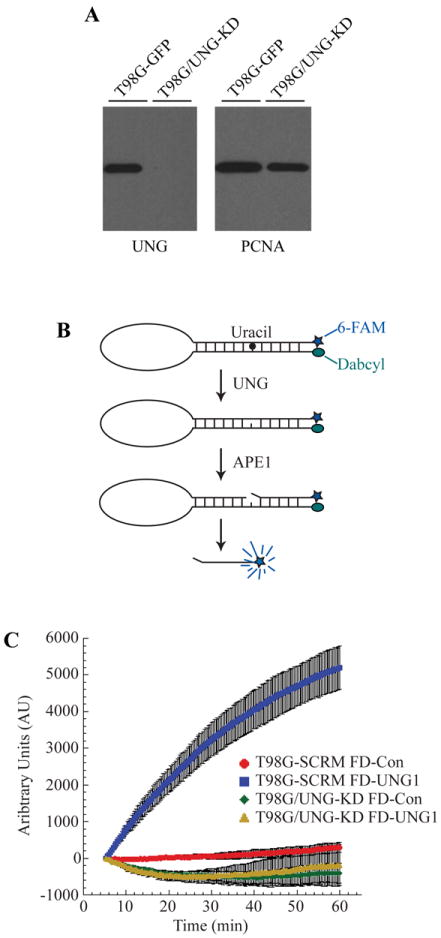
Depletion of UNG protein and uracil glycosylase activity in glioma cells. (A) Knockdown of UNG mRNA corresponds with decreased UNG protein levels. Control and UNG-KD cell line nuclear extracts were resolved in a 4-20% SDS/PAGE gel and immunoblotted for UNG. The blot was stripped and re-probed for PCNA, which was used as a loading control. (B) Molecular beacon model for real-time detection of uracil removal at 37°C in nuclear extracts. (C) Knockdown of UNG abolishes ability to remove uracil from DNA as determined by DNA Glycosylase Molecular Beacon Activity Assay. Specific activity of DNA glycosylase activity for the uracil lesion was measured in nuclear extracts from T98G-SCR (control-beacon, red circles; uracil-beacon, blue squares) and T98G/UNG-KD (control-beacon, green diamonds; uracil-beacon, yellow triangles). The mean fluorescence response unit of three experiments is plotted ± SEM.
Dialysis of nuclear lysates for the molecular beacon assay were done as previously described (22, 30). Briefly, nuclear protein extracts were dialyzed twice for 90 min at 4°C using the 7,000 molecular weight cut-off Slide-A-Lyzer Dialysis Cassette (Pierce; Rockford, IL). Molecular beacon reactions were performed at 37°C using 2 μg of dialyzed protein extract and beacon substrate (final conc. = 40 nM). Fluorescence was measured every 20 seconds for 60 minutes, using a StepOnePlus real-time PCR system and expressed as arbitrary units (AU).
Cell cytotoxicity assays - Short-term MTS assay
TMZ induced cytotoxicity was determined as described previously (34). Briefly, cells were seeded into 96-well plates at a density of 2,000 cells per well. Cells were treated with TMZ for 48 hours at 37°C before determining the relative amount of metabolically active cells by an MTS assay. Results were the average of three separate experiments and normalized to vehicle treated control cells with error bars representing the standard error of the mean.
Cell cytotoxicity assays - Long-term CyQuant assay
Cells were grown until approximately 50-75% confluence before being trypsinized and counted using a CASY counter per the manufacturer’s instructions. Cells were seeded into 96-well plates at a density of 120 cells/well and incubated at 37°C for 24 hours. The cells were treated with vehicle or TMZ and incubated for nine days at 37°C. Plates were removed and fluorescence was determined using the CyQuant kit (Invitrogen, #C7026) following the manufacturer’s instructions. Results were the average of two separate experiments and normalized to vehicle treated control cells with error bars representing the standard error of the mean.
Quantitative determination of reactive oxygen species following TMZ exposure
Cells (T98G) were seeded on 35mm glass bottom dishes (MatTek Corporation, Ashland, MA) and incubated with the superoxide indicator dihydroethidium (DHE, 5 μM, Invitrogen, Eugene, OR) for 15 minutes at 37 °C following the treatment with TMZ (1 mM) or vehicle (1% DMSO) for the times indicated in the figures. Cells were washed with PBS, the media replaced and the dish inserted in a closed, thermo-controlled (37°C) stage top incubator (Tokai Hit Co., Shizuoka-ken, Japan) atop the motorized stage of an inverted Nikon TiE fluorescent microscope (Nikon Inc., Melville, NY) equipped with a 40X oil immersion optic (Nikon, CFI PlanFluor, NA 1.3) and NIS Elements Software. DHE was excited using a Lumencor diode-pumped light engine (SpectraX, Lumencor Inc., Beaverton OR) and detected using a DsRed longpass filter set (Chroma Technology Corp) and Photometrics CoolSNAP HQ2 camera (Photometrics, Tucson, AZ). Data were collected in 2-12 cells per stage position, with 15 stage positions in each of two separate experiments.
Cross species analysis of alkylation screens
The enriched biological process information associated with our TMZ screen was compared to other alkylation screens reported for S. cerevisiae and E. coli. Our cross species analysis was performed similar to a reported analysis (19). Briefly, to determine if the same gene ontology biological processes were enriched in the alkylation sensitive hit lists from all three organisms, representing X number of genes, we aligned the GO-terms from each organism. To identify GO-terms significantly enriched for alkylation sensitive genes from all three organisms we randomly sampled X genes from the complete search space for each screen and identified associated GO functional terms. Random sampling was performed over two hundred iterations and the average number of hits in each GO category and the standard deviation were determined. These values were then compared to the actual values to identify GO terms significantly (P < 0.05) enriched for alkylation sensitive genes from all three organisms. The molecular functions and the corresponding genes, which were significantly enriched in all three alkylation screen data sets, were then visualized using Cytoscape (35). Genes which modulate alkylator toxicity from E. coli (dark blue), S. cerevisiae (light blue) and human (light green), all served as protein nodes, with enriched GO terms serving as central nodes. The edges between GO terms and genes demarcate which genes are annotated to that biological process.
Generation of yeast knockout and viability analysis
Media preparation and other yeast manipulations were performed using standard methods. Mutants were made using a G418 knock out cassette from the S. cerevisiae Gene Deletion Project and were selected on Yeast Peptone Dextrose (YPD) plates containing G418 (200 mg/ml). A mag1Δ mutant was also made using a URA3 based strategy with selection occurring on Synthetic Defined media lacking uracil (SD-URA). Mutants were confirmed by PCR. Plate based MMS viability studies were performed as previously reported (36).
Screen siRNA transient transfection and temozolomide treatment
Transient transfection by siRNA was as previously described (20, 37). Briefly, T98G cells were wet-reverse transfected with the Ambion Silencer Druggable Genome siRNA library in 384-well plates using 1.56 μl of 833.3 nM siRNA for each well, as described previously (20). The library consisted of siRNAs targeting 5,520 different genes. Three unique siRNA duplexes targeting the same gene were pooled into a single well with one-gene target per well. The siRNA were prepared with DharmaFECT2 and OptiMEM and split evenly into two, 384-well plates. T98G cells were added directly to the siRNA complexes. The plates were incubated for five hours at 37°C with 5% CO2 before replacement with fresh media.
Cells were incubated at 37°C with 5% CO2 for 48 h after siRNA transfection to allow for gene silencing before addition of TMZ or vehicle. The media was removed and the cells were treated with media containing either dimethyl sulfoxide (DMSO) vehicle (final concentration 1.0%) or the approximate EC10 of TMZ (final concentration 1 mM in 1% DMSO) for 48 h. Cell viability was measured 96 hours after siRNA transfection with the CellTiter-Blue viability assay according to manufacturer’s protocol.
Druggable genome siRNA screen data analysis
The siRNA screen was performed 3 times over 6 separate weeks. Fluorescence units from each well were normalized to plate negative controls (scrambled siRNA) enabling cell viability comparisons between different plates. The specific details on the data analysis were described by one of us previously (20). In addition, data were analyzed by creating a high confidence hit list as described previously (38). Briefly, cell viabilities for each targeting gene from the three screening replicates were averaged and data were analyzed using two statistical analysis methods. For each gene, a two-sample t-test was performed to determine if there was a sensitization effect on cellular survival between ‘siRNA plus vehicle’ treated cells as compared to ‘siRNA plus TMZ’ treated cells. We selected targeting siRNAs with a p-value less than or equal to this threshold.
Also, viability ratios (ratio of survival of ‘siRNA plus TMZ’ to ‘siRNA plus vehicle’) were calculated for each targeting siRNA to determine the magnitude of response between the two screening conditions. The viability ratios were sorted in descending order and targeting siRNAs with a viability ratio in the lowest 5th percentile were selected for further analysis. The targeting siRNAs identified by both methods (p-value ≤ 0.05 and viability ratio in the lowest 5th percentile) were included in the final high-confidence hit list for further analysis and validation.
Transient siRNA knockdown for validation studies
T98G cells were wet-reverse transfected in six-well plates using siPORT NeoFX (Applied Biosystems) per the manufacturer’s instruction. Briefly, the siRNA was diluted to a working concentration of 2μM before being used. Cells were plated at a concentration of 300,000 cells per well and an siRNA final concentration of 90nM. The cells were incubated for 24 hours at 37°C before replacing transfection media with fresh media. Forty-eight hours after transfection cells were trypsinized and seeded for mRNA quantification and MTS cytotoxicity assays as described above. For knockdown of UNG and UBE3B the following Silencer Select siRNAs from Applied Biosystems were used: UNG: s14679; UBE3B: s40200; Silencer Negative control v2: am4613.
Preparation of cDNA for human astrocyte qRT-PCR
Total RNA was isolated and purified from T98G and LN428 glioblastoma cell lines and normal human astrocytes using Qiazol Lysis Reagent and MiRNeasy spin columns (Qiagen, Valencia, CA) according to the manufacturer’s instructions. RNA quality was assessed using an Agilent Bioanalyzer (Agilent Technologies, Palo Alto, CA). RNAs with an RNA integrity number (RIN) above 9 were used for these studies. Three μg RNA was reverse transcribed into cDNA using the SuperScript III first-Strand synthesis kit (Invitogen, #18080-400) according to the manufacturer’s instructions with Oligo(dT)20 primer in a 20 μl reaction. The cDNA library was then diluted 10 fold for qRT-PCR as described above.
REMBRANDT and TCGA queries
The REMBRANDT database was interrogated in February 2012 using the simple search functions for gene expression of UNG and UBE3B with related Kaplan-Meier survival curves (39, 40). The Cancer Genome Atlas GBM database was queried (July 2012) using the gene expression tool for two-fold greater or less expression of UNG and UBE3B compared to controls. Percentages of GBM overexpressing or under-expressing UNG or UBE3B were recorded.
Results
Synthetic lethal siRNA screen and generation of high confidence hit list
To identify genes that when silenced confer sensitivity to the alkylating agent TMZ, we conducted a synthetic lethal screen (in triplicate) on a TMZ-resistant GBM cell line (T98G) using TMZ and an siRNA library (Fig. S1A). A concentration of 1 mM TMZ was selected due to minimal (~10%) toxicity measured at 48 hours via an MTS assay. Further, T98G cells were treated with varying concentrations of DMSO to determine the impact of DMSO on cell survival (Fig. S1B). No toxicity was observed at 1% DMSO after 48 hours, the % DMSO used for both vehicle and TMZ treatment in the screen.
The transfection conditions used in the screen maximized knockdown, similar to previous screens using these conditions (20). We first calculated viability ratios (ratio of survival of ‘siRNA plus TMZ’ to ‘siRNA plus vehicle’) and normalized to vehicle-treated scrambled siRNA, enabling cross plate comparisons. We then statistically analyzed the viability ratios and determined a group of gene targets that sensitized cells to TMZ by performing a two-tail sample t-test on each gene to determine the effect of siRNA and TMZ on cellular survival. Targeting siRNAs were selected with a p-value of less than or equal to 0.05. The high confidence hit list contained targets that satisfied both criteria: a p-value ≤ 0.05 and a viability ratio in the lowest 5 percent (Fig. S1C). By using these two methods, we created a hit list of 172 genes (Dataset S1). While most of the viability ratios on the hit list were between 0.4 and 0.65, these genes significantly modulated the toxicity of TMZ, yielding many new potential targets to increase response to alkylation chemotherapy. All hits were analyzed for pathway and network enrichment to determine the potential biological pathways that modulated alkylation toxicity
Analysis of screen results for pathway and network enrichment
The genes contained in the hit list were analyzed with NIH DAVID, Princeton GO term finder and Ingenuity Pathways Analysis (Ingenuity® Systems, www.ingenuity.com) (IPA) for pathway and network enrichment. The analysis with DAVID and Princeton GO term finder was performed to search for gene enrichment in molecular functions, cellular compartments, or biological processes based on the associated gene ontology terms. By focusing on 5,520 druggable genes, we expected a small but presumably more relevant gene enrichment dataset compared to probing the entire human genome as background. Several different thresholds for viability ratio percentiles were initially analyzed for gene enrichment, including 2.5%, 5%, 7.5% and 10% (Datasets S2-S4). The 5% group was selected for a more detailed analysis because it contained many of the gene enrichment groups seen in both the 7.5% and 10% datasets, but was more focused with higher gene enrichment scores.
The enriched genes from the NIH DAVID analysis contained several different groups including DNA repair, response to DNA damage stimulus, cell proliferation, amino acid glycosylation and biopolymer glycosylation (Table 1). The most enriched groups have specific DNA repair functions including BER activity, hydrolase activity and DNA N-glycosylase activity. Surprisingly, four genes belonging to the three most enriched groups were DNA glycosylases that do not recognize alkylation damage (6). Interestingly, these genes (TDG, OGG1, NEIL1 and UNG) are known to recognize and repair multiple types of oxidative DNA damage (Table 2) (6).
Table 1.
Top gene enrichment groups determined by NIH DAVID
| Gene Ontology Term | p-value | Genes* | Fold Enrichment | FDR |
|---|---|---|---|---|
| Base excision repair | 2.92E-05 | OGG1, NEIL1, POLD1, TDG, UNG | 14.7 | 0.054348 |
| Hydrolase activity, Hydrolyzing N-glycosyl compounds | 4.71E-05 | CD38, OGG1, TDG, UNG, NEIL1 | 13.48214 | 0.083124 |
| Glycosidase | 9.54E-05 | SPAM1, SMPDL3A, OGG1, TDG, TREH, CTBS, UNG, NEIL1 | 5.992216 | 0.148149 |
| DNA N-glycosylase activity | 1.07E-04 | OGG1, TDG, UNG, NEIL1 | 17.47685 | 0.188687 |
| DNA repair | 1.73E-04 | LIG4, OGG1, TDG, ATR, TREX1, LIG1, UNG, NEIL1 | 5.522238 | 0.269107 |
| DNA damage | 1.99E-04 | LIG4, OGG1, TDG, ATR, TREX1, LIG1, UNG, NEIL1 | 5.416041 | 0.309503 |
CCNO is incorrectly labeled in NIH DAVID as UNG2. UNG2 is a DNA glycosylase so it originally appeared in our analysis. However, CCNO does not have a similar function to UNG2 and was removed from further analysis.
Table 2.
Sensitizing DNA glycosylases and their known substrates
| Gene Symbol | Gene Name | Known Substrate* | Screen Viability Ratio |
|---|---|---|---|
| OGG1 | 8-oxoguanine DNA glycosylase | 8-oxoG:C=T=G; me-FapyG:C; FapyG:C; 8-oxoA:C; urea | 0.648 |
| UNG | Uracil DNA glycosylase | ssU; U:G; U:A; 5-fluorouracil; 5,6-Dihydroxy-U:G; 5-OH-U:G; Isodialuric acid; Alloxan | 0.446 |
| TDG | Thymine DNA glycosylase | U:G; T:G and ethenoC:G; 5-Fluorouracil; 5-fluorouracil (ss); 5-Hydroxymethyluracil; hypoxanthine:G; 5-bromouracil; εC:A Tg:G; 5-formyl-U | 0.541 |
| NEIL1 | Nei endonuclease VIII-like 1 (E. coli) | TgG; 5-OH-C; 5-OH-U:AT>G; Guanidinohydantoin; guanidinohydantoin (ss); Iminoallantoin; Iminoallantoin (ss); Spiroiminodihydantoin; Spiroiminodihydantoin (ss); 5,6-Dihydro-T; 5,6-Dihydro-U:G=C=A>T; FapyG:C; 8-Oxo-G:C=G>T>A; FapyA:T; (5’R)-8,5’-Cyclo-2’-deoxyadenosine; (5’S)-8,5’-Cyclo-2’-deoxyadenosine; 8-Oxo-A:C | 0.559 |
For mismatched base pairs, the repaired or removed base is configured on the left in each case.
There were large overlaps of enriched genes from DAVID and Princeton GO term finder analyses (Fig. S2 and Dataset S5). The oxidative DNA glycosylases, which sensitized cells to TMZ, were identified in the most significantly enriched networks determined by both DAVID and Princeton GO term finder (Table 1 and Dataset S6). Data were also analyzed through the use of IPA. IPA uses a manually curated interaction database and a right-tailed Fisher’s exact test to calculate a p-value, determining the probability that each biological function assigned to that network is due to chance alone. Analysis using IPA identified several of the DNA glycosylases in a statistically significant network, with a network value of twenty-four (Fig. 1). The network score is the negative logarithm of the p-value (p-value =10-24). This network is very similar to the biological processes and corresponding genes overrepresented in the DAVID and Princeton GO analysis. Further, IPA returned several highly enriched molecular functions including DNA repair (p-value=5.31 × 10⁻⁴) and post-translational modifications (p-value= 2.98 × 10⁻³ - 3.12 × 10⁻²). These two pathways or nodes were then further analyzed in this study, as described later. However, because of the highly significant enrichment of DNA repair processes in all three programs, genes associated with the DNA Repair pathway category were selected for initial biological validation.
Figure 1.
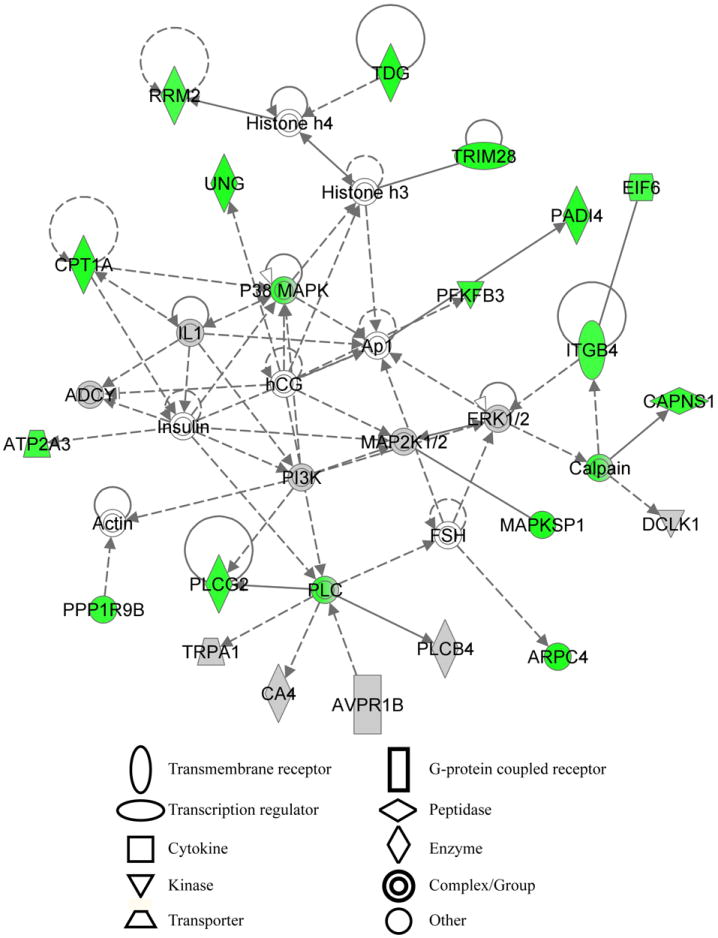
Analysis with NIH DAVID, Princeton GO term finder and Ingenuity Pathway Analysis yield similar gene enrichments, biological processes and pathways.The high confidence hit list was also analyzed by IPA for biological pathway enrichment. One highly significant network generated by Ingenuity Pathway Analysis containing similar biological processes with other analysis methods is shown. The network is composed of many overlapping genes with genes in the high confidence hit list colored green. Genes not tested in the screen are white while non-sensitizing genes tested in the screen are gray. The top functions in the network are nucleic acid metabolism, small molecule biochemistry and metabolic disease with a network score of 24. The network score is the negative logarithm of the p-value.
Knockdown of oxidative DNA glycosylases sensitize cells to TMZ
In our analysis, we discovered that the DNA repair category was enriched for TMZ sensitizing genes. This category contained four DNA glycosylases (UNG, OGG1, TDG and NEIL1), each specific for the repair of oxidative DNA damage (6). To determine if other DNA glycosylases also sensitize cells to TMZ and to validate the siRNA synthetic lethal screen results, seven of the eleven DNA glycosylases were knocked down using a lentiviral system to create stable T98G-derived cell lines. Knockdown of glycosylase mRNA was validated by qRT-PCR (Fig. 2A). The stable cell lines were then tested for sensitization to 1 mM TMZ in a 96-well plate format using a modified MTS assay (21). As confirmation of our siRNA screen analysis, the newly developed UNG-KD cell line was also sensitive to TMZ (Fig. 2B). Furthermore, knockdown of the DNA glycosylases MYH and MPG also sensitized cells to TMZ (Fig. 2B). Surprisingly, these results suggest that high-dose TMZ treatment may be initiating the formation of reactive oxygen species (ROS), in line with an earlier report in Saccharomyces cerevisiae (41) and mouse embryonic fibroblasts (42). To determine if the high-dose alkylator treatment might be inducing ROS, we utilized real-time live-cell imaging and fluorescent quantification with the superoxide indicator dihydroethidium (DHE) to determine if the treatment from 1 mM TMZ used in this study yields an increase in superoxide. As shown, the treatment with TMZ induces superoxide within 30 minutes and an observed 12.1 +/- 1.8% increase in DHE emission intensity in the first hour that was then stabilized at 16.3 +/- 2.1% by 2 hours (Fig. 2C and Fig. 3).
Figure 2.
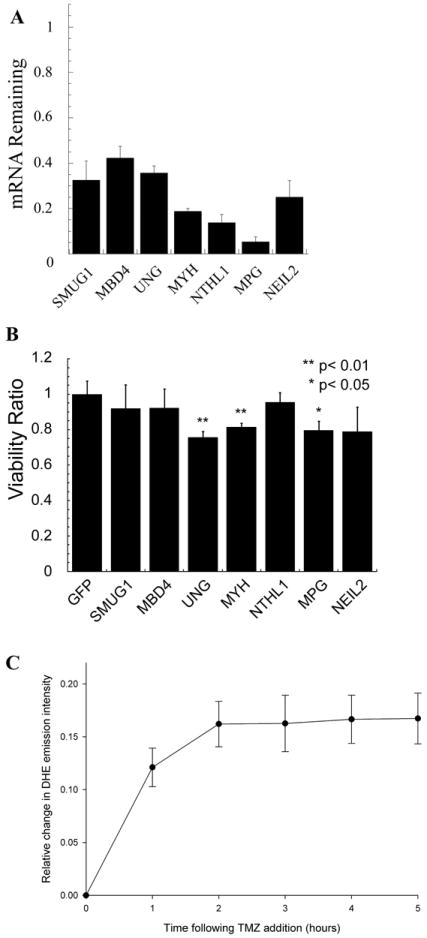
Glioma cells with shRNA knockdown of DNA glycosylases are more sensitive to the clinical alkylator TMZ. (A) Quantification of DNA glycosylase mRNA knockdown in cells as determined by qRT-PCR. TaqMan probes were used to quantify mRNA levels on an Applied Biosystems StepOnePlus machine. The qRT-PCR data were analyzed using the ΔΔCt method and was normalized to GFP infected plate controls. Gene expression of each gene was normalized to the expression of human ß-actin. The mean of three independent experiments is plotted ± SEM. (B) Validation of TMZ sensitization with knockdown of specific DNA glycosylases. T98G DNA glycoylase knockdown cell line sensitivity to TMZ was determined by an MTS assay 48 h after exposure to 1 mM TMZ. The viability ratio is double normalized to account for both vehicle treated shRNA mediated growth defects and toxicity of control cells to TMZ. The mean viability ratio of three independent experiments is plotted ± SEM. (C) TMZ treatment results in a time-dependent increase in reactive oxygen species as measured with the superoxide indicator dihydroethidium. Data were collected in 2-12 cells per stage position, with 15 stage positions in each of two separate experiments, as detailed in the methods section and as in Figure 3. There was a 12.1 +/- 1.8% increase in DHE emission intensity in the first hour which stabilized at 16.3 +/- 2.1% by 2 hours.
Figure 3.
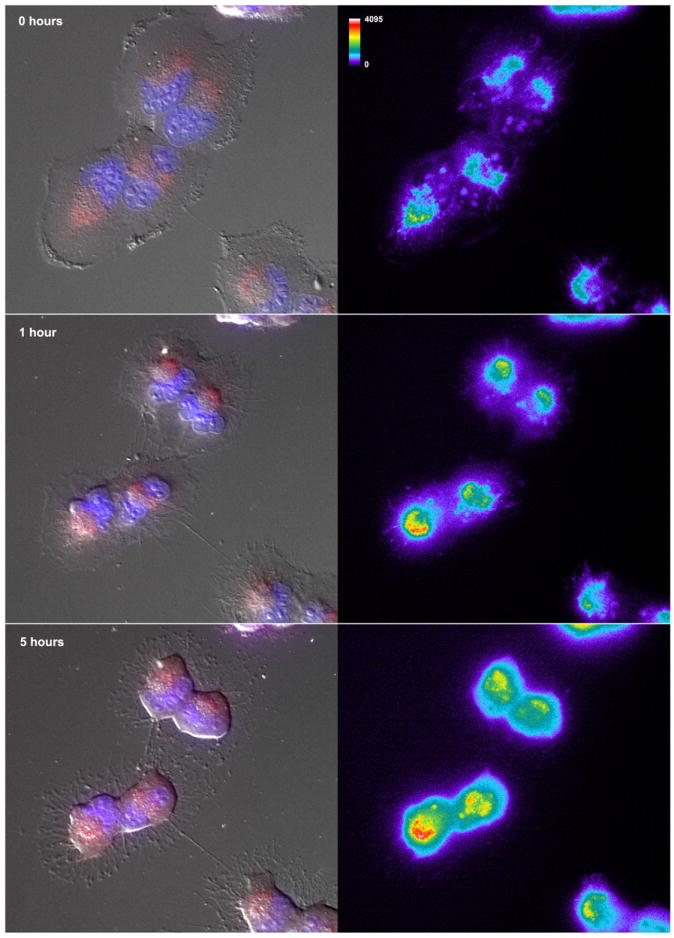
Temozolomide induced increase in reactive oxygen species in glioma cells. Cells (T98G) were seeded on 35mm glass bottom dishes (MatTek Corporation, Ashland, MA) and incubated with the superoxide indicator dihydroethidium (DHE, 5 μM, Invitrogen, Eugene, OR) for 15 minutes at 37 °C following treatment with TMZ (1 mM) or vehicle (1% DMSO) for the times indicated (0, 1 or 5 h). Cells were washed with PBS, the media replaced and the dish inserted in a closed, thermo-controlled (37°C) stage top incubator (Tokai Hit Co., Shizuoka-ken, Japan) atop the motorized stage of an inverted Nikon TiE fluorescent microscope (Nikon Inc., Melville, NY) equipped with a 40X oil immersion optic (Nikon, CFI PlanFluor, NA 1.3) and NIS Elements Software. DHE was excited using a Lumencor diode-pumped light engine (SpectraX, Lumencor Inc., Beaverton OR) and detected using a DsRed longpass filter set (Chroma Technology Corp) and Photometrics CoolSNAP HQ2 camera (Photometrics, Tucson, AZ). The figure shows representative images from no treatment (top panel; 0 hours) and from TMZ treatment for 1 hour (middle panel) and 5 hours (bottom). The panels on the left show an overlay of the differential interference contrast (DIC) imaging of cell morphology, with DAPI staining of nuclei (blue) and DHE (red). The panels on the left show the DHE emissions alone, which have been pseudo-colored for to demonstrate the TMZ-mediated increases in intensity (from 0-4095 grey scales).
UNG knockdown eliminates removal of uracil in glioma cells
UNG mRNA knockdown sensitized the T98G cells to TMZ in the validation study, and we next quantitated mRNA knockdown, UNG protein levels and DNA repair activity levels to further support this correlation. First, we tested UNG protein expression via immunoblot and determined that UNG protein levels were decreased in T98G/UNG-KD cells as compared to T98G-GFP control cells (Fig. 4A). However, we were interested in ascertaining if the decrease in UNG protein levels affects the DNA repair capacity of the cells, because there is a large functional overlap of UNG with the three DNA glycoslylases SMUG1, TDG and MBD4 (6). We were concerned that depletion of one of these DNA glycosylases would not have a functional DNA repair defect due to compensation by the other glycosylases. We therefore developed a DNA glycosylase molecular beacon assay to quantify the functional loss of uracil removal by UNG knockdown, essentially as we have described previously for the analysis of MPG activity (22). The assay uses a molecular beacon composed of a single stranded DNA molecule with a 5’ fluorophore (6-FAM) and a 3’ quencher (Dabcyl). The oligonucleotide also contains a uracil lesion, a substrate for UNG. We selected uracil as the lesion because it is removed by UNG, SMUG1, TDG and MBD4 (6). Therefore, we could determine if UNG-KD impacts uracil removal and if compensation by other DNA repair proteins occurred. A similar oligonucleotide with a normal base was used as a control substrate. Removal of the uracil lesion by UNG and hydrolysis of the DNA backbone by APE1 results in separation of the 6-FAM fluorophore from the Dabcyl quencher and the increase in 6-FAM fluorescence is proportional to uracil removal (Fig. 4B). The T98G-SCR cell lysate (from cells expressing a scrambled shRNA) incubated with control beacon (Fig. 4C, red circles) had a minimal increase in fluorescence, signifying the control beacon is intact. However, the T98G-SCR lysate incubated with the beacon containing uracil (Fig. 4C, blue squares) exhibited a large increase in fluorescence (17.69 fold at 60 min) compared to the control beacon, indicative of robust uracil removal. The T98G/UNG-KD lysates incubated with either the control beacon (Fig. 4C, green diamonds) or the uracil-containing beacon (Fig. 4C, yellow triangles) contained no difference in fluorescence.
These results support our conclusion that the T98G/UNG-KD cells have impaired uracil removal due to UNG knockdown as compared to the T98G-SCR control, with no evidence for repair compensation by SMUG1, TDG or MBD4. The scrambled shRNA control was used instead of the GFP control for the activity assay due to the interference of GFP fluorescence with the molecular beacon fluorophore 6-FAM. Although uracil can also be removed by SMUG1, TDG and MBD4, UNG-KD alone was sufficient to deplete uracil removal activity (6).
Cross-species functionome analysis creates a network of conserved processes important for survival after alkylation damage
After biological validation, we then compared our T98G siRNA screen results to other alkylation screens conducted in S. cerevisiae and E. coli, using GO molecular function terms (17, 18). This was done by compiling the sensitizing genes from all the screens and linking them to their specific Gene Ontology Biological Process. The list of sensitizing genes from E. coli, S. cerevisiae and human was then computationally analyzed to identify GO-functional categories over-represented with genes from human and either E. coli or S. cerevisiae (Supplemental Table S1). The molecular functions enriched in all three alkylation screen datasets were then visualized using Cytoscape to create a cross species functionome of proteins which modulate toxicity to alkylating agents in S. cerevisiae, E. coli and human (Fig. 5). This network of proteins has several “GO-hubs” of proteins from all three species clustered around a conserved biological process (node) that significantly impacts the survival of correspondingly depleted cells after exposure to alkylating agents. As was observed in previous DNA alkylation screens performed in S. cerevisiae and E. coli (17, 18), proteins involved in the cellular response to alkylation damage involve many biological functions, suggesting that synthesis of new DNA, RNA, protein, and fatty acids are all essential for survival following exposure to alkylating agents. Many of the biological processes identified from our cross-species functionome analysis are conserved, containing multiple proteins from each organism. We have used this approach to define a network of proteins that constitutes a cross-species functionome of evolutionarily important processes essential for survival after alkylation exposure. The functionome analysis affirms that our TMZ screen results from human cells are consistent with previous alkylation studies in other species and allowed us to computationally parse our data to identify rational starting points for more detailed genetic analysis.
Figure 5.
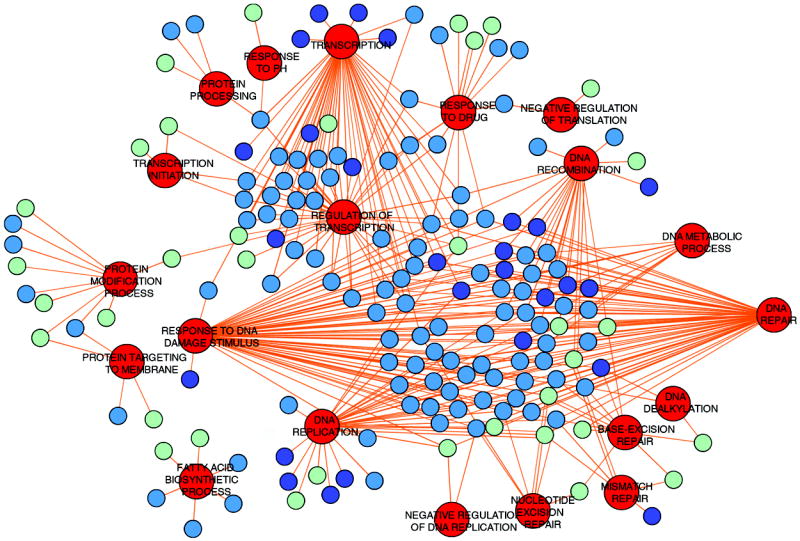
Biological processes necessary for survival after alkylation damage are conserved and when compiled generate a cross-species functionome. The conserved biological processes with their corresponding genes were visualized using Cytoscape. Red nodes denote conserved biological processes. The remaining nodes are alkylation-modulating proteins belonging to E. coli (dark blue), S. cerevisiae (light blue) and humans (light green). The edges connect specific biological processes to each protein belonging to the processes. Many proteins are involved in more than one biological process to affect alkylation exposure survival and therefore are connected to several biological processes nodes.
Disruption of protein modification processes sensitizes human cells to alkylators
Based on the functionome network we identified and the validation of the role of DNA repair proteins in response to TMZ, we chose to validate a second node of proteins involved in the response to alkylators. The protein modifications node was chosen due to enrichment in the cross-species analysis, good sensitization in the screening studies and the observation that this node had multiple genes in both human and yeast cells. Human UBE3B and ICMT knockdown cell lines (UBE3B-KD and ICMT-KD) were generated using lentivirus shRNA vectors as described above. Knockdown levels of mRNA were determined using qRT-PCR (Fig. S3A). The UBE3B-KD and ICMT-KD cell lines were then tested for sensitivity to TMZ treatment using a modified MTS assay. The knockdown of UBE3B and ICMT significantly sensitized the glioblastoma cells to 1 mM TMZ resulting in viability ratios of 0.6 and 0.7, respectively (Fig. 6A), as compared to the control. We then tested each knockdown cell line for sensitivity to TMZ in a long-term assay similar to a clonogenic cell survival assay. The CyQuant assay utilizes a highly sensitive fluorescent intercalating DNA dye to determine relative DNA content and cell number nine days after TMZ or vehicle treatment. The UBE3B-KD cell lines were approximately twice as sensitive as the control cells in the CyQuant assay at concentrations as low as 50μM TMZ (Fig. 6B).
Figure 6.
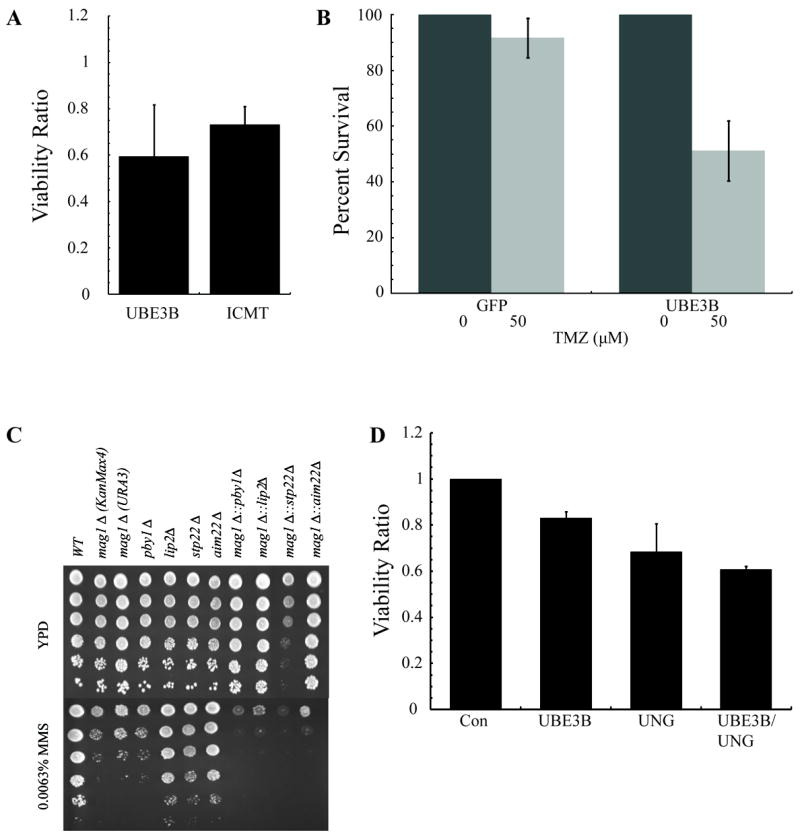
Knockout or depletion of protein modification genes sensitizes S. cerevisiae and human glioma cells to alkylating agents. (A) Knockdown of protein modification genes sensitize glioma cells to TMZ. The T98G cell lines with protein modification gene knockdown were treated with 1mm TMZ to determine sensitivity by an MTS assay 48 hours after exposure. The mean viability ratio of three independent experiments is plotted ± SEM. (B) Knockdown of UBE3B sensitizes glioma cells to TMZ at clinically achievable doses. The T98G/UBE3B-KD cell line was treated with 50μM of TMZ and survival was determined by CyQuant assay 9 days after exposure. The percent survival of two independent experiments is plotted ± SEM. (C) A dilution series of yeast single and double knockouts were tested in YPD and YPD + MMS containing media. (D) Sensitivity to TMZ via knockdown of UNG and UBE3B are not independent. T98G cells transiently transfected with siRNA that was scrambled, targeting UNG, UBE3B or both UNG and UBE3B. Forty-eight hours after transfection cells were seeded to determine sensitivity to TMZ by MTS assay. Both individual knockdowns of UNG and UBE3B sensitized glioma cells to TMZ, but dual knockdown did not have a greater effect than either single knockdown, suggesting an epistatic relationship between UNG and UBE3B.
Protein modification gene knockout sensitizes yeast to alkylators, while simultaneous knockout of protein modification genes and an alkylbase DNA glycosylase yields the greatest sensitivity
We have previously reported that aim22Δ, lip2Δ, pby1Δ and stp22Δ cells from S. cerevisiae, which belong to the protein modification node, are sensitive to the alkylating agent MMS (17). In addition, it has been firmly established that mag1Δ cells are sensitive to MMS because of their alkylbase DNA glycosylase deficiency and inability to repair damaged DNA. We assayed all individual knockouts to further validate our previously reported screening results (Fig. 6C) and demonstrate decreased growth after MMS treatment for all five mutants. Based on our functionome results, we reasoned that there would be increased alkylation sensitivity when deficiencies in protein modification and BER were combined. We generated double knockouts in the four protein modification associated mutants, using a mag1Δ deletion cassette. We demonstrate that there is increased sensitivity in all of the double mutants tested, relative to the individual parent or mag1Δ knockout strains. The protein modification genes correspond to activities involved in the modification of mitochondrial enzymes by the attachment of lipoic acid groups (Lip2), a protein that works with Lip2 (Aim22), a tubulin tyrosine ligase associated with P-bodies (Pby1) and a component of the ESCRT complex that is involved in ubiquitin-dependent sorting of proteins into the endosome (Stp22). We note that Pby1 is homologous to the mouse and human Tsg101 tumor susceptibility genes, which are homologs of ubiquitin-conjugating enzymes implicated in being involved in cell cycle regulation and genome maintenance. The mag1Δstp22Δ double mutant is the most sensitive to MMS, but there also appears to be a growth defect in these strains on untreated media, suggesting some synthetic lethal interaction outside of alkylation damage. Nonetheless, our results with combined protein modification and BER mutants in budding yeast supports the idea that similar dual knockouts in humans may confer increased sensitivity to TMZ.
Dual disruption of both DNA repair and protein modification nodes reveals a potential epistatic relationship between UNG and UBE3B
Although the UNG-KD and UBE3B-KD cell lines were both more sensitive to TMZ when compared to control cells, we were interested in determining if the double-KD cells would have an increased TMZ sensitivity, as was seen for the double KO lines in S. cerevisiae (Fig. 6C). To this end, we investigated if simultaneous inhibition of both DNA repair and protein modification genes increased sensitivity compared to either inhibition alone. However, we noticed during long-term passaging of the UBE3B-KD cell line that sensitivity and knockdown levels diminished, suggesting outgrowth of WT cells in a pooled population.
To prevent the loss of mRNA knockdown, we returned to using an siRNA transient transfection approach to knockdown both UNG and UBE3B. We transfected parental T98G cells with a scrambled control siRNA, UNG siRNA, UBE3B siRNA, or UNG plus UBE3B siRNA before determining mRNA levels by qRT-PCR (Fig. S3B). Cells were seeded for qRT-PCR and sensitivity determination by MTS assay at the same time. Wells with less than 35% mRNA for either UNG or UBE3B remaining were analyzed for sensitivity to TMZ. We expected the dual knockdown of UNG and UBE3B to confer at least an additive effect to TMZ sensitivity, suggesting that the sensitivity observed after knockdown of the proteins resulted from independent mechanisms. However, although UNG and UBE3B knockdown alone both confer sensitivity to TMZ, when they are simultaneously knocked down there is no significant increase in sensitivity to TMZ below the level of either single knockdown (Fig. 6D). Thus, TMZ sensitivity to knockdown of UNG and UBE3B are not independent events, demonstrating a possible epistatic relationship between the UNG and UBE3B genes. Although it is more likely UBE3B has an indirect role in UNG sensitivity, it is interesting to speculate that ubiquitinylation of UNG by UBE3B can modify protein localization, abundance or activity as it has been suggested that UNG is targeted for ubiquitin-mediated proteolysis during the S phase of the cell cycle (43, 44).
UNG and UBE3B are differentially expressed in cancer cell lines
Expression of UBE3B affected GBM sensitivity to TMZ and may impact response of various cancers to other chemotherapeutic alkylating agents such as cyclophosphamide, chlorabucil and dacarbazine. With little known on the function or expression of UBE3B in normal and cancerous tissue, we wanted to determine if UBE3B expression levels vary in different cancer cell lines. To determine if UBE3B is differentially expressed in different cancer types we quantified relative expression levels of UBE3B mRNA by qRT-PCR. We discovered that UBE3B mRNA expression varies by approximately 7-8 fold in the tumor cell lines tested (not shown). Although UBE3B expression fluctuates in different cancer cell lines, most importantly we sought to determine if UBE3B and UNG levels vary in the LN428 and T98G cell lines when compared to normal human astrocyte controls. We determined relative mRNA levels of UNG and UBE3B in LN428 and T98G cell lines compared to normal human astrocyte controls using qRT-PCR (Figure 7). UBE3B levels were significantly lower in the LN428 cells than in astrocytes whereas there was a 2-fold increase in UNG expression in both cancer cell lines when compared to human astrocyte controls.
Figure 7.
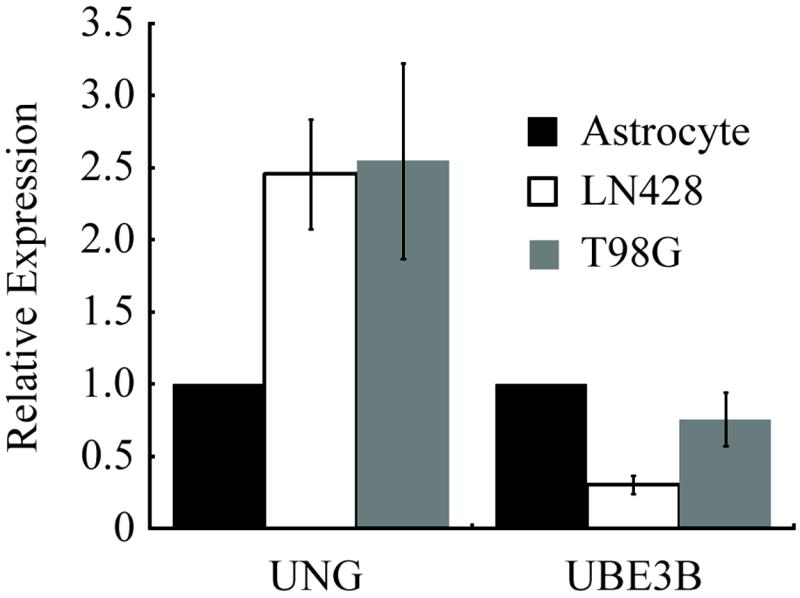
UBE3B and UNG expression fluctuate in cancer cell lines. UNG is expressed at higher levels in brain tumor cell lines, when compared to non-tumor controls. Quantification of UNG and UBE3B mRNA by qRT-PCR compared to human astrocyte controls. Gene expression of each gene was normalized to the expression of human ß-actin. The mean of three independent experiments is plotted ± SEM.
Discussion
GBMs are the most common and aggressive primary brain tumor; the current standard of care consists of maximum surgical removal, radiation and TMZ (2-4). Many tumors are refractory to TMZ treatment, resulting in very poor outcomes. Difficulties in treating GBM make it a candidate for drug research since an increase in therapeutic options is necessary to improve survival rate. Because TMZ clinical efficacy is primarily due to the toxicity of the O6-MeG DNA lesion, much of the alkylation damage sensitization research has focused on this lesion. Unfortunately, previous attempts to improve efficacy of O6-MeG lesion-mediated cytotoxicity have been futile. Clinical trials to test the effectiveness of MGMT inhibitors have not shown an increase in efficacy or sensitivity (12), particularly in TMZ-resistant GBM (13). Due to the inherent difficulties and resistance of GBM to chemotherapies, any increase in cancer sensitization could greatly impact patient outcomes.
To discover “druggable” targets that contribute to TMZ sensitivity, independent of the O6-MeG lesion, we conducted a synthetic lethal siRNA screen against 5,520 genes in a TMZ-resistant cell line that has elevated expression of MGMT (T98G), uncovering enriched biological processes independent of MGMT and O6-MeG lesion induced cell death that included 172 genes (Dataset S1), many corresponding to similar or over-lapping biological processes as determined by NIH DAVID, Princeton GO term finder and IPA. After enrichment analysis, increased TMZ-mediated sensitization in cells depleted of UNG (UNG-KD) was validated using a separate shRNA targeting sequence and an independent experimental design. Thus, cell sensitization to alkylating agents with UNG-KD is not due to RNAi off-target effects or artifacts of the screening protocol. We could not create stable knockdowns of the other DNA glycosylase hits, likely because the knockdown of OGG1, TDG and NEIL1 created cells with a growth disadvantage compared to cells expressing normal levels of the corresponding protein.
Although UNG has not been reported to repair alkylation damage, knockdown of UNG sensitizes T98G cells to TMZ. This is likely the result of the observed TMZ-induced burst of ROS in this study and as reported after treatment with MMS in yeast (41). TMZ may directly alkylate the electron transport chain proteins and mitochondrial DNA, which could impair electron flow through the chain by direct alkylation damage of the protein and decreased functional protein expression due to replication blocking lesions or mutated DNA. It is possible that mitochondrial alkylation damage induces an increase in ROS formation. Mitochondrial ROS production can increase from defects in electron transport chain proteins, such as complex I (45). Cells lacking oxidative DNA glycosylases may be more sensitive to ROS because repair of oxidative lesions is compromised. For example, cells lacking NEIL1 are more sensitive to gamma-irradiation (46) and NEIL1-/- mice have decreased expansion of germinal center B cells (47). Thus, an increase in ROS may create lethal oxidative lesions that UNG (e.g., 5,6-dihydro-2’-deoxyuridine) and other oxidative DNA glycosylases must repair to prevent cell death after alkylation exposure (6). NAD+ kinase, which phosphorylates NAD+ to form NADP+, was also a hit in our screen. Cells keep NADP+ in its reduced state, NADPH, to use NADPH’s reducing potential in many different pathways including glutathione regeneration for oxidant defense, reduction of RNA to DNA, and synthesis of fatty and amino acids. New synthesis and repair of macromolecules is essential for alkylation survival (18, 36, 48). Support for a potential role of ROS in alkylation sensitivity was also shown by others using mouse embryonic fibroblasts and several human cancer cell lines, which were treated with the alkylating agent MNNG and contained greater ROS production from both NADPH oxidase and mitochondria sources (42, 49). In the report by Chiu et at, MNNG cytotoxicity could be completely abrogated by pretreatment with N-acetylcysteine, demonstrating that increased ROS formation may contribute to alkylation toxicity and is a likely source of cytotoxic DNA lesions (42). Cells expressing UNG may be less sensitive to TMZ because the increase in ROS, as we observed after TMZ exposure, can yield cytotoxic oxidative DNA lesions that are substrates for and therefore repaired by UNG, promoting cellular survival.
UNG was not the only DNA glycosylase to sensitize cells to alkylation exposure in the validation experiments. AAG (MPG) was included in our analysis because it can be predicted from our work and the work of others that MPG expression levels may modulate TMZ sensitivity (22). Both MPG and MYH knockdown (KD) sensitized T98G cells to TMZ. This was unexpected because MPG did not sensitize in the siRNA screen, perhaps due to lack of knockdown. However, our results are consistent with previous reports from several labs, as MPG-KD led to either an increase or decrease in cell death after alkylation exposure depending on the system under study (50-53). Further, MPG status alone does not adequately predict response to alkylators, but instead the balance of the entire BER pathway must be investigated to predict sensitivity to DNA damage (22, 30, 54). The ability of MYH-KD to sensitize cells to alkylators was not anticipated since expression of MYH had been previously shown to promote cell death after alkylator exposure (55). In that study, however, the authors used a clonogenic cell survival assay that interrogates cell death related to the O6-MeG lesion because the cells can undergo two or more replication cycles (55). In contrast, in our initial validation experiments, cell survival was determined after 48 hours post TMZ treatment, too short for two replication cycles to occur (56). Therefore, the role of MYH in O6-MeG mediated cell death is likely very different than its role in cell survival after 48hr exposure to TMZ as described in this study. MYH is primarily known for the removal of the mismatched A opposite 8-oxoG lesions (57, 58) and MYH deficiency does not sensitize cells to H2O2, IR, or cis-platinum (6). Therefore, the sensitization of MYH depletion to TMZ treatment may also be the result of the observed increase in ROS and the expected accumulation of cytotoxic ROS-induced lesions. Finally, we focused our efforts on UNG since it is elevated in the glioma lines under study (see Fig. 7) and in clinical samples as measured by the TCGA study (http://www.nextbio.com/b/study/ov.nb?id=38365) and is one of several DNA glycosylases involved in the repair of ROS induced DNA lesions (6).
After biological validation was completed, the results were compared to similar alkylator sensitivity screens done in S. cerevisiae and E. coli (17, 18). Many of the same biological processes significantly enriched in the human screen were enriched in both screens from yeast and bacteria. There are a diverse collection of biological processes, ranging from DNA repair to modulation of transcription, translation, protein modifications and fatty acid biosynthesis that appear to be essential for survival after alkylation exposure. The many processes necessary for cellular survival after alkylation exposure likely stem from the alkylator’s ability to modify all macromolecules in a cell, thereby requiring repair of not only DNA, but also of RNA, proteins and fatty acids. In the human siRNA screen, these data suggests a novel epistatic relationship between UNG and UBE3B. This is likely an indirect interaction with downstream targets of UBE3B modulating TMZ cytotoxicity through a UNG dependent pathway. A direct functional interaction between UBE3B and UNG may exist, since UNG is a known target of ubiquitinylation (44, 59, 60), although the data described herein would not implicate UBE3B in the cell cycle-regulated proteolysis of UNG.
The analysis of the three screens revealed that many biological processes modulate survival after alkylation damage. The greatest alkylator toxicity in yeast cells was generated by dual inhibition (KO) of both BER and the protein modification processes, suggesting that simultaneous inhibition may be required to achieve a clinically significant sensitization for chemotherapies, provided this approach can provide tumor selectivity. In that regard, we evaluated the range of UNG expression levels in primary patient tumors by interrogating the Cancer Genome Atlas (TCGA) dataset on GBM (http://www.nextbio.com/b/study/ov.nb?id=38365). UNG expression is two-fold greater in approximately 14% of the GBMs studied in the TCGA. The TCGA dataset includes 424 glioblastoma primary tumor samples as compared to 10 normal brain samples and analyzed using the Agilent 244K G4502A array platform. Of these samples, 58 had Tumor/Normal ratio of UNG expression above 2 (14%). In addition, this dataset also indicates that 49% of the samples express UNG at a level that is 1.5 fold greater in the tumor as compared to normal brain. Interestingly, there are no samples with a two-fold decrease in UNG expression in the TCGA database. We also queried the Rembrandt database for UNG gene expression data and found that greater than 33% of GBMs contained 2-fold or greater expression of UNG (40). These results, from a separate database, reinforced our hypothesis that expression levels of UNG varied significantly in tumors. The directionality of the changes were consistent and it appears that over-expression of UNG is beneficial for GBM tumor growth or survival, with less than 1% of tumors containing a two-fold decrease in UNG expression in the REMBRANDT database. This trend also extended to other brain tumor types such as astrocytomas, which had greater than 14% of tested tumors containing two-fold greater expression of UNG and no samples with a two-fold down regulation of UNG (40).
Knowing that the expression levels of UNG fluctuate in primary tumor samples, we asked if expression levels of UNG and UBE3B correlated with response to therapy or survival. We would predict the increase in UNG expression levels would correlate with reduced survival due to the ability of the cells to repair their DNA more efficiently, especially TMZ induced lesions. In support of our prediction we queried the REMBRANDT database for clinical outcomes related to UNG overexpression compared to intermediate expression in all glioma: two-fold overexpression of UNG correlated with a decrease in the probability of survival compared to intermediate expression of UNG, with a log-rank p-value, calculated using the Mantel-Haenszel procedure, of 1.0177×10⁻⁴. This correlation matches our prediction based on our cell culture data, suggesting that increased expression of UNG negatively impacts brain tumor patient survival, possibly from increased resistance to chemotherapeutic treatment. There was no significant relationship regarding UBE3B and clinical outcomes in REMBRANDT but it was observed that the frequency of a 2-fold decrease in UBE3B expression was 1.1% in the REMNRANDT cohort and 19% in the Cancer Genome Database (not shown). However, it was recently reported that UBE3B may be a candidate autism gene since a homozygous mutation (R40C) in UBE3B was identified in affected monozygotic twins and heterozygous in the parents and unaffected siblings (61). Based on our studies herein, it is interesting to speculate that the role of UBE3B in autism onset may be related to the response to genotoxic stress.
In summary, these studies suggest that alkylation resistance mechanisms are evolutionarily conserved. The collection of conserved biological processes in E. coli, S. cerevisiae and humans composes an Alkylation Functionome that includes many novel proteins not previously thought to impact alkylation resistance (Figure 8). We can begin to appreciate the multiple processes that are required for cellular survival after alkylation damage and form an unbiased approach to discover targets for adjuvant chemotherapy. This is an important next step, so as to determine if genes that were not tested in the screen, but share conserved biological pathways, are also possible targets to enhance TMZ response. Because the analysis has also been enriched for the most essential pathways and genes, there may be functional overlap of the conserved genes and pathways. The highly conserved nature of these biological processes lends mechanistic insight into potential gene and pathway interactions. Determining the relationships between these genes and biological processes is important to determine pathway redundancy. Due to the plethora of resistance mechanisms, it is possible that depletion or inhibition of one gene in a conserved biological process cannot overcome the drug resistance due to compensation by another gene or biological process. By investigating multiple pathways and processes we can determine important interactions that promote tumor survival to be targeted for improved chemotherapy response.
Figure 8.
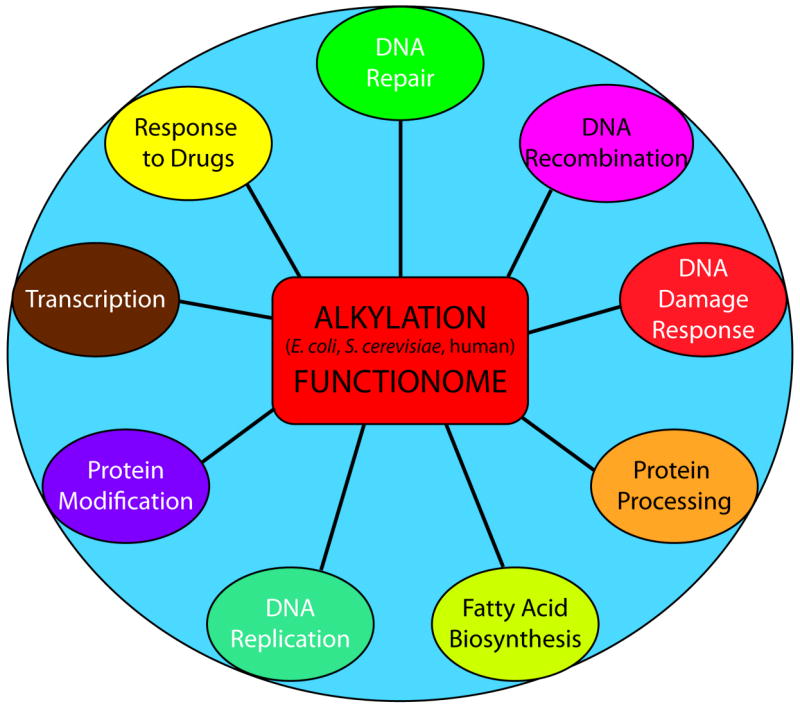
Graphical depiction of the Alkylation Functionome. The “Alkylation Functionome” is a gene list that encompasses a diverse collection of similar biological processes crucial to survival of human, bacteria and yeast cells following alkylation damage.
Supplementary Material
Supplemental Table S1
Enriched genes identified by both NIH DAVID and Princeton GO Term Finder
Enriched biological processes and associated genes as determined by Princeton GO Term Finder
Supplemental Figure 1
Supplemental Figure 2
Supplemental Figure 3
Genes of interest from the siRNA screen that satisfied both selection criteria: a p-value less than 0.05 and a viability ratio in the lowest 5%
Second group of genes from the siRNA screen analyzed for gene enrichment using selection criteria of a p-value less than 0.05 and a viability ratio in the lowest 2.5%
Third group of genes from the siRNA screen analyzed for gene enrichment using selection criteria of a p-value less than 0.05 and a viability ratio in the lowest 7.5%
Fourth group of genes from the siRNA screen analyzed for gene enrichment using selection criteria of a p-value less than 0.05 and a viability ratio in the lowest 10%
Acknowledgments
Grant Support
This work was supported by grants from the National Brain Tumor Society and the National Institutes of Health (NIH) [GM087798; CA148629; ES019498] to RWS and TJB (ES01225101) and a NYSTAR James Watson Award to TJB. Support was also provided by the University of Pittsburgh Department of Pharmacology and Chemical Biology with a Molecular Pharmacology Fellowship to DS. Support for the UPCI Lentiviral Facility was provided by the Cancer Center Support Grant from the National Institutes of Health [CA047904].
Footnotes
Disclosure of Potential Conflicts of interest
RWS is a scientific consultant for Trevigen, Inc. The remaining authors state that there is no conflict of interest.
References
- 1.Holland EC. Glioblastoma multiforme: the terminator. Proc Natl Acad Sci U S A. 2000;97:6242–4. doi: 10.1073/pnas.97.12.6242. [DOI] [PMC free article] [PubMed] [Google Scholar]
- 2.Cohen MH, Johnson JR, Pazdur R. Food and Drug Administration Drug approval summary: temozolomide plus radiation therapy for the treatment of newly diagnosed glioblastoma multiforme. Clin Cancer Res. 2005;11:6767–71. doi: 10.1158/1078-0432.CCR-05-0722. [DOI] [PubMed] [Google Scholar]
- 3.Stupp R, Hegi ME, Mason WP, van den Bent MJ, Taphoorn MJ, Janzer RC, et al. Effects of radiotherapy with concomitant and adjuvant temozolomide versus radiotherapy alone on survival in glioblastoma in a randomised phase III study: 5-year analysis of the EORTC-NCIC trial. Lancet Oncol. 2009;10:459–66. doi: 10.1016/S1470-2045(09)70025-7. [DOI] [PubMed] [Google Scholar]
- 4.Stupp R, Mason WP, van den Bent MJ, Weller M, Fisher B, Taphoorn MJ, et al. Radiotherapy plus concomitant and adjuvant temozolomide for glioblastoma. New England Journal of Medicine. 2005;352:987–96. doi: 10.1056/NEJMoa043330. [DOI] [PubMed] [Google Scholar]
- 5.Almeida KH, Sobol RW. A unified view of base excision repair: lesion-dependent protein complexes regulated by post-translational modification. DNA Repair. 2007;6:695–711. doi: 10.1016/j.dnarep.2007.01.009. [DOI] [PMC free article] [PubMed] [Google Scholar]
- 6.Svilar D, Goellner EM, Almeida KH, Sobol RW. Base Excision Repair and lesion-dependent sub-pathways for repair of oxidative DNA damage. Antioxid Redox Signal. 2011;14:2491–507. doi: 10.1089/ars.2010.3466. [DOI] [PMC free article] [PubMed] [Google Scholar]
- 7.Sobol RW. Temozolomide. In: Schwab M, editor. Encyclopedia of Cancer. 2. Berlin, Heidelberg, New York: Springer; 2009. [Google Scholar]
- 8.Gerson SL. MGMT: its role in cancer aetiology and cancer therapeutics. Nat Rev Cancer. 2004;4:296–307. doi: 10.1038/nrc1319. [DOI] [PubMed] [Google Scholar]
- 9.Fu D, Calvo JA, Samson LD. Balancing repair and tolerance of DNA damage caused by alkylating agents. Nat Rev Cancer. 2012;12:104–20. doi: 10.1038/nrc3185. [DOI] [PMC free article] [PubMed] [Google Scholar]
- 10.Cahill DP, Levine KK, Betensky RA, Codd PJ, Romany CA, Reavie LB, et al. Loss of the mismatch repair protein MSH6 in human glioblastomas is associated with tumor progression during temozolomide treatment. Clin Cancer Res. 2007;13:2038–45. doi: 10.1158/1078-0432.CCR-06-2149. [DOI] [PMC free article] [PubMed] [Google Scholar]
- 11.Sarkaria JN, Kitange GJ, James CD, Plummer R, Calvert H, Weller M, et al. Mechanisms of chemoresistance to alkylating agents in malignant glioma. Clin Cancer Res. 2008;14:2900–8. doi: 10.1158/1078-0432.CCR-07-1719. [DOI] [PMC free article] [PubMed] [Google Scholar]
- 12.McMurry TB. MGMT inhibitors--The Trinity College-Paterson Institute experience, a chemist’s perception. DNA Repair (Amst) 2007;6:1161–9. doi: 10.1016/j.dnarep.2007.03.015. [DOI] [PubMed] [Google Scholar]
- 13.Quinn JA, Jiang SX, Reardon DA, Desjardins A, Vredenburgh JJ, Rich JN, et al. Phase II trial of temozolomide plus o6-benzylguanine in adults with recurrent, temozolomide-resistant malignant glioma. J Clin Oncol. 2009;27:1262–7. doi: 10.1200/JCO.2008.18.8417. [DOI] [PMC free article] [PubMed] [Google Scholar]
- 14.Yip S, Miao J, Cahill DP, Iafrate AJ, Aldape K, Nutt CL, et al. MSH6 mutations arise in glioblastomas during temozolomide therapy and mediate temozolomide resistance. Clin Cancer Res. 2009;15:4622–9. doi: 10.1158/1078-0432.CCR-08-3012. [DOI] [PMC free article] [PubMed] [Google Scholar]
- 15.Hunter C, Smith R, Cahill DP, Stephens P, Stevens C, Teague J, et al. A hypermutation phenotype and somatic MSH6 mutations in recurrent human malignant gliomas after alkylator chemotherapy. Cancer Res. 2006;66:3987–91. doi: 10.1158/0008-5472.CAN-06-0127. [DOI] [PMC free article] [PubMed] [Google Scholar]
- 16.Stein GH. T98G: an anchorage-independent human tumor cell line that exhibits stationary phase G1 arrest in vitro. Journal of cellular physiology. 1979;99:43–54. doi: 10.1002/jcp.1040990107. [DOI] [PubMed] [Google Scholar]
- 17.Said MR, Begley TJ, Oppenheim AV, Lauffenburger DA, Samson LD. Global network analysis of phenotypic effects: protein networks and toxicity modulation in Saccharomyces cerevisiae. Proc Natl Acad Sci U S A. 2004;101:18006–11. doi: 10.1073/pnas.0405996101. [DOI] [PMC free article] [PubMed] [Google Scholar]
- 18.Rooney JP, George AD, Patil A, Begley U, Bessette E, Zappala MR, et al. Systems based mapping demonstrates that recovery from alkylation damage requires DNA repair, RNA processing, and translation associated networks. Genomics. 2009;93:42–51. doi: 10.1016/j.ygeno.2008.09.001. [DOI] [PMC free article] [PubMed] [Google Scholar]
- 19.Rooney JP, Patil A, Joseph F, Endres L, Begley U, Zappala MR, et al. Cross-species Functionome analysis identifies proteins associated with DNA repair, translation and aerobic respiration as conserved modulators of UV-toxicity. Genomics. 2011;97:133–47. doi: 10.1016/j.ygeno.2010.12.005. [DOI] [PMC free article] [PubMed] [Google Scholar]
- 20.Thaker NG, Zhang F, McDonald PR, Shun TY, Lewen MD, Pollack IF, et al. Identification of survival genes in human glioblastoma cells by small interfering RNA screening. Mol Pharmacol. 2009;76:1246–55. doi: 10.1124/mol.109.058024. [DOI] [PMC free article] [PubMed] [Google Scholar]
- 21.Tang J, Goellner EM, Wang XW, Trivedi RN, St Croix CM, Jelezcova E, et al. Bioenergetic Metabolites Regulate Base Excision Repair-Dependent Cell Death in Response to DNA Damage. Molecular Cancer Research. 2010;8:67–79. doi: 10.1158/1541-7786.MCR-09-0411. [DOI] [PMC free article] [PubMed] [Google Scholar]
- 22.Tang JB, Svilar D, Trivedi RN, Wang XH, Goellner EM, Moore B, et al. N-methylpurine DNA glycosylase and DNA polymerase beta modulate BER inhibitor potentiation of glioma cells to temozolomide. Neuro-oncology. 2011;13:471–86. doi: 10.1093/neuonc/nor011. [DOI] [PMC free article] [PubMed] [Google Scholar]
- 23.Goellner EM, Grimme B, Brown AR, Lin YC, Wang XH, Sugrue KF, et al. Overcoming Temozolomide Resistance in Glioblastoma via Dual Inhibition of NAD+ Biosynthesis and Base Excision Repair. Cancer Res. 2011;71:2308–17. doi: 10.1158/0008-5472.CAN-10-3213. [DOI] [PMC free article] [PubMed] [Google Scholar]
- 24.Huang da W, Sherman BT, Lempicki RA. Systematic and integrative analysis of large gene lists using DAVID bioinformatics resources. Nature protocols. 2009;4:44–57. doi: 10.1038/nprot.2008.211. [DOI] [PubMed] [Google Scholar]
- 25.Dennis G, Jr, Sherman BT, Hosack DA, Yang J, Gao W, Lane HC, et al. DAVID: Database for Annotation, Visualization, and Integrated Discovery. Genome Biol. 2003;4:P3. [PubMed] [Google Scholar]
- 26.Boyle EI, Weng S, Gollub J, Jin H, Botstein D, Cherry JM, et al. GO::TermFinder--open source software for accessing Gene Ontology information and finding significantly enriched Gene Ontology terms associated with a list of genes. Bioinformatics. 2004;20:3710–5. doi: 10.1093/bioinformatics/bth456. [DOI] [PMC free article] [PubMed] [Google Scholar]
- 27.Cho RJ, Huang M, Campbell MJ, Dong H, Steinmetz L, Sapinoso L, et al. Transcriptional regulation and function during the human cell cycle. Nat Genet. 2001;27:48–54. doi: 10.1038/83751. [DOI] [PubMed] [Google Scholar]
- 28.Zufferey R, Dull T, Mandel RJ, Bukovsky A, Quiroz D, Naldini L, et al. Self-inactivating lentivirus vector for safe and efficient in vivo gene delivery. J Virol. 1998;72:9873–80. doi: 10.1128/jvi.72.12.9873-9880.1998. [DOI] [PMC free article] [PubMed] [Google Scholar]
- 29.Zufferey R, Nagy D, Mandel RJ, Naldini L, Trono D. Multiply attenuated lentiviral vector achieves efficient gene delivery in vivo. Nat Biotechnol. 1997;15:871–5. doi: 10.1038/nbt0997-871. [DOI] [PubMed] [Google Scholar]
- 30.Mutamba JT, Svilar D, Prasongtanakij S, Wang XH, Lin YC, Dedon PC, et al. XRCC1 and base excision repair balance in response to nitric oxide. DNA Repair (Amst) 2011;10:1282–93. doi: 10.1016/j.dnarep.2011.10.008. [DOI] [PMC free article] [PubMed] [Google Scholar]
- 31.Svilar D, Vens C, Sobol RW. Quantitative, Real-time Analysis of Base Excision Repair Activity in Cell Lysates Utilizing Lesion-specific Molecular Beacons. Journal of visualized experiments : JoVE. 2012 Aug 6;(66) doi: 10.3791/4168. [DOI] [PMC free article] [PubMed] [Google Scholar]
- 32.Yaron A, Carmel A, Katchalski-Katzir E. Intramolecularly quenched fluorogenic substrates for hydrolytic enzymes. Anal Biochem. 1979;95:228–35. doi: 10.1016/0003-2697(79)90210-0. [DOI] [PubMed] [Google Scholar]
- 33.Clegg RM. Fluorescence resonance energy transfer and nucleic acids. Methods Enzymol. 1992;211:353–88. doi: 10.1016/0076-6879(92)11020-j. [DOI] [PubMed] [Google Scholar]
- 34.Trivedi RN, Almeida KH, Fornsaglio JL, Schamus S, Sobol RW. The Role of Base Excision Repair in the Sensitivity and Resistance to Temozolomide Mediated Cell Death. Cancer Res. 2005;65:6394–400. doi: 10.1158/0008-5472.CAN-05-0715. [DOI] [PubMed] [Google Scholar]
- 35.Shannon P, Markiel A, Ozier O, Baliga NS, Wang JT, Ramage D, et al. Cytoscape: a software environment for integrated models of biomolecular interaction networks. Genome Res. 2003;13:2498–504. doi: 10.1101/gr.1239303. [DOI] [PMC free article] [PubMed] [Google Scholar]
- 36.Begley U, Dyavaiah M, Patil A, Rooney JP, DiRenzo D, Young CM, et al. Trm9-catalyzed tRNA modifications link translation to the DNA damage response. Mol Cell. 2007;28:860–70. doi: 10.1016/j.molcel.2007.09.021. [DOI] [PMC free article] [PubMed] [Google Scholar]
- 37.Kitchens CA, McDonald PR, Shun TY, Pollack IF, Lazo JS. Identification of chemosensitivity nodes for vinblastine through small interfering RNA high-throughput screens. J Pharmacol Exp Ther. 2011;339:851–8. doi: 10.1124/jpet.111.184879. [DOI] [PMC free article] [PubMed] [Google Scholar]
- 38.Whitehurst AW, Bodemann BO, Cardenas J, Ferguson D, Girard L, Peyton M, et al. Synthetic lethal screen identification of chemosensitizer loci in cancer cells. Nature. 2007;446:815–9. doi: 10.1038/nature05697. [DOI] [PubMed] [Google Scholar]
- 39.Madhavan S, Zenklusen JC, Kotliarov Y, Sahni H, Fine HA, Buetow K. Rembrandt: helping personalized medicine become a reality through integrative translational research. Mol Cancer Res. 2009;7:157–67. doi: 10.1158/1541-7786.MCR-08-0435. [DOI] [PMC free article] [PubMed] [Google Scholar]
- 40.NCI. [2007 February 9];2012 REMBRANDT home page ( http://rembrandt.nci.nih.gov). 2005 Available from: http://rembrandt.nci.nih.gov.
- 41.Griffiths LM, Swartzlander D, Meadows KL, Wilkinson KD, Corbett AH, Doetsch PW. Dynamic compartmentalization of base excision repair proteins in response to nuclear and mitochondrial oxidative stress. Mol Cell Biol. 2009;29:794–807. doi: 10.1128/MCB.01357-08. [DOI] [PMC free article] [PubMed] [Google Scholar]
- 42.Chiu LY, Ho FM, Shiah SG, Chang Y, Lin WW. Oxidative stress initiates DNA damager MNNG-induced poly(ADP-ribose)polymerase-1-dependent parthanatos cell death. Biochemical pharmacology. 2011;81:459–70. doi: 10.1016/j.bcp.2010.10.016. [DOI] [PubMed] [Google Scholar]
- 43.Fischer JA, Caradonna S. Analysis of nuclear uracil-DNA glycosylase (nUDG) turnover during the cell cycle. Methods Mol Biol. 2011;761:137–49. doi: 10.1007/978-1-61779-182-6_9. [DOI] [PubMed] [Google Scholar]
- 44.Fischer JA, Muller-Weeks S, Caradonna S. Proteolytic degradation of the nuclear isoform of uracil-DNA glycosylase occurs during the S phase of the cell cycle. DNA Repair (Amst) 2004;3:505–13. doi: 10.1016/j.dnarep.2004.01.012. [DOI] [PubMed] [Google Scholar]
- 45.Lazarou M, Thorburn DR, Ryan MT, McKenzie M. Assembly of mitochondrial complex I and defects in disease. Biochim Biophys Acta. 2009;1793:78–88. doi: 10.1016/j.bbamcr.2008.04.015. [DOI] [PubMed] [Google Scholar]
- 46.Rosenquist TA, Zaika E, Fernandes AS, Zharkov DO, Miller H, Grollman AP. The novel DNA glycosylase, NEIL1, protects mammalian cells from radiation-mediated cell death. DNA Repair. 2003;2:581–91. doi: 10.1016/s1568-7864(03)00025-9. [DOI] [PubMed] [Google Scholar]
- 47.Mori H, Ouchida R, Hijikata A, Kitamura H, Ohara O, Li Y, et al. Deficiency of the oxidative damage-specific DNA glycosylase NEIL1 leads to reduced germinal center B cell expansion. DNA Repair (Amst) 2009;8:1328–32. doi: 10.1016/j.dnarep.2009.08.007. [DOI] [PMC free article] [PubMed] [Google Scholar]
- 48.Begley TJ, Rosenbach AS, Ideker T, Samson LD. Damage recovery pathways in Saccharomyces cerevisiae revealed by genomic phenotyping and interactome mapping. Mol Cancer Res. 2002;1:103–12. [PubMed] [Google Scholar]
- 49.Infanger DW, Sharma RV, Davisson RL. NADPH oxidases of the brain: distribution, regulation, and function. Antioxid Redox Signal. 2006;8:1583–96. doi: 10.1089/ars.2006.8.1583. [DOI] [PubMed] [Google Scholar]
- 50.Sobol RW, Kartalou M, Almeida KH, Joyce DF, Engelward BP, Horton JK, et al. Base Excision Repair Intermediates Induce p53-independent Cytotoxic and Genotoxic Responses. J Biol Chem. 2003;278:39951–9. doi: 10.1074/jbc.M306592200. [DOI] [PubMed] [Google Scholar]
- 51.Elder RH, Jansen JG, Weeks RJ, Willington MA, Deans B, Watson AJ, et al. Alkylpurine-DNA-N-glycosylase knockout mice show increased susceptibility to induction of mutations by methyl methanesulfonate. Molecular and Cellular Biology. 1998;18:5828–37. doi: 10.1128/mcb.18.10.5828. [DOI] [PMC free article] [PubMed] [Google Scholar]
- 52.Roth RB, Samson LD. 3-Methyladenine DNA glycosylase-deficient Aag null mice display unexpected bone marrow alkylation resistance. Cancer Res. 2002;62:656–60. [PubMed] [Google Scholar]
- 53.Meira LB, Moroski-Erkul CA, Green SL, Calvo JA, Bronson RT, Shah D, et al. Aag-initiated base excision repair drives alkylation-induced retinal degeneration in mice. Proc Natl Acad Sci U S A. 2009;106:888–93. doi: 10.1073/pnas.0807030106. [DOI] [PMC free article] [PubMed] [Google Scholar]
- 54.Trivedi RN, Wang XH, Jelezcova E, Goellner EM, Tang J, Sobol RW. Human methyl purine DNA glycosylase and DNA polymerase ß expression collectively predict sensitivity to temozolomide. Molecular Pharmacology. 2008;74:505–16. doi: 10.1124/mol.108.045112. [DOI] [PMC free article] [PubMed] [Google Scholar]
- 55.Fry RC, Svensson JP, Valiathan C, Wang E, Hogan BJ, Bhattacharya S, et al. Genomic predictors of interindividual differences in response to DNA damaging agents. Genes Dev. 2008;22:2621–6. doi: 10.1101/gad.1688508. [DOI] [PMC free article] [PubMed] [Google Scholar]
- 56.Quiros S, Roos WP, Kaina B. Processing of O6-methylguanine into DNA double-strand breaks requires two rounds of replication whereas apoptosis is also induced in subsequent cell cycles. Cell Cycle. 2010;9:168–78. doi: 10.4161/cc.9.1.10363. [DOI] [PubMed] [Google Scholar]
- 57.Sobol RW. For MutY, it’s all about the OG. Chem Biol. 2012;19:313–4. doi: 10.1016/j.chembiol.2012.03.002. [DOI] [PMC free article] [PubMed] [Google Scholar]
- 58.Brinkmeyer MK, Pope MA, David SS. Catalytic Contributions of Key Residues in the Adenine Glycosylase MutY Revealed by pH-dependent Kinetics and Cellular Repair Assays. Chem Biol. 2012;19:276–86. doi: 10.1016/j.chembiol.2011.11.011. [DOI] [PMC free article] [PubMed] [Google Scholar]
- 59.Ahn J, Vu T, Novince Z, Guerrero-Santoro J, Rapic-Otrin V, Gronenborn AM. HIV-1 Vpr loads uracil DNA glycosylase-2 onto DCAF1, a substrate recognition subunit of a cullin 4A-ring E3 ubiquitin ligase for proteasome-dependent degradation. J Biol Chem. 2010;285:37333–41. doi: 10.1074/jbc.M110.133181. [DOI] [PMC free article] [PubMed] [Google Scholar]
- 60.Hagen L, Kavli B, Sousa MM, Torseth K, Liabakk NB, Sundheim O, et al. Cell cycle-specific UNG2 phosphorylations regulate protein turnover, activity and association with RPA. Embo J. 2008;27:51–61. doi: 10.1038/sj.emboj.7601958. [DOI] [PMC free article] [PubMed] [Google Scholar]
- 61.Chahrour MH, Yu TW, Lim ET, Ataman B, Coulter ME, Hill RS, et al. Whole-exome sequencing and homozygosity analysis implicate depolarization-regulated neuronal genes in autism. PLoS Genet. 2012;8:e1002635. doi: 10.1371/journal.pgen.1002635. [DOI] [PMC free article] [PubMed] [Google Scholar]
Associated Data
This section collects any data citations, data availability statements, or supplementary materials included in this article.
Supplementary Materials
Supplemental Table S1
Enriched genes identified by both NIH DAVID and Princeton GO Term Finder
Enriched biological processes and associated genes as determined by Princeton GO Term Finder
Supplemental Figure 1
Supplemental Figure 2
Supplemental Figure 3
Genes of interest from the siRNA screen that satisfied both selection criteria: a p-value less than 0.05 and a viability ratio in the lowest 5%
Second group of genes from the siRNA screen analyzed for gene enrichment using selection criteria of a p-value less than 0.05 and a viability ratio in the lowest 2.5%
Third group of genes from the siRNA screen analyzed for gene enrichment using selection criteria of a p-value less than 0.05 and a viability ratio in the lowest 7.5%
Fourth group of genes from the siRNA screen analyzed for gene enrichment using selection criteria of a p-value less than 0.05 and a viability ratio in the lowest 10%