

The mechanisms underlying parental genome coordination upon mammalian fertilization remain elusive due to difficulties in preparing large numbers of high-quality preimplantation cells. Here, Park et al. collect an unprecedented number of mouse oocytes and establish detailed transcriptional profiles for four early embryonic stages and parthenogenetic development. Bioinformatic analysis identifies a distinctive gene regulatory network activated in embryos after fertilization compared with parthenotes. This large-scale profile of early mouse embryos yields a valuable resource for developmental biology and stem cell research.
Keywords: development, fertilization, parthenogenesis, transcriptome, transcription factor
Abstract
Fertilization precisely choreographs parental genomes by using gamete-derived cellular factors and activating genome regulatory programs. However, the mechanism remains elusive owing to the technical difficulties of preparing large numbers of high-quality preimplantation cells. Here, we collected >14 × 104 high-quality mouse metaphase II oocytes and used these to establish detailed transcriptional profiles for four early embryo stages and parthenogenetic development. By combining these profiles with other public resources, we found evidence that gene silencing appeared to be mediated in part by noncoding RNAs and that this was a prerequisite for post-fertilization development. Notably, we identified 817 genes that were differentially expressed in embryos after fertilization compared with parthenotes. The regulation of these genes was distinctly different from those expressed in parthenotes, suggesting functional specialization of particular transcription factors prior to first cell cleavage. We identified five transcription factors that were potentially necessary for developmental progression: Foxd1, Nkx2-5, Sox18, Myod1, and Runx1. Our very large-scale whole-transcriptome profile of early mouse embryos yielded a novel and valuable resource for studies in developmental biology and stem cell research. The database is available at http://dbtmee.hgc.jp.
Fertilization of an oocyte by a sperm is the first developmental step to confer totipotency on the newly formed embryo. Fertilization stimulates a precisely controlled coordination of maternal and paternal genomes through a sequence of different biological processes. Deciphering the mechanisms underlying this choreography of the parental genomes in mammalian embryos has long been recognized as one of the fundamental challenges in human infertility and stem cell biology research.
Recent technological advances in cell biology have fostered a number of studies to obtain new insights into the mechanisms in various species (Latham et al. 1991; Schultz 2002; Krawetz 2005; Wang and Dey 2006). One remarkable finding was the identification of programmed “waves” of gene expression during development. This phenomenon has been confirmed through global gene expression profiles determined with expressed sequence tag sequencing (Ko et al. 2000), microarrays (Hamatani et al. 2004; Wang et al. 2004; Zeng et al. 2004; Vassena et al. 2011), and high-throughput RNA sequencing (RNA-seq) (Tang et al. 2009; Macfarlan et al. 2012; Tan et al. 2013). In mice, maternal RNAs are degraded (Piko and Clegg 1982), and then the embryos exhibit waves of gene expression transitions; namely, zygotic gene activation (ZGA) at the two-cell stage (2C) and mid-preimplantation gene activation (MGA) at the four-cell stage (4C) (Wang and Dey 2006). These gene expression patterns are altered in parthenogenetic embryos (Bui et al. 2011), leading to abortive development owing to abnormalities in genetic imprints and signal transduction (Williams et al. 1996; Fan and Sun 2004; Wang et al. 2004; Liu et al. 2010). Recent studies have also shown that parental epigenomic effects also play an essential role in establishing the appropriate expression profile during development; among these epigenetic modifications are DNA methylation (Kobayashi et al. 2012; Smith et al. 2012), histone modification (Miller et al. 2010; Santenard et al. 2010; Erkek et al. 2013), and regulation by noncoding RNAs (ncRNAs) (Amanai et al. 2006; Tang et al. 2007; Svoboda and Flemr 2010).
Although there is increasing information on the importance of the control and interaction of maternal and paternal genomes in normal development, our understanding of genomic events at very early stages of development is far from complete owing to the technical difficulties of preparing large numbers of high-quality preimplantation cells. To date, for example, relatively large-scale studies have used several hundred (Hamatani et al. 2004; Zeng et al. 2004) to a thousand (Ko et al. 2000; Kobayashi et al. 2012) embryos per stage. In addition, the embryos in these studies were not consistent with respect to their developmental time frame or cell cycle stage, bringing into question the validity of the conclusions regarding the identified molecular factors. In the present study, we sought to overcome these possible limitations by preparing very large numbers of high-quality preimplantation cells in order to enable extensive genome-wide profiling with greater reliability and reproducibility.
We collected >14 × 104 mouse metaphase II (MII) oocytes and, after in vitro fertilization or induced parthenogenesis, used nocodazole to precisely synchronize the cell cycle to achieve a precise analysis of specific embryonic stages. High-throughput sequencing technology was used to establish transcriptional profiles in this unprecedentedly ultralarge-scale experiment. As a result, we were able to build a database through bioinformatic analyses of this very high-quality resource. Our results confirmed that the genome activation program commenced immediately after fertilization and that this program was essential for successful development. Furthermore, our bioinformatic analyses suggested that this activation program involves maternal and sperm-borne factors as well as mRNAs newly synthesized after fertilization, all of which comprise a distinctive gene regulatory network compared with that of parthenotes. Our database will help researchers explore the genetic and epigenetic characteristics of genes involved in genome activation programs and, in particular, identify potential key transcription factors (TFs) involved in transcriptional initiation in fertilized oocytes.
Results
Whole-transcriptome analysis
Large-scale temporal RNA-seq
To investigate transcriptional profiles of mouse embryos at early developmental stages, we extracted high-quality MII oocytes and one-cell stage (1C), 2C, and 4C embryos. In addition, we prepared parthenogenetic 1C (p1C) and p4C embryos and also used mouse embryonic fibroblasts (MEFs) (Fig. 1A). Next, we performed SOLiD RNA-seq with ribosomal RNA (rRNA)-depleted total RNA libraries. This RNA-seq of mouse embryos was performed on an extremely large scale using 10,000 cells per replicate, with two or three replicates per stage.
Figure 1.

Systematic representation of transcriptome analysis and summary of mapped read distributions. (A) Developmental stages targeted by the RNA-seq assay. (B) Distribution of uniquely mapped reads along mouse genomic features. (C,D) Histograms showing the number of RefSeq exons and introns and the coverage levels. (E) Histogram showing the number of intronic ncRNAs (coverage >0.6) and their proportion among the total detected introns shown in D. Averaged numbers across replicates are shown. (Oo) Oocyte.
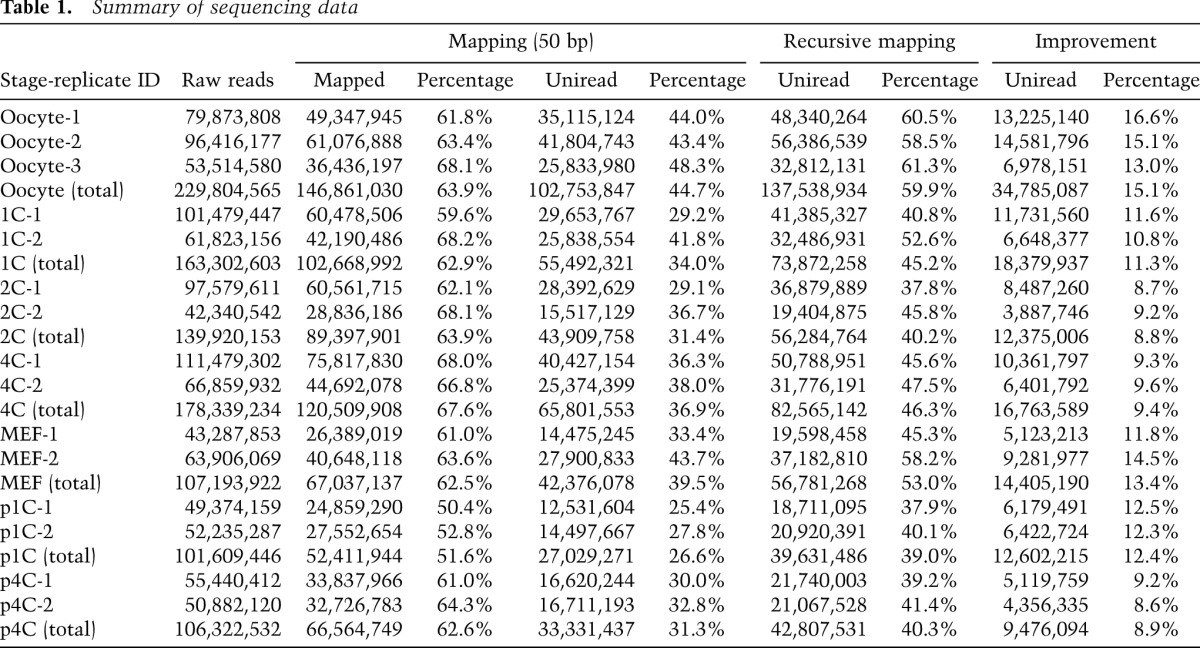
From this large-scale analysis, we generated 139.9 million–229.8 million 50-base-pair (bp) reads (tags) from the replicates of each developmental stage (Table 1). Approximately 62.9%–67.6% of the sequenced reads were mapped to the mouse genome (University of California at Santa Cruz [UCSC] mm9) by TopHat (Trapnell et al. 2012); we increased the fraction of uniquely mapped reads (unireads) by 8.8%–15.1% using a recursive mapping strategy. These unireads were used for further analysis. Compared with previous studies (Tang et al. 2009; Macfarlan et al. 2012), our RNA-seq data gave higher coverage and/or depth (Supplemental Table S1); 43.9%–48.4% of the 59.3 million nonredundant RefSeq exonic bases were covered by at least one uniread, and, on average, a given exonic base position had more than three unireads.
Table 1.
Summary of sequencing data
Characterization of the transcriptional profile
We used the Cufflinks package (Trapnell et al. 2012) to quantify RefSeq transcripts; this analysis confirmed high reproducibility among the replicates (Supplemental Table S2) and obtained a compendium of the transcriptional profile during development (Supplemental Fig. S1). To validate the RNA-seq results, we performed quantitative RT–PCR (qRT–PCR) on 16 randomly selected genes and found that 11 genes were in good agreement (Supplemental Fig. S2). In addition, we found striking concordance of expression patterns with well-known genes that have been validated previously (Supplemental Fig. S2). Of note, the comparison with qRT–PCR shows variance in particular at 2C, presumably due to the fact that a large fraction of the maternally supplied mRNAs has been degraded at this stage (Piko and Clegg 1982).
As a characteristic of the transcriptional profile, a dramatic change in expression occurred during the transition from 1C to 2C (Supplemental Fig. S1), which is consistent with descriptions from previous studies (Latham et al. 1991; Schultz 2002). Additionally, the total number of bases aligned by unireads decreased at 2C but subsequently increased at 4C (Fig. 1B); this pattern of change is consistent with the variation in the amount of RNA during development (Piko and Clegg 1982; Tang et al. 2007; Svoboda and Flemr 2010). Interestingly, a peculiar distribution of unireads, in which intronic and intergenic reads were sequentially increased, was identified (Fig. 1B); this is consistent with the results of a recent mRNA-seq assay (Supplemental Fig. S3). We suggest that oocytes and 1C mainly contain fully matured maternal mRNAs, while the rise in intronic reads at 2C and 4C may reflect an increasing level of nascent transcription. More specifically, the number of exons aligned by the reads was relatively consistent at different stages (Fig. 1C), whereas more introns were detected with higher coverage as the embryos developed (Fig. 1D). Interestingly, oocytes and 1C exhibited a higher percentage of ncRNAs than later stages (Fig. 1E). This may suggest that ncRNAs have a distinct and important role during development.
Extensive transcriptome discovery
To address the nonexonic reads illustrated in Figure 1B, we assembled and quantified ncRNAs using comprehensive annotation (Kin et al. 2007). We found that many ncRNAs were transcribed at high levels during development (Fig. 2A). The vast majority were miscellaneous RNAs (miscRNAs) or antisense RNAs (asRNAs) (Table 2). A dendrogram analysis of the expression profiles of the ncRNAs revealed a major transition in expression between 1C and 2C (Fig. 2B); the analysis also indicated that fertilization might influence this major transition because 1C was located far from the cluster of oocytes and p1C. This putative fertilization effect appeared to be time-limited, as 4C and p4C were clustered in all cases.
Figure 2.

Summary of transcriptome discovery. (A) The histogram shows the total number of mRNAs and ncRNAs discovered in the present study. (B) Cluster analysis for the major ncRNAs shows dramatic expression changes between 1C and 2C, except for miRNAs, whose small size precluded analysis. (C) ncRNAs are more actively transcribed than mRNAs. Relatively few RNAs are specifically transcribed in p1C and p4C embryos compared with normal development. (D) Our RNA-seq assay discovered 5364 mRNAs that are not detected with microarrays. (FPKM) Fragments per kilobase of exon per million mapped reads, a unit of digital gene expression level; (Oo) oocyte.
Table 2.
Major category of ncRNA species profiled with the RNA-seq assay
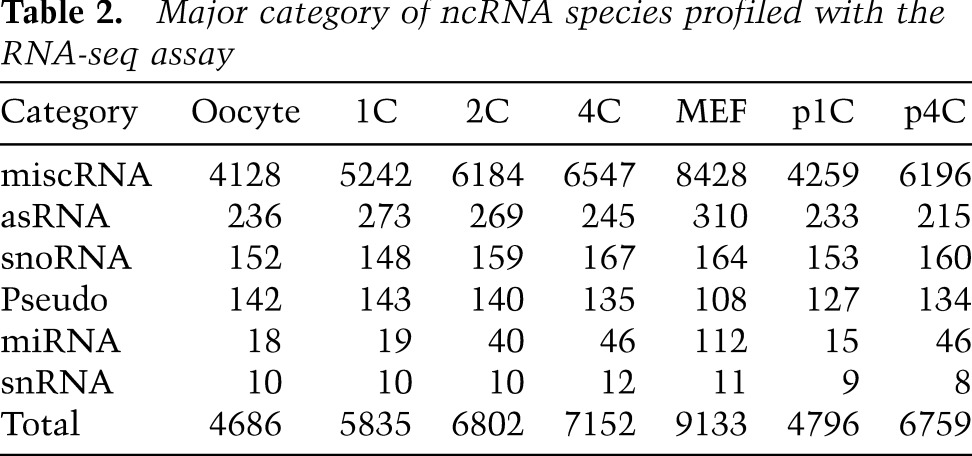
Mature microRNAs (miRNAs) were too short to be sequenced here. Indeed, the maternal miRNA let-7 family (Tang et al. 2007) was not detected. However, several miRNA precursors were identified (Table 2); in particular, mir-290 (Svoboda and Flemr 2010) appeared at 4C and p4C, suggesting a fertilization-independent function. The mir-17 family was specifically transcribed at 4C but not p4C, suggesting that this is a candidate zygotic miRNA initiated by fertilization. Additionally, stage-specific ncRNAs were identified more frequently than coding RNAs in fertilized oocytes (Fig. 2C).
Next, we sought to assess the overlap of our RNA-seq assay with public array-based profiles (Hamatani et al. 2004; Zeng et al. 2004). As shown in Figure 2D, our RNA-seq assay covered almost all of the genes detected with microarrays. Our assay uniquely identified 5364 genes that were expressed at oocytes, 1C, or 2C. Here, we detected 4125 genes at oocytes, whereas other profiles detected a much smaller set of genes at this stage: 36.3% (1496) with an Agilent microarray platform (Pfeiffer et al. 2011), 39.7% (1636) with a single-cell SOLiD system (Tang et al. 2009), and 31.9% (1317) with an Illumina GA (Macfarlan et al. 2012). This comparison indicated that the present study successfully identified a more complete picture of the transcriptome than was achieved by previous studies.
Analysis of differential gene expression
Pairwise comparisons suggest repressive and selective expression changes
To analyze differentially expressed genes, we applied Cuffdiff (Trapnell et al. 2012) to our RNA-seq data set (Fig. 3A). Using a threshold of 1.5-fold change (Liu et al. 2010), the analysis showed a transcriptionally repressive state: 3798 maternal transcripts were down-regulated in the oocyte-to-1C transition, reflecting rapid degradation of maternal RNAs. Additionally, 5950 maternal transcripts were down-regulated throughout 2C and 4C, and 4967 and 3541 transcripts were repressed during the 1C-to-2C and 2C-to-4C transitions, respectively. The numbers of transcripts showing repression were markedly higher than those showing up-regulation during the transitions, even when more stringent thresholds were used.
Figure 3.
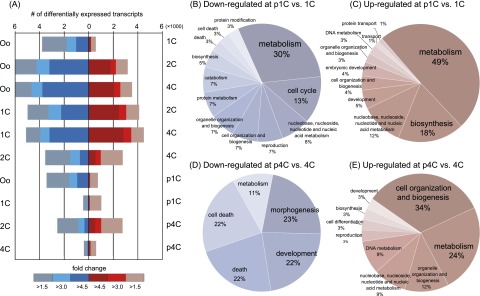
Gene expression changes and significant parthenogenetic biological processes. (A) Differential gene expression in all of the possible pairs. (B–E) Representative GO:BP terms enriched in parthenotes (fold change > 1.5). (Oo) Oocyte.
Our analysis showed that certain transcripts appeared immediately after fertilization. A few transcripts (596) were up-regulated during the oocyte-to-1C transition; however, 64% (383 out of 596) of these were not up-regulated during the oocyte-to-p1C transition. Since most of the transcripts (380 out of 383) exhibited a >1.5-fold suppression following treatment with the transcription inhibitor α-amanitin (Supplemental Fig. S7B), we speculated that the up-regulation reflected nascent transcription by minor ZGA (Wang and Dey 2006). However, 329 out of the 383 transcripts are also expressed in sperm (Kobayashi et al. 2012). Since these transcripts did not appear in p1C embryos, we conclude that coordination between minor ZGA and sperm-borne RNAs contributed to the increased RNAs at 1C and suggest that the up-regulated transcripts at 1C were “primed” by the sperm. Approximately 45% (173 out of 383) of the transcripts also showed up-regulation during the 1C-to-2C transition; as 150 of these were expressed in sperm, this again suggested that the majority were sperm-primed nascent transcripts. These genes included Spz1, Smad7, and the potential pluripotency regulators Pramel1, Pramel6, and Pramel7 (Wang et al. 2001; Casanova et al. 2011; Hirata et al. 2012).
We also identified a dramatic change in expression during the 1C-to-2C transition, in which 4967 and 4082 transcripts were down-regulated and up-regulated, respectively, at 2C relative to 1C. The three genes showing the greatest down-regulation at 2C were Psrc1, Dnmt3a, and Acsl3, and the most highly up-regulated genes at this stage were Dppa4, Timd2, and Rpl34-ps1. This substantial change is possibly coupled to the onset of the major ZGA that replaces maternal RNAs with zygotic RNAs (Latham et al. 1991; Schultz 2002).
Parthenotes show a distinct pattern of gene expression
A pairwise comparison of 1C and p1C (Fig. 3A) identified 2.3 times more up-regulated transcripts than down-regulated transcripts at p1C relative to 1C; however, this difference was reduced to 1.5 times in a 4C-to-p4C comparison. We analyzed the overrepresented gene ontology biological process (GO:BP) terms among these differentially expressed genes using DAVID (Database for Annotation, Visualization, and Integrated Discovery) (Huang et al. 2009) and categorized them into representative GO terms using CateGOrizer (Hu et al. 2008). This analysis showed that at p1C, parthenogenesis repressed expression of genes involved in the cell cycle, apoptosis, and protein metabolism (Fig. 3B) but activated genes involved in biosynthesis and protein transport (Fig. 3C). At p4C, the repression of apoptosis-related genes was still present (Fig. 3D), and chromatin-related processes were activated (Fig. 3E).
Our results are consistent with a previous report that parthenotes exhibit a high level of mRNA production at 2C and delay degradation to the normal level until late in 4C (Bui et al. 2011). Furthermore, our GO term analysis revealed that parthenotes must restrain zygotic cell division and preferentially recruit maternal proteins and mRNAs. Therefore, successful zygotic progression is likely under the control of aberrant gene expression as well as appropriate recruitment of pre-existing maternal and other factors.
Clustering of global gene expression patterns
The zygotic transcription program consists of alternating waves
To assess global gene expression patterns in the embryos, we performed a hierarchical clustering analysis of the normalized RNA abundance of RefSeq genes (Fig. 4A); this analysis identified 25 clusters (Supplemental Fig. S4). We categorized the clusters using the categories of programmed waves suggested by Wang and Dey (2006); namely, maternal RNA (clusters 1–4), minor ZGA (clusters 5–8), major ZGA (clusters 14–16), MGA (clusters 21 and 22), stage-specific transients (clusters 23–25), and the transitional patterns minor ZGA to MGA (clusters 9–11), maternal to ZGA (clusters 12 and 13), and maternal to MGA (clusters 17–20).
Figure 4.

Temporal gene expression patterns and their functional associations. (A,B) Hierarchical clustering of normalized expression levels results in 25 expression patterns. (C) Representative GO terms enriched in each pattern (P < 0.01) showing that minor ZGA is involved in broad developmental processes. (Oo) Oocyte.
Our analysis revealed gene expression patterns that had not been defined in previous studies (Fig. 4B). For example, 94.3% of the maternal RNAs were rapidly degraded at 2C (clusters 1 and 2); degradation of the remainder was delayed and completed at 4C (clusters 3 and 4). The major ZGA pattern showed peak RNA levels at 2C following either steady (cluster 14) or dramatic (clusters 15 and 16) increases; these levels then declined. The MGA pattern included a rapid increase from 2C (cluster 21) and a steady increase by 4C (cluster 22). In the minor ZGA pattern, cluster 5 showed a rapid decline in RNAs at 2C compared with clusters 6–8. It is possible that genes in cluster 5 undergo substantial translation, which is essential for minor ZGA (Hamatani et al. 2004). Some genes in the minor ZGA pattern were actively transcribed again at 4C (cluster 10) to contribute to MGA (minor ZGA to MGA).
The minor ZGA wave initiates a range of developmental processes
To search for correlations between expression patterns and developmental processes, we first prepared gene subsets that were highly correlated with the cluster means (Pearson's correlation >0.95). Next, we performed a GO term enrichment analysis. This analysis yielded 36 GO terms representing 202 GO:BP terms found from DAVID (Fig. 4C; Supplemental Table S3).
An overview of the general and specific roles of the expression waves in development is presented in Figure 4C. Basal processes (biosynthesis and metabolism) were prevalent in the patterns. Cell communication processes that involve signal transduction were required for not only oocyte maturation (Zeng et al. 2004; Gilchrist 2011) but also zygote developmental competence (Fig. 4C, [1]). Stage-specific transients showed a response to stress and external stimuli (Fig. 4C, [2]). In addition, transitional maternal mRNAs were involved in membrane-related processes as well as the production of pyruvate, lactate, and triglycerides (Fig. 4C, [3]). The energy supply pathway is directly relevant to development (Sturmey et al. 2009; Ufer and Wang 2011).
Remarkably, the minor ZGA pattern was involved in a wide range of biological processes that are initiated upon fertilization (Fig. 4C, [4]). Some of the processes were enriched again during the minor ZGA-to-MGA transition, indicating the possible functional importance of reactivated minor ZGA genes. Thus, genes enhanced at 1C may have an essential impact on not only the onset of gene activation but also the control of zygotic progression.
Discovering fertilization-specific mRNAs and their functions
Categorizing transcripts first detected after oocyte activation
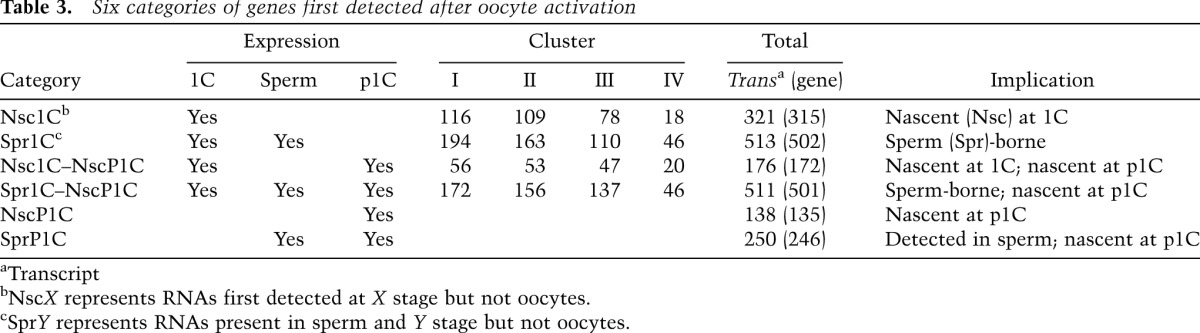
To examine the potential link between fertilization and transcriptional initiation, we searched for genes that were not expressed at oocytes but were expressed at 1C and/or in sperm. We used public mRNA-seq data for spermatozoa (Kobayashi et al. 2012) and then profiled the expression levels of transcripts at oocytes, 1C, and p1C and in spermatozoa. We then retrieved the transcripts that indicated that RNAs and their proteins were not detected at oocytes in our profile and public proteome data (Wang et al. 2010; Pfeiffer et al. 2011). Next, we categorized the transcripts into six groups according to their expression states, as described in Table 3 (Nsc: nascent, representing mRNAs that appeared after oocyte activation; Spr: sperm, representing mRNAs present in spermatozoa). To clarify the involvement of these transcripts during development, we clustered their expression changes into four waves (Table 3; Supplemental Table S4): 1C transient (cluster I), activation increasing to 4C (cluster II), 2C transient (cluster III), and transition fluctuating from 1C to 4C (cluster IV).
Table 3.
Six categories of genes first detected after oocyte activation
Functional analysis reveals sperm-delivered signals
We analyzed GO term enrichment for the categorized genes and found 26 terms representing 144 GO:BP terms from DAVID (Supplemental Table S5). Three principal points emerged from the results. First, genes expressed at p1C are involved in a wide range of biological processes, many of which were also found at 1C. These include male-specific reproduction processes, even though a paternal genome was not present (e.g., Acsbg2, Adam18, Adam24, Spata20, Stra8, and Taf7l in Spr1C–NscP1C). Second, genes in Nsc1C were involved in phospholipase activity and G-protein-coupled receptor (GPCR) signaling pathways known to trigger Ca2+ oscillations (Williams et al. 1996; Saunders et al. 2002). By mapping the categorized genes onto the calcium signaling pathway in KEGG (Kyoto Encyclopedia of Genes and Genomes) (Kanehisa et al. 2012), we confirmed that the gene usage of fertilized oocytes differed from that of parthenotes for GPCR in the pathway (Supplemental Fig. S5A). Unexpectedly, Plcz1 (Ramadan et al. 2012) was detected in the map as in Spr1C–NscP1C, suggesting that parthenotes also use this putative sperm-specific phospholipase. Finally, genes in Spr1C were highly involved in processes initiated during minor ZGA. Mitogen-activated protein kinase (MAPK) activity was the most prominent, a finding consistent with previous reports (Sun et al. 1999; Fan and Sun 2004; Liu et al. 2010). By mapping the genes onto the KEGG pathway, we also identified three extracellular signaling molecules that were not detected at oocytes (Supplemental Fig. S5B): brain-derived neurotrophic factor (Bdnf), Fas ligand (Fasl), and Cd14 antigen. Bdnf (Kawamura et al. 2005) was in the activation pattern (cluster II), suggesting an increased requirement for Bdnf during development. In contrast, Fasl (Kelkar et al. 2003) and Cd14 were in the 1C transient (cluster I) and 2C transient (cluster III) patterns, respectively. These results suggested that some sperm-borne factors localized on the sperm cell surface are related to apoptotic and immunological pathways that are depleted during parthenogenetic development.
Identification of specific promoter signatures for successful development
Nsc1C gene promoters contain highly distinctive TF-binding motifs
The promoter architecture of genes from the six categories (Table 3) were analyzed for enrichment of JASPAR TF-binding motifs (Vlieghe et al. 2006) in the core promoter sequences spanning −1000 to +200 bp from the transcription start sites (TSSs). These sites have been previously shown to be hypomethylated in germ cells (Kobayashi et al. 2012). We found 103 significant motifs (Fig. 5). Interestingly, Nsc1C exhibited highly distinct motifs that were particularly prominent in the 1C transient (cluster I) and activation (cluster II) patterns. In addition, TBP- and Sp1-binding motifs, which are thought to be required after fertilization (Worrad et al. 1994; Gazdag et al. 2007), appeared in different gene categories: TBP-dependent genes in Nsc1C and Sp1-dependent genes in Spr1C and Spr1C–NscP1C. Parthenotes (NscP1C, SprP1C, and Spr1C–NscP1C) showed Sp1-binding motifs but not TBP-binding motifs. These results suggest that the regulatory codes for TFs during normal development are distinctively different from those in parthenogenetic development.
Figure 5.
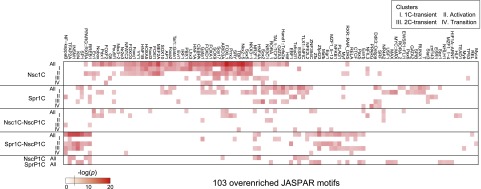
Analysis of TF-binding motif enrichment. Heat map showing enriched TF-binding motifs in core promoters (P < 0.01). (Nsc) Nascent; (Spr) sperm.
Five TFs potentially important for initial gene activation
We searched for TFs that might be important for regulating the six gene categories by constructing a network of TFs known to bind to the JASPAR motifs in TRANSFAC (Wingender et al. 2000). The network was composed of 53,229 edges among 1897 nodes (Fig. 6A; Supplemental Fig. S6). The nodes consisted of 97 maternal TFs, 11 nonmaternal TFs first detected after oocyte activation, and their target genes. Additionally, eight of the 11 nonmaternal TFs showed self-regulation (Fig. 6C), suggesting a requirement for a “kickoff” TF to regulate itself. Sperm may prime the self-regulation to enable rapid responses, whereas nascent and parthenogenetic TFs may be modulated by alternative mechanisms.
Figure 6.

Inference of gene regulatory network. (A) Network including 53,229 directed edges among 1897 nodes (Supplemental Fig. S6 in high resolution). The edge direction is from 108 TFs (triangles) to target genes (circles). Dark-gray triangles represent TFs pooled at oocytes. The inset emphasizes the highest CC of non-TF genes in each category. (B) Overall distribution of CCs. (C) Distribution of targeted genes by 108 TFs. Color corresponds to the gene categories shown in Table 3. (Coeff.) Coefficient.
Higher TF–TF connectivity in the network may contribute to such alternative mechanisms. The clustering coefficient of a given gene quantifies the level of TF connectivity; i.e., the interregulation of TFs required for gene regulation. For example, as shown in Figure 6A, Pcdhgb2 contained motifs that are targeted by 11 maternal and three specific nonmaternal TFs (Mafb, Egr3, and Rreb1). The maternal TFs are suggested to simultaneously regulate the three nonmaternal TFs. Thus, expression of Pcdhgb2 can be properly modulated even if the specific TFs are initially absent in parthenotes. On average, a higher CC (>0.1) was observed in Spr1C–NscP1C (Fig. 6B), indicating that TFs necessary for commonly expressed genes in sperm and 1C and p1C embryos tightly modulate each other.
The most prevalent maternal TFs were high-mobility group (HMG) proteins (TCF and Sox families) and their cooperative partners (C/EBP and Sp/Klf families) (Fig. 6C), suggesting a significant role for nonhistone chromosomal proteins (Bianchi and Beltrame 1998; Beaujean et al. 2000; Gaillard and Strauss 2000). In contrast, Ap-1 family members specifically target Nsc1C genes and may mediate rapid stimulus response and cell development (Hess et al. 2004). The regulation of gene expression in Nsc1C particularly involved Foxd1 and Nkx2-5, which were expressed at 1C. This regulation involved Sox18 (Spr1C category) and Myod1 (Nsc1C category), which were also required for Spr1C genes. Our analysis suggested that Runx1 (Spr1C category) regulated Spr1C genes. Nfatc2, Hnf1a, and Sox9 appeared in parthenotes. Taken together, Foxd1 (CC = 0.14), Nkx2-5 (CC = 0.13), Sox18 (CC = 0.052), Myod1 (CC = 0.034), and Runx1 (CC = 0.058) are suggested to be potentially key TFs for successful development. In good agreement with this suggestion, these five TFs were not observed in parthenogenesis.
Discussion
Fertilization induces embryonic developmental competence in oocytes through precise and sequential regulation of the maternal and paternal genomes using inherited genetic and epigenetic molecules and by activating regulatory programs. During fertilization, the oocyte must accomplish a complex series of remarkable tasks, including completion and resumption of the cell cycle, remodeling of parental chromatin, and degradation and transition of maternal mRNAs (Schultz 2002; Wang and Dey 2006). Simultaneously, the sperm must deliver supercompacted paternal genome and other important factors to trigger oocyte activation (Ostermeier et al. 2004; Krawetz 2005; Miller et al. 2010; Erkek et al. 2013).
In this study, we sought to achieve a better understanding of the molecular bases of these dramatic events. To this end, we prepared a very large number of high-quality embryos and exploited high-throughput sequencing technologies. The ultralarge-scale whole-transcriptome data produced in this study showed high reproducibility among replicates, with improved coverage and/or depth. Our extensive transcriptome discovery was further complemented through use of comparative analyses.
We confirmed that a considerable transition in gene expression occurs between 1C and 2C (Supplemental Fig. S1). Interestingly, this expression change was observed for both ncRNAs and mRNAs. The amount of ncRNAs and mRNAs in fertilized embryos was greater than in parthenotes. This implies that the interplay between ncRNAs and mRNAs may be essential for normal development. Indeed, asRNAs detected at oocytes and 1C had a clear impact on the level of translation at 2C. BLAT (Kent 2002) exactly aligned the asRNA segments to coding sequences of 52 proteins identified in a proteomic assay (Wang et al. 2010); 41 of these proteins were reduced in abundance in zygotes compared with MII oocytes (Supplemental Table S6). In addition to polyadenylation controls (Oh et al. 2000; Schultz 2002), asRNAs may uncouple transcription from translation. Our analysis of differential gene expression demonstrated a transcriptionally repressed state during development (Fig. 3A), in agreement with previous reports (Schultz 2002; Bui et al. 2011). Therefore, gene silencing appears to be an essential mechanism in development, in a fashion similar to gene activation (Wang and Dey 2006). In good agreement with our observations, parthenotes, which arrest at the peri-implantation period, showed a defect that led to aberrant gene expression (Fig. 3).
We performed a comprehensive bioinformatics analysis to dissect temporal gene expression changes and their functional associations (Fig. 4). Our results showed programmed expression waves that were consistent with the widely accepted model of early embryo development (Wang and Dey 2006). Additionally, our results revealed new patterns of expression. For example, maternal-to-zygotic replacement occurred in distinct subsets of maternal RNAs. Also, one gene subset of the minor ZGA was reactivated at 4C. Remarkably, genes belonging to the minor ZGA pattern were largely associated with a broad range of biological processes that first commenced at 1C (Fig. 4C). Through a detailed investigation of 1C, we identified 834 transcripts for 817 genes that were present in this stage and/or in spermatozoa but not in MII oocytes and parthenotes (Table 3). Approximately 92% of these genes exhibited a >1.5-fold suppression at 1C following α-amanitin treatment (Supplemental Fig. S7C,D), which supports our interpretation of transcriptional activity by the minor ZGA at 1C. These genes were associated with the processes that the minor ZGA initiates at 1C (Supplemental Table S5) and provided support for the biological significance of signal transduction, such as GPCRs (Williams et al. 1996; Saunders et al. 2002) and MAPK (Sun et al. 1999; Kelkar et al. 2003; Fan and Sun 2004; Kawamura et al. 2005; Liu et al. 2010), which were not enriched in parthenotes. Our data suggest that, immediately after fertilization, the minor ZGA program initiates the transient or continuous activities of important biological processes by incorporating newly synthesized and sperm-borne RNAs as the potential triggers of zygotic genome activation.
To our surprise, the promoters regulating nascent RNAs at 1C contained significant TF-binding sites (Fig. 5). This indicates that specific TFs must be precisely recruited to the promoters. We identified 108 candidate TFs and found that 11 appeared after fertilization (Fig. 6C). In particular, Foxd1, Nkx2-5, Sox18, Myod1, and Runx1 were potential sperm-borne or 1C-synthesized TFs that were not present at oocytes or in parthenotes. In addition, the genes that commenced expression after normal fertilization were mostly downstream targets of maternal nonhistone chromosomal HMG proteins known to contribute to transcriptional initiation at 1C (Beaujean et al. 2000; Schultz 2002). These results suggest that to ensure the appropriate gene expression profile, the first genome activation program at 1C orchestrates maternal and sperm-primed factors by switching on highly distinctive genetic regulatory codes. Other parentally derived molecules, including ncRNAs and chromatin-associated proteins, are also likely to be involved in this program. If the paternal genome is absent, as in parthenotes, promiscuous gene expression occurs in which 2.3 times as many genes than normal are activated.
Throughout this study, we noted differences and similarities between parthenotes and normal embryos. Genes differentially expressed in parthenotes were associated with significantly distinct processes compared with normal embryos (Fig. 3B–E). However, genes first detected in p1C embryos were involved in many of the biological processes that were also noted for 1C (Supplemental Table S5). Therefore, the RNA profile of parthenotes would seem to suggest that a fertilization event had occurred despite the obvious absence of this event. The underlying basis for this apparent molecular similarity with normally fertilized oocytes remains unclear. Possibly, it may in part be explained by the higher interconnectivity of TFs for regulating genes commonly expressed in sperm and 1C and p1C (Fig. 6B). In other words, the oocytes can supply all of the TFs necessary for reprogramming via alternative pathways if the paternal genome is absent. In p1C embryos, large quantities of maternally derived molecules may be required in the regulatory network as triggers of ZGA (Fig. 6C), which possibly could result in excessive expression of maternal factors and delayed onset of gene activation. From this perspective, the presence of paternal factors is apparently essential for fine-tuning gene expression, which parthenotes cannot achieve. This may support a previous report that appropriate manipulation of genomic imprints leads to the normal development of parthenotes containing only maternal genomes (Kono et al. 2004).
In summary, our ultralarge-scale whole-transcriptome analysis of four early embryo stages provides an important resource for deciphering development after fertilization. Further investigations using the database built in this study will provide new insights into mammalian embryogenesis.
Materials and methods
Cell collection
We collected MII oocytes from the oviducts of 8- to 12-wk-old superovulated female BBF1 mice, which are F1 progeny from a cross between BALB/c females and C57BL/6 males. We collected oocytes from 40 superovulated mice each time. After removing cumulus cells, we manually collected high-quality MII oocytes (20–30 oocytes per mouse). These cells were either used for in vitro fertilization or parthenogenetically activated in M16 medium containing 5 mM SrCl2, 5 mM EGTA, and 5 μg/mL cytochalasin B for 30 min. In vitro fertilization was carried out in 50 μL of medium containing 10–30 oocytes; parthenogenetic activation was also carried out in 50 μL of medium but with 50 oocytes. After insemination or activation, 20 zygotes or activated oocytes were transferred to 20 μL of fresh M16 medium. Nocodazole (0.1 μg/mL) was added at 11, 31, or 46 h after insemination to induce cells to arrest at prometaphase of the first, second, or third mitosis, respectively (Fig. 1A). All cultures were examined every 24 h and also before the addition of nocodazole to check for embryos showing delayed development; these embryos were removed from the cultures. The first, second, and third mitotic embryos were harvested at 22, 46, and 57 h after insemination, respectively. All cells were washed in PBS containing 0.5% PVP and stored in liquid nitrogen until used for RNA preparation.
RNA preparation and sequencing
Total RNA (3–4 μg per stage) was prepared from 10,000 cells at each stage using Isogen II (Nippon Gene). To prepare sequence libraries, we first removed rRNA using a Ribo-Zero Gold kit (Epicentre, an Illumina company), which yielded ∼500 ng of RNA per stage. Next, we randomly fragmented the RNAs using RNase III provided in the SOLiD Total RNA-seq kit (product no. 4445374). After isolation with gel electrophoresis, we converted 100- to 200-bp RNA fragments to cDNA libraries in a strand-specific manner. Using the standard protocols from the SOLiD system user manual, the cDNA libraries were clonally amplified onto beads with emulsion PCR. We sequenced the library fragments on a SOLiD 5500xl system analyzer using standard run conditions and generated 50-bp single-ended short reads.
qRT–PCR
Total RNA (500 ng) from each stage was primed using Oligo(dT)20, and cDNA was synthesized using Superscript III (Invitrogen). Two percent of the synthesized cDNA and an appropriate set of primers (Supplemental Table S7) were mixed with Kapa SYBR Fast qPCR Master Mix (Kapa Biosystems) and subjected to qPCR following the manufacturer's instructions. All qPCR reactions were performed on an Applied Biosystems 7500 machine.
Read mapping and RNA quantification
We conducted TopHat (version 1.4.1)–Cufflinks (version 2.0.2) pipeline (Trapnell et al. 2012) with sequenced reads that had an average base call quality of >18. The pipeline was coupled with Bowtie (version 0.12.8) (Langmead et al. 2009). We recursively performed TopHat by truncating the 3′ end of unmapped reads and realigning the reads with more stringent parameters. We empirically set the parameters used sequentially as read length, “initial read mismatches,” “segment mismatches,” and “segment length”: 50, 3, 2, and 25; 46, 3, 2, and 23; 42, 3, 2, and 21; 38, 2, 0, and 19; and 34, 2, 0, and 17.
Using uniquely mapped reads, we quantified RNA abundance in units of fragments per kilobase of exon per million mapped reads (FPKM) of Cufflinks. After running Cuffcompare, Cuffdiff was used to assess differential gene expression. All transcripts satisfying several conditions (i.e., successful deconvolution, false discovery rate [FDR] <5%, complete match of intron chain if an annotation was given, and FPKM >0.001) were used for further analysis. The pipeline was run either without (Fig. 1B; Table 1) or with (Figs. 1E, 2A) RefSeq annotations. We prepared the reference genome (mm9) and RefSeq annotation from the UCSC Genome Browser (http://genome.ucsc.edu) and downloaded the ncRNA annotation from fRNAdb (Kin et al. 2007).
Transcription inhibition assay
Collection of oocytes from the oviduct, in vitro fertilization, nocodazole treatment, and harvest were carried out as described above, except that zygotes were transferred to 20 μL of M16 medium containing 10 μg/mL α-amanitin (Sigma, A2263) 3 h after insemination. Total RNA was prepared using Isogen II (Nippon Gene) from ∼2300 one-cell embryos arrested at first mitosis. For RNA-seq library construction, we used a TruSeq Standard Total RNA sample preparation kit (Illumina, nos. RS-122-2201 and RS-122-2202) and prepared 600 ng of RNAs. Sequencing was carried out on an Illumina HiSeq 2500 (Illumina) with a 100-bp paired-end protocol. We mapped the paired-end short reads (111,083,303; two reads) by the pipeline without recursive mapping and gained ∼68 million uniquely mapped reads (68,474,975 forward and 67,809,055 reverse), 96% of which were properly paired. Using these uniquely mapped reads from one-cell embryos treated with α-amanitin, we conducted Cuffdiff to assess α-amanitin-sensitive transcripts (Supplemental Fig. S7).
Preparing the public resource
We ran the pipeline without recursive mapping for RNA-seq data of the Illumina platform: SRA048261 (oocytes), SRA048260 (2C embryos), and DRA000484 (spermatozoa from C57BL/6N males). Recursive mapping was performed for GSE14605 (oocytes) of the SOLiD platform. We downloaded three array-based mRNA profiles: NIA 22K (Hamatani et al. 2004), Affymetrix MOE430 (Zeng et al. 2004), and Agilent 44K (Pfeiffer et al. 2011). If RefSeq information was not present, probe IDs were converted into UniGene IDs, and then the corresponding RefSeq IDs were retrieved. We downloaded mass spectrometry data from two studies (Wang et al. 2010; Pfeiffer et al. 2011) to screen for gene products. The normalized mass spectral count (Wang et al. 2010) was used to estimate the activity of asRNAs. To define promoter regions, we used 20,414 TSSs provided by DBTSS (Database of Transcriptional Start Sites, http://dbtss.hgc.jp).
Bioinformatics analysis
Enrichment of GO terms was analyzed using DAVID bioinformatics resources with BP ALL terms (Huang et al. 2009). Significant terms (EASE score <0.01) detected by DAVID were grouped into representative ancestor terms in the data set GO Slim2 by CateGOrizer (Hu et al. 2008). The clustering analysis was conducted using the function hclust of R language; Euclidean distances among FPKMs adjusted by quantile normalization and mean centering were clustered using the hierarchical average linkage method. For gene expression patterning, we cut the hierarchical tree at an empirically defined height at which the maternal degradation and the maternal-to-zygotic transition were clearly captured.
Significant TF-binding sites were detected by scanning core promoter regions spanning −1000 to +200 bp from TSSs with the nonredundant vertebrate JASPAR CORE, consisting of 130 motifs (Vlieghe et al. 2006). After collecting highly matched JASPAR motifs (>0.8) based on matrix similarity scores (Kel et al. 2003), we tested the significance of motif occurrences in three core promoter ranges (−200 to +50, −500 to +100, and −1000 to +200). This stepwise expansion of promoter regions prevents the possibility of overlooking the position dependency of TF-binding sites. Approximately 80% of the motifs that were significant (P < 0.01) in the hypergeometric distribution (Fisher's exact test) were found within −500 to +100 bp. Construction of a regulatory network was performed using TRANSFAC professional (released in January 2013), which provides a list of TFs that are known to bind to JASPAR motifs; after converting JASPAR motifs into matrices in TRANSFAC, we gathered mouse TFs targeting the matrices. We retained TFs if the mRNAs of their coding genes were present in our RNA-seq data. Using these potential regulatory links from TFs to promoters, we analyzed the network statistics using Cytoscape 3.0 (http://www.cytoscape.org).
Data access
RNA-seq data generated in this study have been deposited in the DDBJ (DNA Data Bank of Japan) Sequence Read Archive (DRA) under accession number DRA001066. We also developed the database DBTMEE (Database of Transcriptome in Mouse Early Embryos, http://dbtmee.hgc.jp).
Acknowledgments
We thank Dr. Takeo Kishimoto and Dr. Yuki Okada for helpful discussions. Computational resources were provided by the supercomputer system at the Human Genome Center, the Institute of Medical Science, the University of Tokyo. This work was supported by the Research Program of Innovative Cell Biology by Innovative Technology by the Ministry of Education, Culture, Sports, Science, and Technology-Japan. S.-J.P. had full access to all of the data in the study.
Footnotes
Supplemental material is available for this article.
Article is online at http://www.genesdev.org/cgi/doi/10.1101/gad.227926.113.
Freely available online through the Genes & Development Open Access option.
References
- Amanai M, Brahmajosyula M, Perry AC 2006. A restricted role for sperm-borne microRNAs in mammalian fertilization. Biol Reprod 75: 877–884 [DOI] [PubMed] [Google Scholar]
- Beaujean N, Bouniol-Baly C, Monod C, Kissa K, Jullien D, Aulner N, Amirand C, Debey P, Kas E 2000. Induction of early transcription in one-cell mouse embryos by microinjection of the nonhistone chromosomal protein HMG-I. Dev Biol 221: 337–354 [DOI] [PubMed] [Google Scholar]
- Bianchi ME, Beltrame M 1998. Flexing DNA: HMG-box proteins and their partners. Am J Hum Genet 63: 1573–1577 [DOI] [PMC free article] [PubMed] [Google Scholar]
- Bui HT, Wakayama S, Mizutani E, Park KK, Kim JH, Van Thuan N, Wakayama T 2011. Essential role of paternal chromatin in the regulation of transcriptional activity during mouse preimplantation development. Reproduction 141: 67–77 [DOI] [PubMed] [Google Scholar]
- Casanova EA, Shakhova O, Patel SS, Asner IN, Pelczar P, Weber FA, Graf U, Sommer L, Burki K, Cinelli P, et al. 2011. Pramel7 mediates LIF/STAT3-dependent self-renewal in embryonic stem cells. Stem Cells 29: 474–485 [DOI] [PubMed] [Google Scholar]
- Erkek S, Hisano M, Liang CY, Gill M, Murr R, Dieker J, Schubeler D, Vlag JV, Stadler MB, Peters AH 2013. Molecular determinants of nucleosome retention at CpG-rich sequences in mouse spermatozoa. Nat Struct Mol Biol 20: 868–875 [DOI] [PubMed] [Google Scholar]
- Fan HY, Sun QY 2004. Involvement of mitogen-activated protein kinase cascade during oocyte maturation and fertilization in mammals. Biol Reprod 70: 535–547 [DOI] [PubMed] [Google Scholar]
- Gaillard C, Strauss F 2000. High affinity binding of proteins HMG1 and HMG2 to semicatenated DNA loops. BMC Mol Biol 1: 1. [DOI] [PMC free article] [PubMed] [Google Scholar]
- Gazdag E, Rajkovic A, Torres-Padilla ME, Tora L 2007. Analysis of TATA-binding protein 2 (TBP2) and TBP expression suggests different roles for the two proteins in regulation of gene expression during oogenesis and early mouse development. Reproduction 134: 51–62 [DOI] [PubMed] [Google Scholar]
- Gilchrist RB 2011. Recent insights into oocyte–follicle cell interactions provide opportunities for the development of new approaches to in vitro maturation. Reprod Fertil Dev 23: 23–31 [DOI] [PubMed] [Google Scholar]
- Hamatani T, Carter MG, Sharov AA, Ko MS 2004. Dynamics of global gene expression changes during mouse preimplantation development. Dev Cell 6: 117–131 [DOI] [PubMed] [Google Scholar]
- Hess J, Angel P, Schorpp-Kistner M 2004. AP-1 subunits: Quarrel and harmony among siblings. J Cell Sci 117: 5965–5973 [DOI] [PubMed] [Google Scholar]
- Hirata T, Amano T, Nakatake Y, Amano M, Piao Y, Hoang HG, Ko MS 2012. Zscan4 transiently reactivates early embryonic genes during the generation of induced pluripotent stem cells. Sci Rep 2: 208. [DOI] [PMC free article] [PubMed] [Google Scholar]
- Hu Z-L, Bao J, Reecy J 2008. CateGOrizer: A Web-based program to batch analyze gene ontology classification categories. Online J Bioinformatics 9: 108–112 [Google Scholar]
- Huang DW, Sherman BT, Lempicki RA 2009. Systematic and integrative analysis of large gene lists using DAVID bioinformatics resources. Nat Protoc 4: 44–57 [DOI] [PubMed] [Google Scholar]
- Kanehisa M, Goto S, Sato Y, Furumichi M, Tanabe M 2012. KEGG for integration and interpretation of large-scale molecular data sets. Nucleic Acids Res 40: D109–D114 [DOI] [PMC free article] [PubMed] [Google Scholar]
- Kawamura K, Kawamura N, Mulders SM, Sollewijn Gelpke MD, Hsueh AJ 2005. Ovarian brain-derived neurotrophic factor (BDNF) promotes the development of oocytes into preimplantation embryos. Proc Natl Acad Sci 102: 9206–9211 [DOI] [PMC free article] [PubMed] [Google Scholar]
- Kel AE, Gossling E, Reuter I, Cheremushkin E, Kel-Margoulis OV, Wingender E 2003. MATCH: A tool for searching transcription factor binding sites in DNA sequences. Nucleic Acids Res 31: 3576–3579 [DOI] [PMC free article] [PubMed] [Google Scholar]
- Kelkar RL, Dharma SJ, Nandedkar TD 2003. Expression of Fas and Fas ligand protein and mRNA in mouse oocytes and embryos. Reproduction 126: 791–799 [DOI] [PubMed] [Google Scholar]
- Kent WJ 2002. BLAT-the BLAST-like alignment tool. Genome Res 12: 656–664 [DOI] [PMC free article] [PubMed] [Google Scholar]
- Kin T, Yamada K, Terai G, Okida H, Yoshinari Y, Ono Y, Kojima A, Kimura Y, Komori T, Asai K 2007. fRNAdb: A platform for mining/annotating functional RNA candidates from non-coding RNA sequences. Nucleic Acids Res 35: D145–D148 [DOI] [PMC free article] [PubMed] [Google Scholar]
- Ko MS, Kitchen JR, Wang X, Threat TA, Hasegawa A, Sun T, Grahovac MJ, Kargul GJ, Lim MK, Cui Y, et al. 2000. Large-scale cDNA analysis reveals phased gene expression patterns during preimplantation mouse development. Development 127: 1737–1749 [DOI] [PubMed] [Google Scholar]
- Kobayashi H, Sakurai T, Imai M, Takahashi N, Fukuda A, Yayoi O, Sato S, Nakabayashi K, Hata K, Sotomaru Y, et al. 2012. Contribution of intragenic DNA methylation in mouse gametic DNA methylomes to establish oocyte-specific heritable marks. PLoS Genet 8: e1002440. [DOI] [PMC free article] [PubMed] [Google Scholar]
- Kono T, Obata Y, Wu Q, Niwa K, Ono Y, Yamamoto Y, Park ES, Seo JS, Ogawa H 2004. Birth of parthenogenetic mice that can develop to adulthood. Nature 428: 860–864 [DOI] [PubMed] [Google Scholar]
- Krawetz SA 2005. Paternal contribution: New insights and future challenges. Nat Rev Genet 6: 633–642 [DOI] [PubMed] [Google Scholar]
- Langmead B, Trapnell C, Pop M, Salzberg SL 2009. Ultrafast and memory-efficient alignment of short DNA sequences to the human genome. Genome Biol 10: R25. [DOI] [PMC free article] [PubMed] [Google Scholar]
- Latham KE, Garrels JI, Chang C, Solter D 1991. Quantitative analysis of protein synthesis in mouse embryos. I. Extensive reprogramming at the one-and two-cell stages. Development 112: 921–932 [DOI] [PubMed] [Google Scholar]
- Liu N, Enkemann SA, Liang P, Hersmus R, Zanazzi C, Huang J, Wu C, Chen Z, Looijenga LH, Keefe DL, et al. 2010. Genome-wide gene expression profiling reveals aberrant MAPK and Wnt signaling pathways associated with early parthenogenesis. J Mol Cell Biol 2: 333–344 [DOI] [PubMed] [Google Scholar]
- Macfarlan TS, Gifford WD, Driscoll S, Lettieri K, Rowe HM, Bonanomi D, Firth A, Singer O, Trono D, Pfaff SL, et al. 2012. Embryonic stem cell potency fluctuates with endogenous retrovirus activity. Nature 487: 57–63 [DOI] [PMC free article] [PubMed] [Google Scholar]
- Miller D, Brinkworth M, Iles D 2010. Paternal DNA packaging in spermatozoa: More than the sum of its parts? DNA, histones, protamines and epigenetics. Reproduction 139: 287–301 [DOI] [PubMed] [Google Scholar]
- Oh B, Hwang S, McLaughlin J, Solter D, Knowles BB 2000. Timely translation during the mouse oocyte-to-embryo transition. Development 127: 3795–3803 [DOI] [PubMed] [Google Scholar]
- Ostermeier GC, Miller D, Huntriss JD, Diamond MP, Krawetz SA 2004. Reproductive biology: Delivering spermatozoan RNA to the oocyte. Nature 429: 154. [DOI] [PubMed] [Google Scholar]
- Pfeiffer MJ, Siatkowski M, Paudel Y, Balbach ST, Baeumer N, Crosetto N, Drexler HC, Fuellen G, Boiani M 2011. Proteomic analysis of mouse oocytes reveals 28 candidate factors of the ‘reprogrammome.’. J Proteome Res 10: 2140–2153 [DOI] [PubMed] [Google Scholar]
- Piko L, Clegg KB 1982. Quantitative changes in total RNA, total poly(A), and ribosomes in early mouse embryos. Dev Biol 89: 362–378 [DOI] [PubMed] [Google Scholar]
- Ramadan WM, Kashir J, Jones C, Coward K 2012. Oocyte activation and phospholipase C ζ (PLCζ): Diagnostic and therapeutic implications for assisted reproductive technology. Cell Commun Signal 10: 12. [DOI] [PMC free article] [PubMed] [Google Scholar]
- Santenard A, Ziegler-Birling C, Koch M, Tora L, Bannister AJ, Torres-Padilla ME 2010. Heterochromatin formation in the mouse embryo requires critical residues of the histone variant H3.3. Nat Cell Biol 12: 853–862 [DOI] [PMC free article] [PubMed] [Google Scholar]
- Saunders CM, Larman MG, Parrington J, Cox LJ, Royse J, Blayney LM, Swann K, Lai FA 2002. PLCζ: A sperm-specific trigger of Ca2+ oscillations in eggs and embryo development. Development 129: 3533–3544 [DOI] [PubMed] [Google Scholar]
- Schultz RM 2002. The molecular foundations of the maternal to zygotic transition in the preimplantation embryo. Hum Reprod Update 8: 323–331 [DOI] [PubMed] [Google Scholar]
- Smith ZD, Chan MM, Mikkelsen TS, Gu H, Gnirke A, Regev A, Meissner A 2012. A unique regulatory phase of DNA methylation in the early mammalian embryo. Nature 484: 339–344 [DOI] [PMC free article] [PubMed] [Google Scholar]
- Sturmey RG, Reis A, Leese HJ, McEvoy TG 2009. Role of fatty acids in energy provision during oocyte maturation and early embryo development. Reprod Domest Anim 44: 50–58 [DOI] [PubMed] [Google Scholar]
- Sun QY, Lax Y, Rubinstein S, Chen DY, Breitbart H 1999. Mitogen-activated protein kinase and cell cycle progression during mouse egg activation induced by various stimuli. Z Naturforsch C 54: 285–294 [DOI] [PubMed] [Google Scholar]
- Svoboda P, Flemr M 2010. The role of miRNAs and endogenous siRNAs in maternal-to-zygotic reprogramming and the establishment of pluripotency. EMBO Rep 11: 590–597 [DOI] [PMC free article] [PubMed] [Google Scholar]
- Tan MH, Au KF, Yablonovitch AL, Wills AE, Chuang J, Baker JC, Wong WH, Li JB 2013. RNA sequencing reveals a diverse and dynamic repertoire of the Xenopus tropicalis transcriptome over development. Genome Res 23: 201–216 [DOI] [PMC free article] [PubMed] [Google Scholar]
- Tang F, Kaneda M, O'Carroll D, Hajkova P, Barton SC, Sun YA, Lee C, Tarakhovsky A, Lao K, Surani MA, et al. 2007. Maternal microRNAs are essential for mouse zygotic development. Genes Dev 21: 644–648 [DOI] [PMC free article] [PubMed] [Google Scholar]
- Tang F, Barbacioru C, Wang Y, Nordman E, Lee C, Xu N, Wang X, Bodeau J, Tuch BB, Siddiqui A, et al. 2009. mRNA-Seq whole-transcriptome analysis of a single cell. Nat Methods 6: 377–382 [DOI] [PubMed] [Google Scholar]
- Trapnell C, Roberts A, Goff L, Pertea G, Kim D, Kelley DR, Pimentel H, Salzberg SL, Rinn JL, Pachter L, et al. 2012. Differential gene and transcript expression analysis of RNA-seq experiments with TopHat and Cufflinks. Nat Protoc 7: 562–578 [DOI] [PMC free article] [PubMed] [Google Scholar]
- Ufer C, Wang CC 2011. The roles of glutathione peroxidases during embryo development. Front Mol Neurosci 4: 12. [DOI] [PMC free article] [PubMed] [Google Scholar]
- Vassena R, Boue S, Gonzalez-Roca E, Aran B, Auer H, Veiga A, Izpisua Belmonte JC 2011. Waves of early transcriptional activation and pluripotency program initiation during human preimplantation development. Development 138: 3699–3709 [DOI] [PMC free article] [PubMed] [Google Scholar]
- Vlieghe D, Sandelin A, De Bleser PJ, Vleminckx K, Wasserman WW, van Roy F, Lenhard B 2006. A new generation of JASPAR, the open-access repository for transcription factor binding site profiles. Nucleic Acids Res 34: D95–D97 [DOI] [PMC free article] [PubMed] [Google Scholar]
- Wang H, Dey SK 2006. Roadmap to embryo implantation: Clues from mouse models. Nat Rev Genet 7: 185–199 [DOI] [PubMed] [Google Scholar]
- Wang PJ, McCarrey JR, Yang F, Page DC 2001. An abundance of X-linked genes expressed in spermatogonia. Nat Genet 27: 422–426 [DOI] [PubMed] [Google Scholar]
- Wang QT, Piotrowska K, Ciemerych MA, Milenkovic L, Scott MP, Davis RW, Zernicka-Goetz M 2004. A genome-wide study of gene activity reveals developmental signaling pathways in the preimplantation mouse embryo. Dev Cell 6: 133–144 [DOI] [PubMed] [Google Scholar]
- Wang S, Kou Z, Jing Z, Zhang Y, Guo X, Dong M, Wilmut I, Gao S 2010. Proteome of mouse oocytes at different developmental stages. Proc Natl Acad Sci 107: 17639–17644 [DOI] [PMC free article] [PubMed] [Google Scholar]
- Williams CJ, Schultz RM, Kopf GS 1996. G protein gene expression during mouse oocyte growth and maturation, and preimplantation embryo development. Mol Reprod Dev 44: 315–323 [DOI] [PubMed] [Google Scholar]
- Wingender E, Chen X, Hehl R, Karas H, Liebich I, Matys V, Meinhardt T, Pruss M, Reuter I, Schacherer F, et al. 2000. TRANSFAC: An integrated system for gene expression regulation. Nucleic Acids Res 28: 316–319 [DOI] [PMC free article] [PubMed] [Google Scholar]
- Worrad DM, Ram PT, Schultz RM 1994. Regulation of gene expression in the mouse oocyte and early preimplantation embryo: Developmental changes in Sp1 and TATA box-binding protein, TBP. Development 120: 2347–2357 [DOI] [PubMed] [Google Scholar]
- Zeng F, Baldwin DA, Schultz RM 2004. Transcript profiling during preimplantation mouse development. Dev Biol 272: 483–496 [DOI] [PubMed] [Google Scholar]