Abstract
Background
Considering governmental scrutiny and financial constraints in medicine, the need for improved performance, which can provide acceptable care for medical consumers, leads to the conduct of new managerial methods to improve effectiveness.
Aims
This study aimed to compare performance indicators of obstetrics and gynaecology teaching hospitals in Tabriz.
Method
A longitudinal, retrospective study was conducted to compare performance indexes of Tabriz obstetrics and gynaecology teaching hospitals during 2010-2012. Al-Zahra is Tabriz’s central teaching hospital in obstetrics and gynaecology that is authorised under a board of trustees as an autonomous hospital and Taleghani hospital is managed under centralised administration. Study variables included: Average Length of Stay (ALOS), Bed Occupancy Rate (BOR), and Bed Turnover Ratio (BTR). The data was extracted via the Hospital Information Systems (HIS) within the hospitals' admission and discharge units. Pabon Lasso model was used to assess hospital performance. Data was analysed and graphs were plotted using the SPSS-17 software package.
Results
According to study findings, overall ALOS in Al-Zahra hospital is 3.15 (2.15) days (1.88 (0.97) days for prenatal wards and 6.13 (0.97) days for neonatal wards) and ALOS in Taleghani Hospital is 3.37 (3.09) days (1.74 (0.14) days for perinatal wards and 5.96 (3.55) days for neonatal wards). In this regard, Al-Zahra hospital holds the maximum BOR with 86.92 per cent and the minimum BOR was attributed to Taleghani hospital at 68.44 per cent (P<0.001). Study findings indicate that BOR in neonatal wards is greater than prenatal wards. On the other hand, BOR in Al-Zahra is greater than Taleghani (P<0.001), whereas BOR trend shows an increasing pattern in both hospitals.
Conclusion
Results of this study showed that the performance of Al- Zahra Hospital is better than Taleghani Hospital. These two hospitals are similar in different aspects except Al-Zahra is under a board of trustees and Taleghani is not. We should also consider that Al-Zahra Hospital has more facilities than Taleghani.
Keywords: Performance, Obstetrics and Gynaecology hospital, Pabon Lasso, Administration Models, Autonomisation
What this study adds:
Managerial differences can play a major role in the performance indictor of hospitals in similar environments.
Managing hospitals according to a board of trustees can be used to improve hospital performance.
Collaboration among hospitals in a region can lead to improvement in using available resources.
Background
Evaluating health care system performance is an essential component in improving health care systems in developing countries.1 In this regard, improving healthcare organisations’ performance is crucial for both professionals and clients.2,3 Thus, information about physicians’ and hospitals’ operations is increasingly used for monitoring and enhancing services.2, 4
Healthcare organisations are expected to perform in a complex environment.5 Goals of and expectations from health care organisations are different, so performance of these settings should be viewed from a multidimensional aspect3. When measuring an organisation’s performance, all aspects of a single sector should be assessed to determine efficiency and effectiveness of their action in providing services.5 Despite the dual presence of governmental sectors and private institutions in medical organisation performance assessment, a wide range of employees are engaged and new methods of participation and strategies emerge to evaluate performance.4,6 Evaluating health care performance can be challenging and the cost effectiveness of such projects is controversial.1 Lack of data and doubts about the reliability of existing data are two reasons for concern. Another reason is that the available data is not collected consecutively and constantly. Another major difficulty is feasibility of assessment tools which, in part, can lead to quick and acceptable results in a transparent manner.1,5,7 Considering governmental pressure and financial constraints, the need for improved performance, which can provide acceptable care for consumers, cultivates new research for the introduction of effective assessment tools.5
Using indicators that demonstrate evolution over time is an effective way for assessment of health care services’ performance and management that could provide an appropriate analogy with internal and external references.4 Consequently, applying new methods and strategies should be considered as well as modifying current mechanisms to achieve the maximum hospital performance. Additionally, further research should be incorporated to probe indicated factors that lead to low efficiency in hospitals along with the introduction of more practical ways to control them.8
The Pabon Lasso model is the one of the most notable methods for hospital performance assessment which uses three indicators including: 1. Bed Occupancy Rate (BOR) 2. Bed Turnover Rate (BTR) 3. Average Length of Stay (ALOS).8,9 This model is one of the most convenient methods for comparing either different hospitals’ or different wards’ performance.9 Data gathered via the Pabon Lasso indicators could be used to identify areas of strength and weakness for each hospital.
On the other hand, different approaches are available to assist hospital management. One example is a board of trustees that has been used for years in some hospitals in Iran according to the use of autonomisation as a strategy for performance improvement of hospitals. A hospital board of trustees is an autonomous managerial pattern aimed to promote hospital performance and public satisfaction by applying employee performance management strategies, performance based budgeting, outsourcing, maintenance management, the establishment of a comprehensive information system, and clinical governance. In autonomous hospitals, in contrast to budgetary hospitals managed by administers, decisions are made by a group and with participation of the community and the university members.10, 11 The hospital board of trustees includes the administrator of the university as head of board, the administrator of the hospital as assistant of board, a management expert, a donor as an agent of society in the health system, academic members, and a representative of government. According to the act of hospital autonomisation, 54 hospitals have been managed in this manner since 2009. Al-Zahra Hospital in Tabriz is one of the Tabriz University Hospitals that are managed in this manner. Considering the objectives of the Board, it appears this managerial method is an effective method for improving hospital performance.11-13 Contrary to this method, centralised administration of a hospital as a budgetary organisation has limited authority in the allocation and management of resources; it appears this fact can restrict these management teams in hospital improvements by conducting optional programs.11
Al-Zahra is Tabriz’s main academic hospital in obstetrics and gynaecology that is administered by a board of trustees. On the other hand, Taleghani Hospital is managed under a centralised administration of Tabriz University of medical sciences. These two hospitals employ the same professionals, and the only difference is in the type of their management method. As mentioned before, Pabon Lasso could be applied to compare different hospitals’ performance.14 Studies on capacity utilisation using the Pabon Lasso technique have not previously been conducted in accordance to managerial differences between obstetrics and gynaecology hospitals in Iran. In this study, we aimed to evaluate the performance of obstetrics and gynaecology hospitals of Tabriz by using the Pabon Lasso model to make comparisons between the two hospitals and to determine whether the hospital managed by a board of trustees provided a better performance or not.
Method
A longitudinal, retrospective study was conducted to compare performance indexes of Tabriz obstetrics and gynaecology teaching hospitals during 2010-2012. Al-Zahra is Tabriz’s main academic hospital in obstetrics and gynaecology that is administered by a board of trustees. On the other hand, Taleghani Hospital is managed under a centralised board of directors of Tabriz University of Medical Sciences.
Data collection was performed with the use of questionnaires that were constructed based on a Pabon Lasso Model. The first section of the questionnaire contains general data such as total number of beds, number of active beds, number of hospital wards, etc. The second part of the questionnaire focuses on data retrieved from hospital admission and discharge units including BOR, number of admissions, number of discharged patients, number of deaths and, due to the hospital specialty, Caesarean section rates. Study variables included were ALOS, BOR, and Bed Turnover Ratio (BTR). The Pabon Lasso graph attributed hospitals into four categories:
Hospitals with low BTR and low BOR indicative of a surplus of hospital beds compared to demand (Zone 1).
Hospitals in Zone 2 are characterised with high BTR and low BOR indicative of unnecessary hospitalisations and oversupply of beds.
Hospitals in Zone 3 with high BTR and high BOR have reached an appropriate level of efficiency.
Hospitals in Zone 4 have low BTR and high BOR; these are either serving patients with chronic illnesses or have an unnecessarily long LOS. The data was accumulated by implementing Hospital Information System (HIS) pertaining to hospitals admission and discharge units.
Due to differences in performance, indices were calculated for the hospital as a whole and for the two different wards, separately. Independent Samples Test was used to compare BOR, BTR and ALOS between hospitals. According to the Pabon Lasso model, the information regarding hospital performance was used for analyses and attributed to the functional status of hospitals. Indices calculated for the hospitals and wards in target years were placed on a Pabon Lasso graph and further analysis of the results was based on each of hospitals’ and wards’ relative position on this graph. Data was analysed and graphs were plotted using the SPSS- 17 software package (SPSS, Chicago, IL, USA). P values ≤ 0.05 were considered as statistically significant.
Results
The performance indicators of hospital wards according to neonatal and prenatal categories and total performance indicators of hospitals are summarised in Table 1. The table presents data about BOR, BTR, and ALOS. Our study findings indicate that overall ALOS in Al-Zahra hospital is 3.15 (2.15) days (1.88 (0.97) days for prenatal wards and 6.13 (0.97) days for neonatal wards) and ALOS in Taleghani Hospital is 3.37 (3.09) days (1.74 (0.14) days for perinatal wards and 5.96 (3.55) days for neonatal wards). Taking this into consideration, the maximum BOR was cited in Al-Zahra Hospital with 86.92 per cent and the minimum BOR belonged to Taleghani Hospital, which was 68.44 per cent (P<0.001). Of note, a higher BOR was detected in neonatal wards when compared to prenatal wards. Finally, BOR in Al-Zahra is greater than Taleghani (P<0.001), whereas the BOR showed an increasing pattern during the study period (Table 1- 3). Table 1- 3 indicates detailed information regard to BOR, BTR and ALOS related to Neonatal, Prenatal wards and total respectively.
Table 1. Data on the performance of neonatal wards in obstetrics and gynaecology hospitals in Tabriz - Iran, 2010-2013.
| Hospital by year | Performance Indicators | ||||||||
|---|---|---|---|---|---|---|---|---|---|
| BOR* | BTR* | ALOS* | |||||||
| Mean | SD** | P*** | Mean | SD | P*** | Mean | SD | P*** | |
| Taleghani 2010 | 74.21 | 15.43 | <0.001 | 66.53 | 40.44 | 0.495 | 5.79 | 3.58 | 0.907 |
| Al-Zahra 2010 | 114.21 | 10.92 | 74.34 | 12.18 | 5.68 | 0.49 | |||
| Taleghani 2011 | 73 | 11.94 | <0.001 | 59.84 | 27.52 | 0.035 | 5.72 | 3.06 | 0.619 |
| Al-Zahra 2011 | 119.72 | 12.47 | 73.87 | 14.29 | 6.04 | 0.74 | |||
| Taleghani 2012 | 75.96 | 18.01 | <0.001 | 60.14 | 27.37 | 0.114 | 6.29 | 4.08 | 0.726 |
| Al-Zahra 2012 | 124.45 | 12.92 | 70.10 | 12.71 | 6.58 | 0.68 | |||
| Taleghani Total | 74.42 | 15.12 | <0.001 | 61.47 | 30.40 | 0.009 | 5.96 | 3.55 | 0.706 |
| Al-Zahra Total | 119.77 | 12.74 | 72.60 | 13.02 | 6.13 | 0.97 | |||
* BOR= (Bed occupancy Rate), BTR= (Bed Turnover Ratio), ALOS=(Average Length of Stay), **SD= Standard Deviation *** P = P-value,Independent T-Test
Table 3. Data on the performance of total inpatient wards in obstetrics and gynaecology hospitals in Tabriz - Iran, 2010-2013.
| Hospital by year | Performance Indicators | ||||||||
|---|---|---|---|---|---|---|---|---|---|
| BOR | BTR | ALOS | |||||||
| Mean | SD | P | Mean | SD | P | Mean | SD | P | |
| Taleghani 2010 | 65.60 | 18.33 | <0.001 | 108.25 | 53.72 | <0.001 | 3.26 | 2.99 | 0.091 |
| Al-Zahra 2010 | 84.58 | 23.88 | 163.76 | 148.05 | 3.06 | 1.93 | |||
| Taleghani 2011 | 68.44 | 14.05 | <0.001 | 108.64 | 50.48 | <0.001 | 3.32 | 2.76 | 0.023 |
| Al-Zahra 2011 | 86.51 | 25.49 | 165.82 | 145.77 | 3.10 | 2.11 | |||
| Taleghani 2012 | 70.09 | 15.27 | <0.001 | 113.14 | 50.70 | <0.001 | 3.50 | 3.44 | 0.042 |
| Al-Zahra 2012 | 89.20 | 26.07 | 167.46 | 151.18 | 3.27 | 2.34 | |||
| Taleghani Total | 68.44 | 15.66 | <0.001 | 110.29 | 51.35 | <0.001 | 3.37 | 3.09 | <0.001 |
| Al-Zahra Total | 86.92 | 25.29 | 165.79 | 148.49 | 3.15 | 2.15 | |||
Table 2. Data on the performance of prenatal wards in obstetrics and gynaecology hospitals in Tabriz - Iran, 2010-2013.
| Hospital by year | Performance Indicators | ||||||||
|---|---|---|---|---|---|---|---|---|---|
| BOR | BTR | ALOS | |||||||
| Mean | SD | P | Mean | SD | P | Mean | SD | P | |
| Taleghani 2010 | 59.29 | 19.68 | 0.257 | 127.07 | 43.68 | 0.003 | 1.71 | 0.09 | 0.133 |
| Al-Zahra 2010 | 65.88 | 14.72 | 215.82 | 197.55 | 1.93 | 1.05 | |||
| Taleghani 2011 | 60.75 | 15.32 | 0.28 | 125.82 | 37.04 | 0.001 | 1.79 | 0.14 | 0.621 |
| Al-Zahra 2011 | 68.36 | 13.11 | 219.27 | 191.04 | 1.85 | 0.92 | |||
| Taleghani 2012 | 62.30 | 12.85 | 0.012 | 135.13 | 32.21 | 0.001 | 1.70 | 0.14 | 0.196 |
| Al-Zahra 2012 | 69.85 | 12.17 | 224.51 | 198.33 | 1.86 | 0.95 | |||
| Taleghani Total | 61.02 | 15.32 | 0.001 | 129.70 | 36.52 | <0.001 | 1.74 | 0.14 | 0.060 |
| Al-Zahra Total | 68.14 | 13.33 | 220.16 | 194.73 | 1.88 | 0.97 | |||
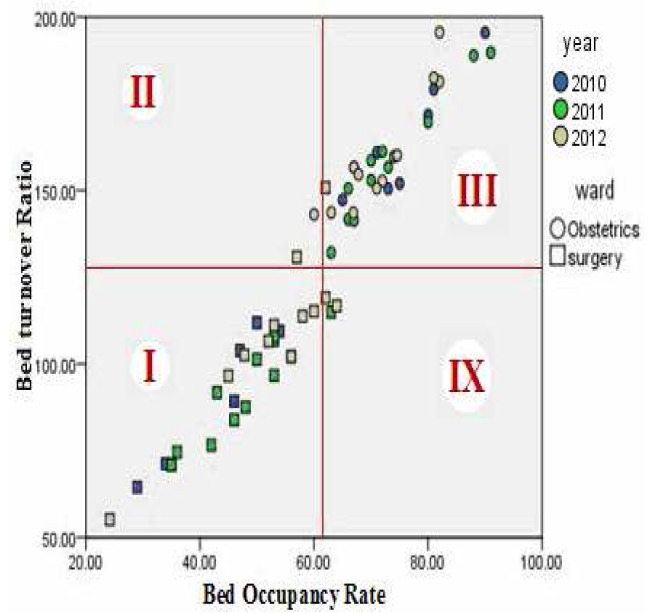
Figures 1 and 2 illustrate the performance of Taleghani Hospital during the entire time period (each spot shows a one month indicator) in a Pabon Lasso model according to neonatal and prenatal wards (the index lines run through the average BOR and BTR values for the entire wards). Based on these graphs, neonatal wards fall in zone 2, while NICU wards mostly lie in zone 4. Data in relation to perinatal wards indicate that surgery and obstetrics wards in Taleghani hospital fall in to zone 1 and 3, respectively.
Figure 1. Pabon Lasso diagram, neonatal wards, Taleghani Hospital, 2010-1012.
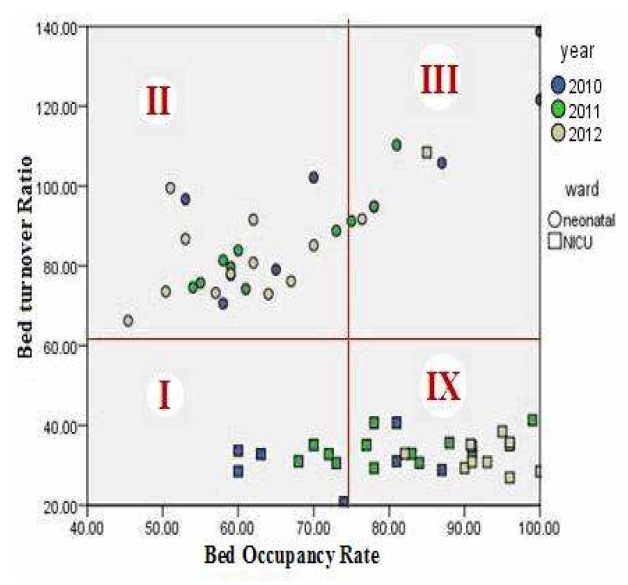
Figure 2. Pabon Lasso diagram, prenatal wards, Taleghani Hospital, 2010-1012.
Figurse 3 and 4 illustrate the performance of Al-Zahra Hospital during the entire time period (each spot indicates a one month indicator) in a Pabon Lasso model according to neonatal and antenatal wards. According to study findings, neonatal wards of Al-Zahra hospital fall mostly in zone 1 and NICU is in zone 3. Data in relation to antenatal wards indicate that excluding the midwifery ward, other perinatal ward indicators mostly lodge in zone 4.
Figure 3. Pabon Lasso diagram, neonatal wards, Al-Zahra Hospital, 2010-1012.
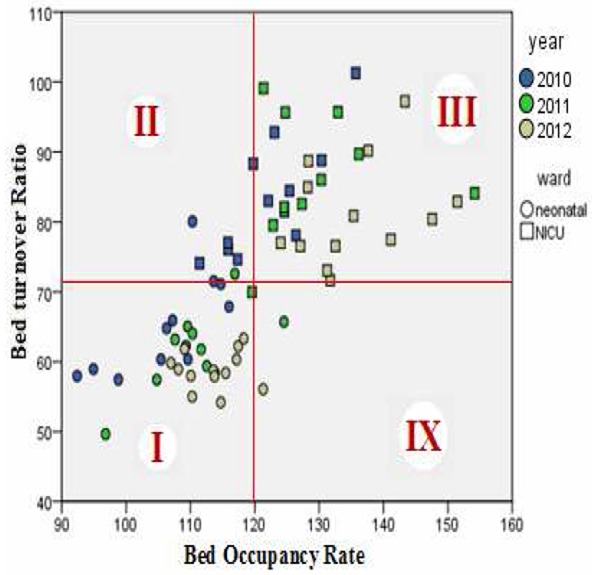
Figure 4. Pabon Lasso diagram, prenatal wards, Al-Zahra Hospital, 2010-1012.
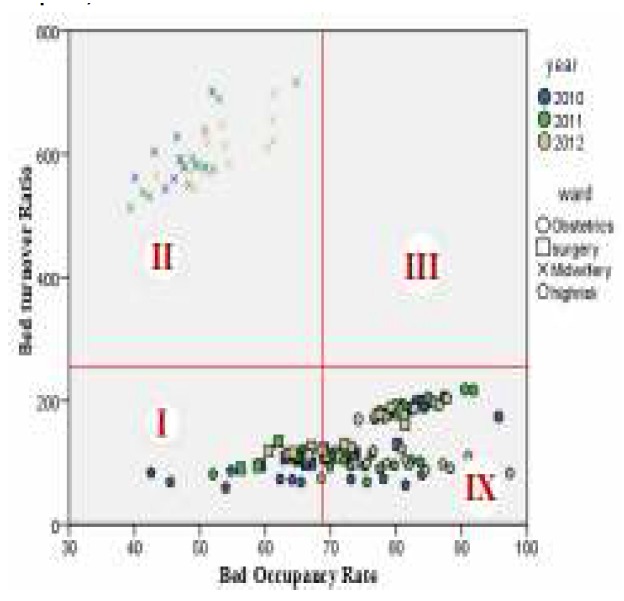
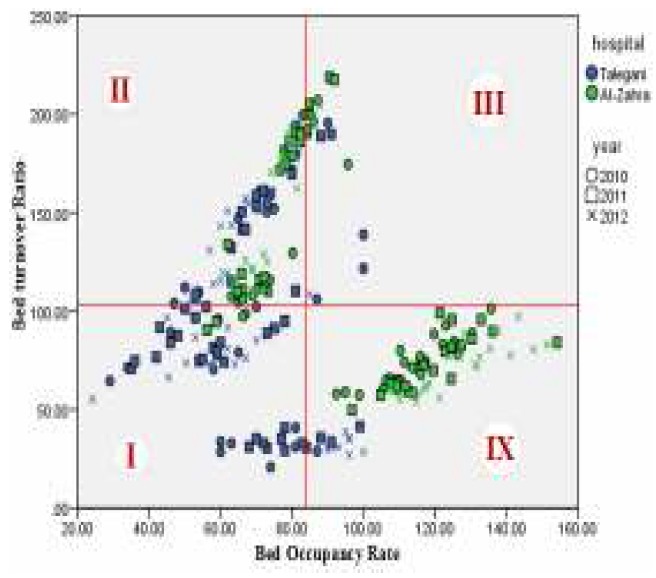
Figure 5 illustrates the performance of the hospitals in a Pabon Lasso model. It can be seen that Taleghani Hospital mostly is in zone 1 and some cases in zone 2, while Al-Zahra indicators fall in zone 2 and zone 4 of the graph. None of the two hospitals fell in zone 3.
Figure 5. Pabon Lasso diagram, Taleghani and Al-Zahra Hospitals, 2010-1012.
Discussion
This study was conducted to compare performance indicators of obstetrics and gynecology hospitals of Tabriz University of Medical Sciences. This comparison was made due to different managerial methods of these hospitals. Results of this study disclose that none of the two Al-Zahra and Taleghani Hospitals fell in zone 3 and there are significant differences in performance indicators of the hospitals. To be noted, Al-Zahra that was managed under a board of trustees fell in zone 2 and 4, while Taleghani which was managed under centralised administration fell in zone 1 and 2.
According to regionalisation in health care systems, these hospitals cover problems that are related to neonatal and prenatal conditions and cases in the east Azerbaijan province. In this regard, there is a difference between occupancy rates of these specialty-hospitals in neonatal wards. Considering this difference, Al-Zahra faces an overload but Taleghani does not fully use its capacity. On the other hand, comparisons of performance indicators of neonatal wards and prenatal wards indicate a significant difference within the hospitals. In some cases there has been an exhaustion of the capacity of neonatal wards. On the contrary, prenatal wards report BORs lower than 70 percent.
None of the two hospitals assessed in our research fell into zone 3 of the Pabon Lasso graph, which in turn shows a degree of inefficiency. These hospitals can reach an ideal level of performance through appropriate service management by reducing ALOS and shifting developmental initiatives to increasing neonatal ward capacity. In this regard, the BOR reported in countryside hospitals was 57.8 per cent, whereas BOR in theses hospitals is 86.9 per cent, therefore performance of these hospitals was better than the national average 15. However, we must consider the fact that these hospitals were central hospitals in the province and have referral roles.
Bahadori et al. (2011) declared that only 39 per cent of east Azerbaijan province hospitals fell in zone 3 in Pabon Lasso graph 8. Also, Zahiri and Keliddar (2012) reported that out of the total 26 included hospitals in their study, 10 of them fell in zone 3, seven of them fell in zone 2 and seven of them in zone 2.16 Sajadi et al. (2011) found an improvement in function of hospitals affiliated with Isfahan University of Medical Sciences between 2005 and 2006, as the hospitals mostly increased their BOR and decreased the ALOS to shift towards zone 3 in Pabon Lasso chart.17 According to Asbu et al. (2012) in Malawi, it was observed that only 27.5 per cent of the hospitals were located in zone 3 in Pabon Lasso diagram (upper right region). Also, when the cut-off for the BOR is increased to 85 per cent the number of those hospitals located in the desirable region decreased to only 12.5 per cent.18
It should be noted that the average BOR in this study was equal to standard BOR (85 per cent). Taking this into account, we can conclude that the reported distribution of hospital indicators in the Pabon Lasso graph is consistent with the standard mode (BOR = 85 per cent).18 But, if we assess the data in both hospitals, we can observe in Taleghani Hospital when the benchmark occupancy rate (cut off point) is increased to 85 per cent, the number of hospitals excluded from zone 3 increases. Conversely, this was not the case for Al-Zahra and in neonatal wards the cutoff point was increased to 120 per cent. On the other hand, by categorising data according to neonatal or prenatal wards, we can observe that neonatal BOR is greater than perinatal wards. So, only several of the performance indexes are located at the right upper zone, which is the desirable state of capacity utilisation.
It appears due to independence in decision making in the Al-Zahra hospital according to the autonomisation act using board of trustees, their manager has the authority to make changes to respond to the needs in cases such as equipping and developing wards. But Taleghani Hospital, managed under central management as a budgetary unit in this regard, its manager is not able to allocate resources according to need. On the other hand, this problem could be the result of weaknesses in the steering committee that manages the flow of patients between hospitals.
Conclusion
Considering the policy of the Ministry of Health and Tabriz University of Medical Sciences, the hospital's function in the community can be changed.19 On the other hand, according to the results of this study and considering the similar facilities and conditions existing in both studied hospitals, we can conclude that managerial differences can play a major role in the explanation of differences in performance indicators.14 Also, it must be noted that differences in administration methods could have had a major impact on the process that led to the better performance of Al-Zahra when compared to Taleghani because this hospital is managed as an autonomised organisation under a board of trustees and can therefore plan independently according to strategic focus through its board’s participation in the strategic decision-making process.12,20 Finally, it appears that periodic evaluations are required to monitor performance of hospitals over time and this can be pursued by assessing the extent of regionalisation of services and increasing the hospital’s capacity utilisation.10
ACKNOWLEDGEMENTS
We would like to acknowledge the co-operation of all the employees and managers in Al-Zahra and Taleghani Hospitals. We would also like to thank chairman of information management and quality improvement departments of Al-Zahra and Taleghani Hospitals for their support in conducting this study.
Footnotes
PEER REVIEW
Not commissioned. Externally peer reviewed
CONFLICTS OF INTEREST
Authors declare that they have no competing interests.
FUNDING
Student Research Committee, Tabriz University of Medical Sciences, Tabriz, Iran
Please cite this paper as: Gholipour K, Delgoshayi B, Massudi-Asl I, Hajinabi K, Iezadi S. Comparing performance of Tabriz obstetrics and gynaecology hospitals managed as autonomous and budgetary units using Pabon Lasso method. AMJ 2013, 6, 12, 701-707. http//dx.doi.org/10.4066/AMJ.2013.1903
References
- 1.Solon O, Woo K, Quimbo SA, Shimkhada R, Florentino J, Peabody2 JW. A novel method for measuring health care system performance: experience from QIDS in the Philippines. Health Policy Plan. 2009 May;24(3):167–74. doi: 10.1093/heapol/czp003. [DOI] [PMC free article] [PubMed] [Google Scholar]
- 2.Dayasiri MBKC, Lekamge ELS. Predictors of patient satisfaction with quality of health care in Asian hospitals. Australas Med J. 2010;3(11):739–744. [Google Scholar]
- 3.More L, Anthoine E, Paillé C, Tricaud-Vialle S, Gerbaud L, Giraud-Roufast A, Michel P, Lombrail P. Relationship between inpatient satisfaction and nurse absenteeism: an exploratory study using WHO-PATH performance indicators in France. BMC Research Notes. 2012;5(83):7. doi: 10.1186/1756-0500-5-83. [DOI] [PMC free article] [PubMed] [Google Scholar]
- 4.Peters RJG. Hospital performance indicators in the Netherlands: a preterm delivery. Neth Heart J. 2009 Feb;17(2):48–9. doi: 10.1007/BF03086215. [DOI] [PMC free article] [PubMed] [Google Scholar]
- 5.Lupi S, Verzola A, Carandina G, Salani M, Antonioli P, Gregorio P. Multidimensional evaluation of performance with experimental application of balanced scorecard: a two year experience. Cost Eff Resour Alloc. 2011 May 17;9(1):7. doi: 10.1186/1478-7547-9-7. [DOI] [PMC free article] [PubMed] [Google Scholar]
- 6.Groene O, Klazinga N, Kazandjian V, Llombrail P, Bartels P. The World Health Organization Performance Assessment Tool for Quality Improvement in Hospitals (PATH): An Analysis of the Pilot Implementation in 37 Hospitals. Int J Qual Health Care. 2008 Jun;20(3):155–61. doi: 10.1093/intqhc/mzn010. [DOI] [PubMed] [Google Scholar]
- 7.Merle Vr, Moret L, Pidhorz L, Dujardin F. Does comparison of performance lead to better care? A pilot observational study in patients admitted for hip fracture in three French public hospitals. Int J Qual Health Care. 2009;21(5):321–329. doi: 10.1093/intqhc/mzp029. [DOI] [PubMed] [Google Scholar]
- 8.Bahadori M, Sadeghifar J, Hamouzadeh P, Mostafa H, Nejati M. Combining multiple indicators to assess hospital performance in Iran using the Pabon Lasso Model. Australas Med J. 2011;4(4):175–179. doi: 10.4066/AMJ.2011.620. [DOI] [PMC free article] [PubMed] [Google Scholar]
- 9.Goshtasebi A, Vahdaninia M, Gorgipour R, Samanpour A, Maftoon F, Farzadi F, Ahmadi F. Assessing Hospital Performance by the Pabon Lasso Model. Iranian J Publ Health. 2009;38(2):119–124. [Google Scholar]
- 10.Popov L. Hospital Facilities Programming: An Opportunity for Vanguard Medical Practices. Australas Med J. 2010;3(9):591–597. [Google Scholar]
- 11.Harding A, Preker AS. Understanding organizational reforms. Washington D.C: The World Bank. 2000 [Google Scholar]
- 12.Ford-Eickhoff K, Plowman DA, Jr RRM. Hospital boards and hospital strategic focus: The impact of board involvement in strategic decision making. Health Care Manage Rev. 2011 Apr-Jun;36(2):145–54. doi: 10.1097/HMR.0b013e3182099f6e. [DOI] [PubMed] [Google Scholar]
- 13.Molinari C, Morlock L, Jeffrey Alexander, Lyles A. Hospital Board Effectiveness: Relationships between Governing Board Composition and Hospital Financial Viability. Health Serv Res. 1993 Aug;28(3):358–77. [PMC free article] [PubMed] [Google Scholar]
- 14.Pabón Lasso H. Evaluating hospital performance through simultaneous application of several indicators. Bull Pan Am Health Organ. 1986;20(4):341–57. [PubMed] [Google Scholar]
- 15.Abolhalaj M, Hosainy-Parsa SH, Jafari-Sirizi M, Inalou S. A situational analysis of human resources in Iranian hospitals affiliated with ministry of health in 2008. Journal of Shahrekord University of Medical Sciences. 2010;12(1):60–68. [Google Scholar]
- 16.Zahiri M, Keliddar I. Performance evaluating in hospitals affiliated in AHWAZ University of Medical Sciences based on PABON LASSO model. Hospital. 2012;11(3):37–44. [Google Scholar]
- 17.Sajadi HS, Sajadi ZS, Hadi M. Is There any Method to Compare Key Indicators of Hospital Performance Simultaneity? Health Information Management. 2011;8(1):71–81. [Google Scholar]
- 18.Asbu EZ, Walker O, Kirigia JM, Zawaira F, Magombo F, Zimpita P, Manthalu G, Nkhoma D, Eldridge C, Kataika E. Technical efficiency of district hospitals in Malawi, An exploratory assessment using data envelopment analysis. African Health Monitor. 2012;14 [Google Scholar]
- 19.Farzandipour M, Rangraz-Jeddi F, Mousavi GhA. How often do the managers use the statistics for hospital management? Feyz. 2003;27:92–98. [Google Scholar]
- 20.Preker AS, Harding A. Innovations in Health Service Delivery: The Corporatization of Public Hospitals. Washington D.C: World Bank Publications. 2003 [Google Scholar]


