Abstract
Introduction
Advanced thymoma (stage III and IV) is difficult to detect by computed tomography (CT), yet it is important to distinguish between early (stage I and II) and advanced disease before surgery, as patients with locally advanced tumors require neoadjuvant chemotherapy to enable effective resection. This study assessed whether the amount of fluorodeoxyglucose (FDG) uptake can predict advanced thymoma and whether it can separate thymoma from thymic cancer.
Methods
We retrospectively reviewed FDG positron emission tomography (PET)-CT scans of 51 consecutive newly diagnosed patients with thymic epithelial malignancy. PET-CT findings documented were focal FDG activity: SUVmax, SUVmean, SUVpeak and total body volumetric standardized uptake value (SUV) measurements. These were correlated with Masaoka-Koga staging and WHO classification. Wilcoxon rank-sum tests were used to assess association between SUV and pathological stage, cancer type, and classification.
Results
Among the study patients, 37 had thymoma, 12 thymic carcinoma, and 2 thymic carcinoid. Higher focal FDG uptake was seen in patients with type B3 thymoma than in those with type A, AB, B1, or B2 thymoma (p<0.006). Uptake was higher in patients with thymic carcinoma or carcinoid than in those with thymoma (p<0.0003), with more variable associations with volumetric SUV measurements. There was no significant association observed between higher focal FDG uptake and advanced-stage disease in thymoma patients (p>0.09), though greater FDG-avid tumor volume was significantly associated with advanced disease (p<0.03).
Conclusions
Focal FDG uptake cannot predict advanced thymoma but is helpful in distinguishing thymoma from thymic carcinoma, or the more aggressive thymoma, type B3.
Keywords: Thymoma, PET-CT, Masaoka-Koga
Introduction
Thymic epithelial neoplasms include thymoma, thymic carcinoma, and carcinoid. Of these, thymoma is the most common and accounts for approximately 20% of adult anterior mediastinal neoplasms.1 Computed tomography (CT) is the most common imaging modality currently used for evaluation of the anterior mediastinal mass. However, often, it cannot differentiate early (stage I and II) from advanced (stage III and IV) disease, as local invasion into the pericardium and vessels is more difficult to appreciate than simple abutment, and fine pleural metastatic spread can be below the resolution of CT. It is important to distinguish between early and advanced disease before surgery, as patients with locally advanced tumors receive neoadjuvant chemotherapy to enable effective resection.2 Complete resection, even of advanced disease, improves survival.3
Some surgeons advocate thymectomy without biopsy for small anterior mediastinal masses suggestive of thymoma. However, early-stage thymoma, thymic cancer, and carcinoid can look identical on CT. As thymic cancer and thymic carcinoid are much more aggressive than thymoma, with a tendency for early metastatic spread, patients with these tumors usually receive neoadjuvant chemotherapy, even with clinical early disease. Therefore, identifying the specific disease before thymectomy is performed is desirable for better tailoring patients’ therapy.
Fluorine-18 fluorodeoxyglucose (FDG) positron emission tomography (PET)-CT has emerged as a strong diagnostic tool for the diagnosis, clinical staging, and outcome of intra-thoracic malignancies, especially in patients with non-small-cell lung cancer, 4, 5 but the precise role of FDG PET-CT in the management of thymic epithelial malignancies, especially thymoma, is unclear. There is controversy about FDG PET-CT’s ability to differentiate between invasive and noninvasive thymomas, and only a few small studies have assessed FDG-PET imaging of thymoma, the majority of which also combined thymic cancers their evaluation. 6, 7
The goal of our study was to assess whether FDG PET-CT can distinguish thymoma from thymic carcinoma and carcinoid and whether it can distinguish early from advanced thymoma, for which preoperative chemotherapy is needed.
Materials and Methods
Patients
A retrospective search of a PET-CT database from The University of Texas MD Anderson Cancer Center revealed 140 patients who were referred for FDG PET-CT scanning for the evaluation of thymic epithelial neoplasms between October 2003 and November 2011. Of the 140 patients referred for thymic epithelial neoplasm evaluation based on their PET-CT scans, 89 patients were excluded because no pretreatment PET-CT was available for review. Thus, the final study group comprised 51 patients for whom a pretreatment PET-CT for evaluation of a thymic epithelial malignancy was available for review. We reviewed these patients’ computerized medical records to extract demographic data, their operative, pathology, and treatment reports, and their imaging studies. This study was approved by our institutional review board and we obtained a waiver of the requirement for informed consent. In addition, our study was in compliance with Health Insurance Portability and Accountability Act regulations.
Staging
We applied the Masaoka-Koga staging system 8 to each case by reviewing the operative and pathology reports in consultation with an experienced pathologist specializing in thymoma (CAM). This staging system is based on gross and microscopic properties of the tumor, where stage I was assigned when the tumor was completely encapsulated; stage II when there was either microscopic invasion into the capsule (IIa) or invasion into surrounding fat (IIb); stage III when there was invasion into a neighboring organ such as the pericardium, great vessels, or lung; and stage IV when there was pleural or pericardial dissemination (IVa) or lymphatic/hematogenous metastasis (IVb). The World Health Organization (WHO) classification 9 for each tumor was determined (by CAM) from the operative specimen and was dichotomized into atypical thymoma (WHO type B3) and typical thymoma (WHO type A, AB, B1 and B2) for statistical purposes. Similarly, for statistical purposes, carcinoid was included with thymic carcinoma.
PET-CT
Integrated PET-CT systems were used to acquire imaging data (Discovery ST, STe, or RX; GE Healthcare). Whole-body examinations were performed from the level of the vertex of the skull or orbits through the upper thighs. PET-CT was performed in accordance with guidelines published by the National Cancer Institute 10. All patients fasted for a minimum of 6 hours before the intravenous injection of FDG. A normal fasting blood glucose level of 80–120 mg/dL (4.4–6.6 mmol/L) was a standard requirement for imaging in all patients. PET data acquisition was performed in 2D mode prior to January 2008 and was changed to 3D mode following that date. For 2D imaging, an intravenous injection of 555 to 629 MBq (15–17 mCi) of FDG was administered in the arm or central venous catheter on the side opposite the cancer, and emission scans were acquired at 3 minutes per field of view 60–90 minutes after the FDG injection. The same procedure was used for 3D imaging except for using an injected dose of 333–407 MBq (9–11mCi) of FDG. PET images were reconstructed using standard vendor-provided reconstruction algorithms. Non-contrast-enhanced CT images were acquired in helical mode (speed, 13.5 mm/rotation) from the base of the skull to the midthigh during suspended midexpiration at a 3.75-mm slice thickness, a tube voltage of 120 kVp, a tube current–time product of 150 mAs, and a 0.5-second rotation. Attenuation-corrected and non–attenuation-corrected datasets were reconstructed.
The PET-CT scans were reviewed by two experienced chest radiologists (MFKB, EMM) who were blinded to clinical information. Differences in their findings were resolved by consensus. Imaging findings were recorded for each patient. A clinical CT stage was assigned and FDG uptake was recorded in terms of standardized uptake value body weight (SUV) as SUVmax, SUVmean, or SUVpeak. Total body volumetric SUV was calculated as the volume of tumor (in cm3) within 45% of SUVmax, as well as the volume of tumor (in cm3) with SUVmax above a threshold of 3.5. For these measurements SUVmean and SUVpeak were determined from the volume of interest defined by the 45% of the SUVmax.
Statistical Analysis
We used Wilcoxon rank-sum tests to assess associations between SUV and pathological stage, cancer type, and WHO classification, with p-values computed using the normal approximation. We used Fisher’s exact test to assess association between cancer type and pathological stage. We calculated overall survival (OS) from the date of the initial pathology diagnosis to date of death or last follow-up. We calculated progression-free survival from the date of the initial pathology diagnosis to first progression, death, or last clinical evaluation for progression. We used univariate Cox regression models to predict OS and progression-free survival time from SUV measurements. All statistical analyses were performed using SAS 9.2 for Windows (SAS Institute Inc., Cary, NC, USA).
Results
Patient and Disease Characteristics
Among the 51 study patients, 37 patients had a pathology diagnosis of thymoma, 12 patients had thymic carcinoma, and 2 patients had thymic carcinoid. Thirty (59%) were men and 21 (41%) were women. Their ages ranged from 21 to 84 years (mean: 59.4 years). Using the Masaoka-Koga pathological staging for the thymoma patients, 1 patient (3%) had stage I disease, 14 patients (37%) had stage IIa disease, 5 patients (13%) had stage IIb disease, 8 patients (22%) had stage III disease, 7 patients (19%) had stage IVa disease, and 2 patients (6%) had stage IVb disease. Among the 14 patients with thymic carcinoma or thymic carcinoid, 1 patient (7%) had stage I disease, 6 patients (43%) had stage III disease, 3 patients (21%) had stage IVa disease, and 4 patients (29%) had stage IVb disease. Patients with thymoma were more likely to present with early-stage disease (n = 20; 54%) than were patients with thymic carcinoma and carcinoid (n=1; 7%) (p=0.003) (Table 1). Of the 37 thymoma patients, surgical specimens for 36 were available for histological classification review. Most were confirmed to have typical thymoma: WHO classification type A in 8 patients (22%), type AB in 3 patients (8%), type B1 in 10 patients (27%), and type B2 in 9 patients (24%); only 7 patients (19%) presented with atypical thymoma (type B3) (Table 2)
Table 1.
Association Between Cancer Type and Pathology Stage
| WHO | Pathological Stage | Total | p-value | |||
|---|---|---|---|---|---|---|
| I–II | III–IV | |||||
| Count | % | Count | % | |||
| Thymoma | 20 | 54 | 17 | 46 | 37 | 0.0033 |
| Thymic carcinoma, carcinoid | 1 | 7 | 13 | 93 | 14 | |
Table 2.
Masoka-Koga Staging Compared to the WHO Histologic Classification System for Thymoma Patients
| WHO | Masaoka-Koga Staging | Total | |||||||
|---|---|---|---|---|---|---|---|---|---|
| I | II | III | IV | ||||||
| Count | % | Count | % | Count | % | Count | % | ||
| A | 1 | 12.5 | 4 | 50 | 3 | 37.5 | 0 | 0 | 8 |
| AB | 0 | 0 | 3 | 100 | 0 | 0 | 0 | 0 | 3 |
| B1 | 1 | 11 | 5 | 56 | 1 | 11 | 2 | 22 | 9 |
| B2 | 0 | 0 | 3 | 33 | 2 | 22 | 4 | 44 | 9 |
| B3 | 1 | 14 | 2 | 29 | 2 | 29 | 2 | 29 | 7 |
| Total | 3 | 8 | 17 | 47 | 8 | 22 | 8 | 22 | 36 |
PET-CT and Tumor Classification
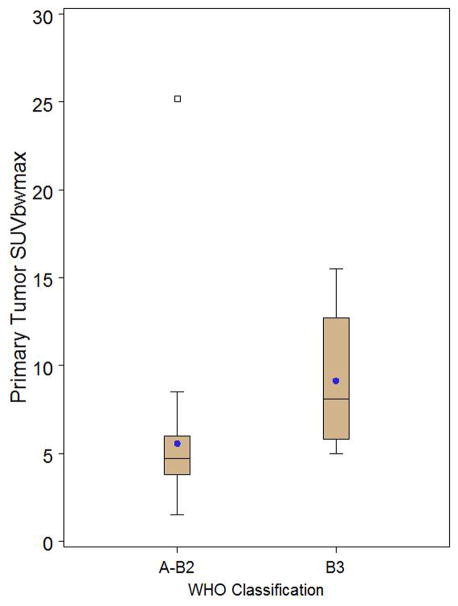
The FDG uptake of thymic carcinoma and thymic carcinoid was significantly higher than that of thymoma, as measured by SUVmax (p=0.0001), SUVpeak (0.0003), SUVmean (0.0001), and total tumor volume above SUVmax 3.5 (p=0.02), but not by volumetric measurement calculated as total tumor volume, within 45% of SUVmax (p=0.74) (Table 3) (Figs. 1,2 and 3). By using an SUVmax of ≥6 to classify everything above this as thymic cancer/carcinoid, 100% of thymic cancer/arcinoid tumors were correctly identified but 38% of thymoma patients were classified as thymic cancer. A value of ≥7 misclaffied thymic cancer as thymoma, whereas a value of 5 resulted in 59% of thymomas misclassified as thymic cancer. When assessing whether FDG uptake differentiated between the different thymoma WHO classification types, we found that higher FDG uptake did distinguish B3 thymoma from the other types combined when FDG uptake was measured in terms of SUVmax (p=0.006), SUVpeak (p=0.004), and SUVmean (p=0.005), and total tumor volume above SUVmax 3.5 (p=0.04) (Fig. 4 and 5), but not when it was recorded as the volumetric measurement calculated as total tumor volume within 45% of SUVmax(p=0.78) (Table 4). When trying to differentiate thymoma WHO types B2 and B3 from types A, AB, and B1, we found a weak association only for total tumor volume measurement above SUVmax 3.5 (p=0.05), not for the other SUV measurements (p>0.08) (Table 5).
Table 3.
Association Between SUV and Cancer Type
| SUV | Cancer Type | ||||
|---|---|---|---|---|---|
| Thymoma (n=37) | Thymic Cancer, Carcinoid (n=14) | ||||
| Mean (SD) | Range | Mean (SD) | Range | p-value | |
| Primary tumor SUVmax | 6.27 (4.18) | 1.50–25.20 | 11.09 (5.48) | 6.00–25.70 | 0.0001 |
| Primary tumor SUVpeak | 5.53 (3.84) | 1.50–23.20 | 9.38 (4.61) | 5.00–20.20 | 0.0003 |
| Primary tumor SUVmean | 3.85 (2.53) | 1.00–15.20 | 6.72 (3.15) | 3.50–15.00 | 0.0001 |
| Total tumor volume of SUV 45% (cm3) | 176.31 (247.31) | 6.10–1076.00 | 153.71 (147.31) | 4.00–532.50 | 0.7435 |
| Total volume above SUV 3.5 (cm3) | 139.29 (280.33) | 0.00–1378.20 | 203.01 (188.32) | 6.10–579.00 | 0.0212 |
SUV, standardized uptake value; SD, standard deviation
FIGURE 1.
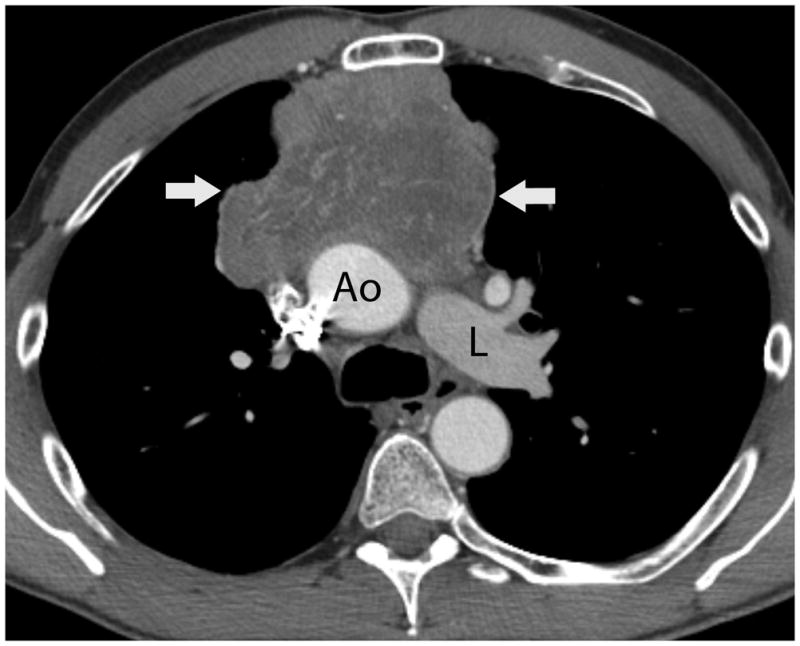
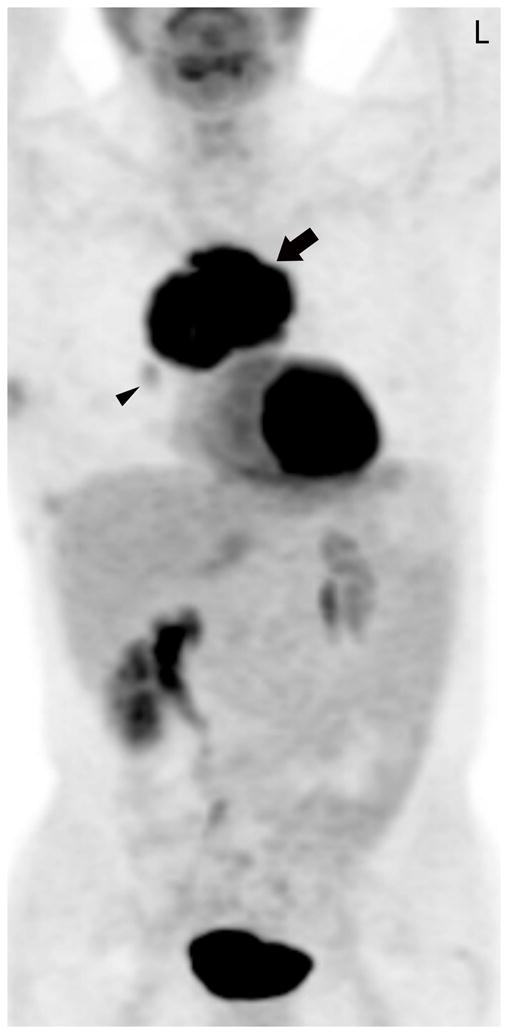
Fifty-four-year-old man with thymic carcinoma. Axial contrast-enhanced CT (A) at the level of the left pulmonary artery (L) demonstrated a large heterogeneous anterior mediastinal mass (arrows) surrounding 180° of the circumference of the ascending aorta (Ao). The coronal maximum intensity projection FDG PET image (B) and fused PET-CT image (C) show intense FDG uptake within the mass, with an SUVmax of 14.1 (arrow). Note mild FDG uptake in a right hilar lymph node (arrowhead), which biopsy proved to represent a lymph node metastasis, yielding a diagnosis of stage IVb disease. CT, computed tomography. FDG, fluorodeoxyglucose. PET, positron emission tomography. SUV, standardized uptake value.
FIGURE 2.
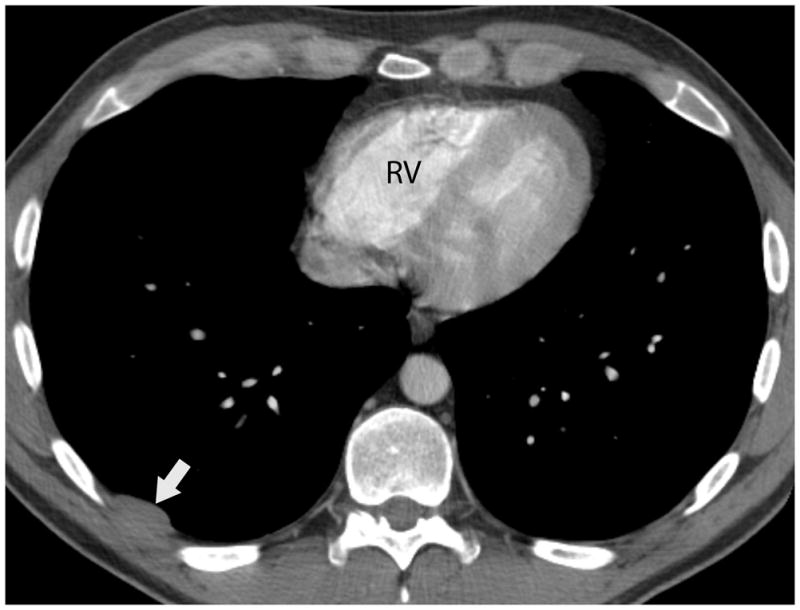
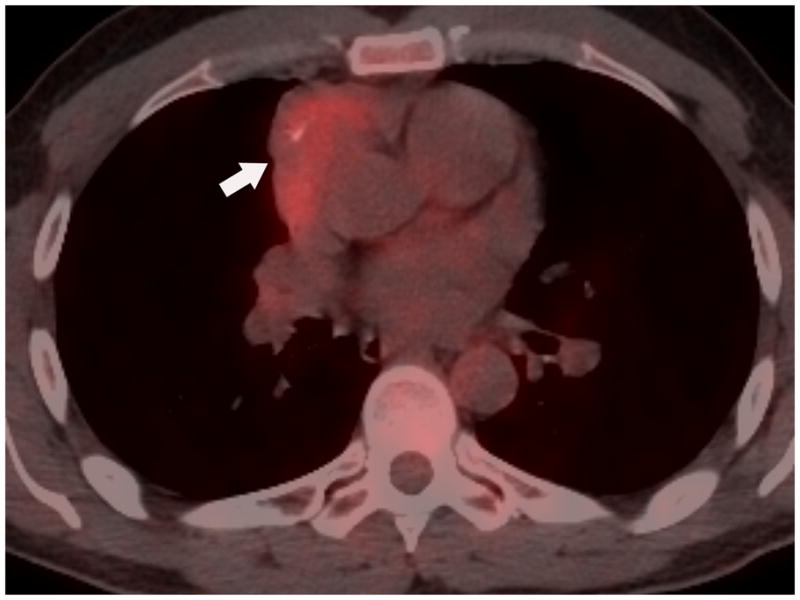
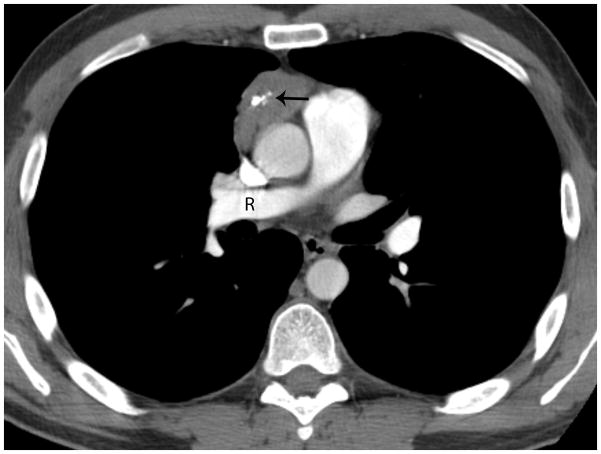
Forty-one-year old man complaining of chest pain for one week. A) Axial image from contrast-enhanced chest CT at the level of the right pulmonary artery (R) revealed a 5-cm anterior mediastinal mass with central calcifications (arrow). B) Axial image caudal to A, at the level of the right ventricle (RV), demonstrates a lentil-shaped pleural nodule, typical for a pleural metastasis. Surgery confirmed a type B2, stage IVa thymoma. C) Fused FDG PET-CT image shows mild FDG uptake in the anterior mediastinal mass with SUVmax of 3.8 (arrow). CT, computed tomography. FDG, fluorodeoxyglucose. PET, positron emission tomography. SUV, standardized uptake value.
FIGURE 3.
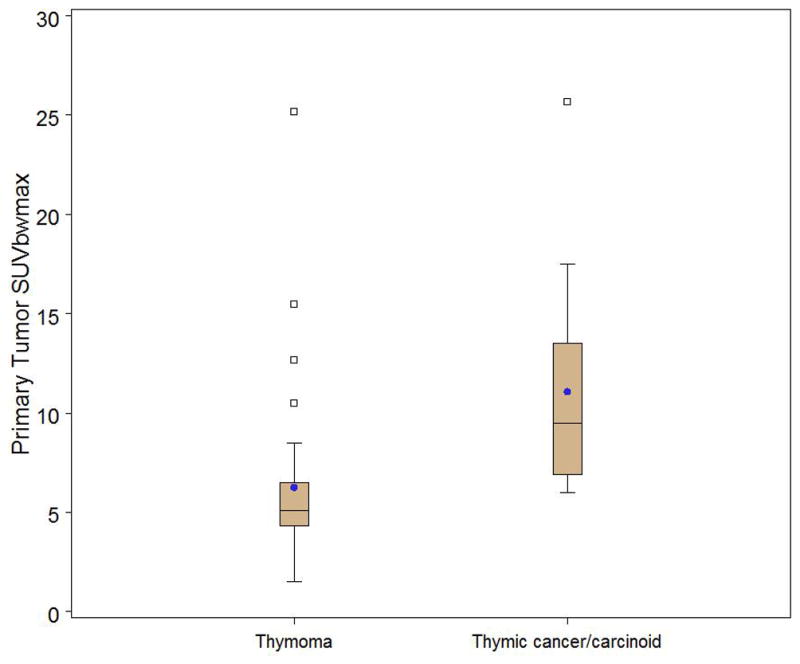
Box and whisker plot stratified by thymoma (n=37) versus thymic cancer/carcinoid (n=14) demonstrating a significant difference in primary tumor SUV max (p=0.0001). Observations above the upper fence, defined as 1.5 IQR above the 75th percentile, are displayed as squares. The middle black line in box represents the median. The blue dot represents the mean.
FIGURE 4.
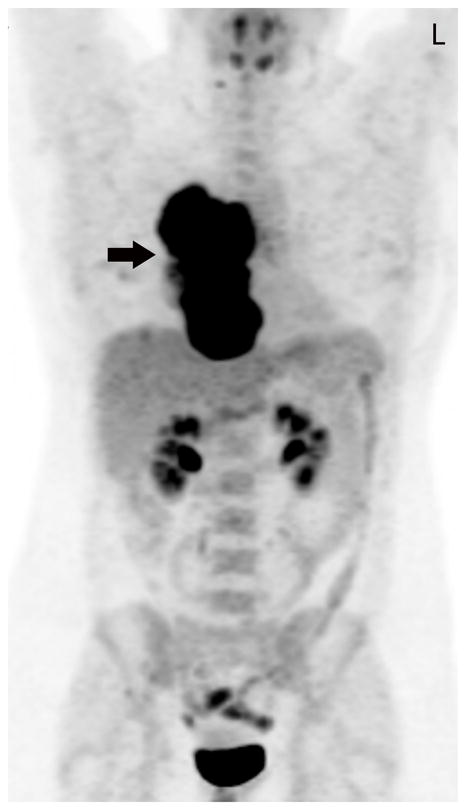
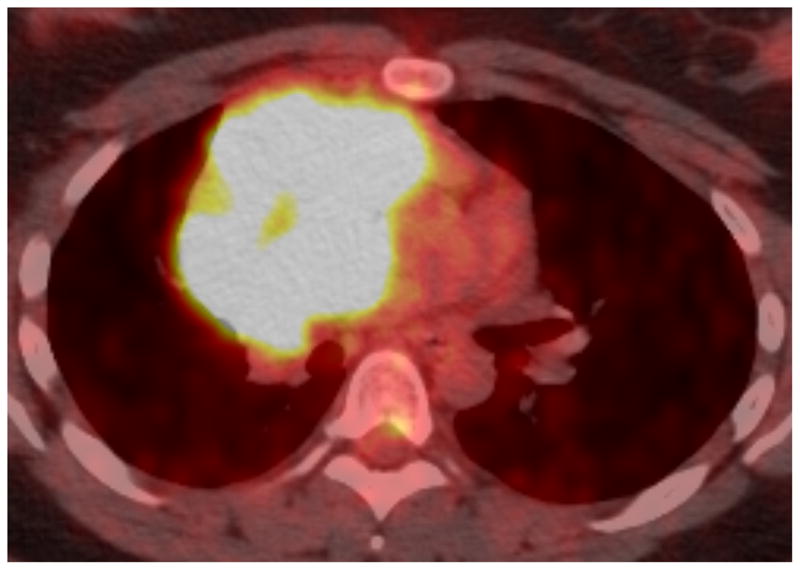
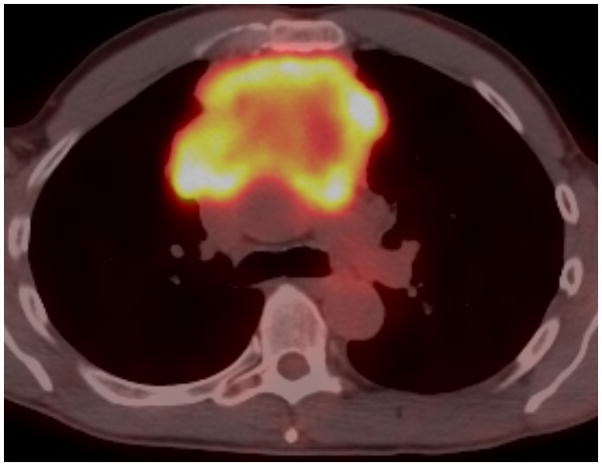
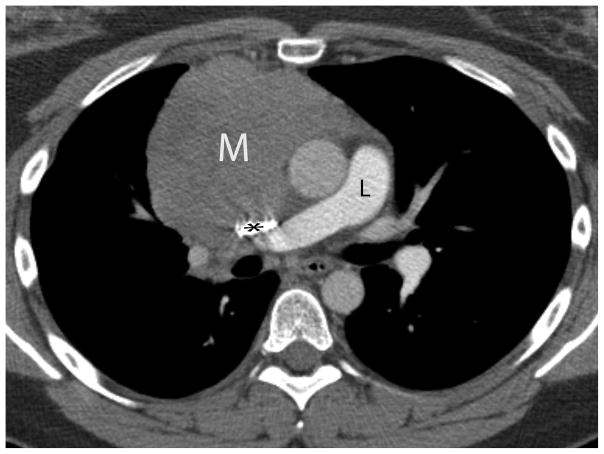
Twenty-nine-year-old woman complaining of chest pain over the last year. Contrast-enhanced chest CT image (A) at the level of the left pulmonary artery (L) demonstrates a large anterior mediastinal mass (M) deforming and surrounding the superior vena cava (*) for more than 180° of its circumference. Coronal maximum intensity projection FDG PET image (B) and fused axial PET-CT show the mass was intensely FDG avid, with a SUVmax of 15.5. Surgery confirmed a type B3 thymoma, stage IVa. The tumor directly involved the pericardium, superior vena cava, and right upper lobe, and there were small pleural metastases. CT, computed tomography. FDG, fluorodeoxyglucose. PET, positron emission tomography. SUV, standardized uptake value.
FIGURE 5.
Box and whisker plot of thymoma only patients stratified by WHO classification A-B2 (n=29) versus B3 (n=7) demonstrating a significant difference in primary tumor SUVmax (p=0.0062). Observations above the upper fence, defined as 1.5 IQR above the 75th percentile, are displayed as squares. The middle black line in box represents the median. The blue dot represents the mean.
Table 4.
Association Between SUV and WHO Classification Type (Thymoma Only)
| SUV | WHO Classification | p-value | |||
|---|---|---|---|---|---|
| A-B2 (n=29) | B3 (n=7) | ||||
| Mean (SD) | Range | Mean (SD) | Range | ||
| Primary tumor SUVmax | 5.57 (4.07) | 1.50–25.20 | 9.14 (3.91) | 5.00–15.50 | 0.0062 |
| Primary tumor SUVpeak | 4.89 (3.77) | 1.50–23.20 | 8.14 (3.51) | 4.60–14.00 | 0.0040 |
| Primary tumor SUVmean | 3.42 (2.47) | 1.00–15.20 | 5.60 (2.34) | 3.10–9.70 | 0.0054 |
| Total tumor volume of SUV 45% (cm3) | 166.41 (257.12) | 6.10–1076.00 | 171.79 (202.49) | 10.80 – 564.50 | 0.7796 |
| Total volume above SUV 3.5 (cm3) | 113.45 (279.90) | 0.0–1378.20 | 220.31 (299.14) | 6.70 – 773.20 | 0.0408 |
SUV, standardized uptake value; SD, standard deviation
Table 5.
Association Between SUV and WHO Classification Type (Thymoma Only)
| SUV | WHO Classification | p-value | |||
|---|---|---|---|---|---|
| A-B1 (n=20) | B2,B3 (n=16) | ||||
| Mean | Range | Mean | Range | ||
| Primary tumor SUVmax | 4.96 (1.35) | 2.60 – 7.30 | 7.90 (5.86) | 1.50 – 25.20 | 0.1077 |
| Primary tumor SUVpeak | 4.32 (1.23) | 2.60 – 6.80 | 7.03 (5.40) | 1.5 – 23.20 | 0.0798 |
| Primary tumor SUVmean | 3.06 (0.93) | 1.60 – 5.10 | 4.83 (3.52) | 1.0 – 15.2 | 0.0882 |
| Total tumor volume of SUV 45% (cm3) | 103.95 (102.30) | 6.20 – 341.90 | 246.84 (338.33) | 6.10 – 1076.0 | 0.3159 |
| Total volume above SUV 3.5 (cm3) | 38.89 (65.09) | 0.0 – 235.4 | 253.41 (392.03) | 0.0 – 1378.2 | 0.0532 |
SUV, standardized uptake value; SD, standard deviation
PET-CT and Tumor Staging
FDG uptake was higher for patients with epithelial thymic malignancies presenting with advanced disease (Table 6) (p<0.01) than for patients with early-stage disease. However, when excluding thymic carcinoma and thymic carcinoid and assessing the association of FDG uptake with the Masaoka-Koga stage for thymomas only, there was no association between higher FDG activity and advanced disease measured by SUVmax (p=0.135), SUVpeak (p=0.097), and SUVmean (p=0.206) (Fig. 2 and 6). Greater volumes of FDG-avid tumor did correlate with advanced stage, as measured by tumor volume above 45% of SUVmax (p=0.002), as well as tumor volume above SUVmax 3.5 (p=0.029) (Table 7).
Table 6.
Association Between SUV and Pathology Stage (All Patients)
| SUV | Stage | p-value | |||
|---|---|---|---|---|---|
| I+II (n=21) | III+IV (n=30) | ||||
| Mean (SD) | Range | Mean (SD) | Range | ||
| Primary tumor SUVmax | 5.44 (2.52) | 1.50–12.70 | 9.10 (5.76) | 3.80–25.70 | 0.0053 |
| Primary tumor SUVpeak | 4.69 (2.11) | 1.50–10.70 | 7.91 (5.05) | 3.20–20.20 | 0.0037 |
| Primary tumor SUVmean | 3.43 (1.60) | 1.00–7.10 | 5.48 (3.42) | 2.40–15.00 | 0.0106 |
| Total tumor volume of SUV 45% (cm3) | 70.71 (81.41) | 6.10–341.90 | 239.69 (262.87) | 12.00–1076.00 | 0.0010 |
| Total volume above SUV 3.5 (cm3) | 37.06 (61.80) | 0.00–235.40 | 240.59 (307.56) | 0.90–1378.20 | 0.0008 |
SUV, standardized uptake value; SD, standard deviation
FIGURE 6.
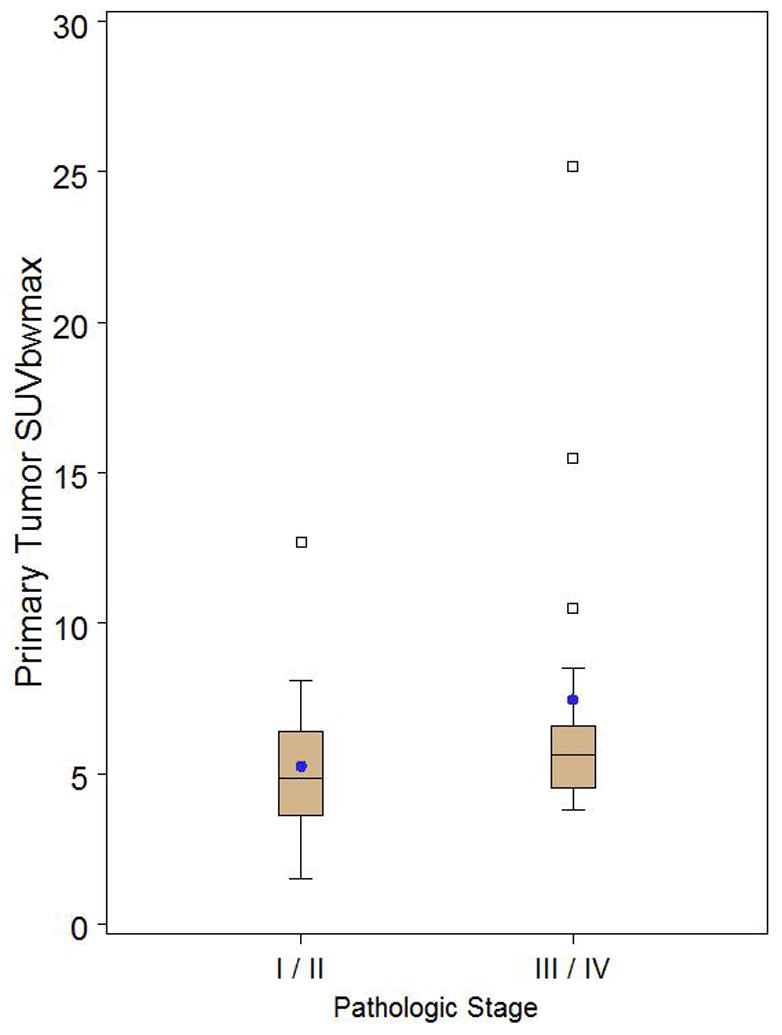
Box and whisker plot of thymoma only patients stratified by pathologic stage I/II (n=20) versus III/IV (n=17) demonstrating no significant difference in primary tumor SUVmax (p=0.1351). Observations above the upper fence, defined as 1.5 IQR above the 75th percentile, are displayed as squares. The middle black line in box represents the median. The blue dot represents the mean.
Table 7.
Association Between SUV and Pathological Stage (Thymoma Only)
| SUV | Stage | p-value | |||
|---|---|---|---|---|---|
| I+II (n=20) | III+IV (n=17) | ||||
| Mean (SD) | Range | Mean (SD) | Range | ||
| Primary tumor SUVmax | 5.26 (2.44) | 1.50–12.70 | 7.46 (5.42) | 3.80–25.20 | 0.1351 |
| Primary tumor SUVpeak | 4.58 (2.10) | 1.50–10.70 | 6.65 (5.05) | 3.20–23.20 | 0.0966 |
| Primary tumor SUVmean | 3.29 (1.50) | 1.00–7.10 | 4.51 (3.29) | 2.40–15.20 | 0.2055 |
| Total tumor volume of SUV 45% (cm3) | 74.04 (82.04) | 6.10–341.90 | 296.63 (318.08) | 28.00–1076.00 | 0.0022 |
| Total volume above SUV 3.5 (cm3) | 38.61 (62.99) | 0.00–235.40 | 257.74 (380.16) | 0.00–1378.20 | 0.0288 |
SUV, standardized uptake value; SD, standard deviation
Because of the clinical need to distinguish patients who have clinical Masaoka-Koga stage early disease from those who have locally advanced disease (stage III) at the time of initial staging CT, we also assessed whether the FDG uptake could differentiate early from advanced disease in our patient group. In this group of patients with clinical stage I–III epithelial thymic malignancies, the amount of FDG uptake, whether measured as SUVmax, SUVmean, or SUVpeak or whether measured volumetrically, could not stratify patients into the groups defined by disease stage (p=0.078–0.183). Similar results were seen when evaluating only the patients with clinical stage I–III thymoma: the amount of FDG uptake, whether measured as SUVmax, SUVmean, or SUVpeak or measured volumetrically, could not stratify patients into early and advanced disease groups (p=0.21–0.93) (Table 8).
Table 8.
Association Between SUV and Pathology Stage (Thymoma Only, Excluding Clinical Stage IV)
| SUV | Stage | p-value | |||
|---|---|---|---|---|---|
| I+II (n=20) | III (n=8)a | ||||
| Mean (SD) | Range | Mean (SD) | Range | ||
| Primary tumor SUVmax | 5.26 (2.44) | 1.50–12.70 | 4.81 (0.66) | 3.90–5.60 | |
| Primary tumor SUVpeak | 4.58 (2.10) | 1.50–10.70 | 4.15 (0.66) | 3.50–4.60 | 0.8987 |
| Primary tumor SUVmean | 3.29 (1.50) | 1.00–7.10 | 2.86 (0.38) | 2.30–3.10 | 0.7215 |
| Total tumor volume of SUV 45% (cm3) | 74.04 (82.04) | 6.10–341.90 | 109.75 (96.63) | 12.00–292.90 | 0.2128 |
| Total volume above SUV 3.5 (cm3) | 38.61 (62.99) | 0.00–235.40 | 18.19 (26.06) | 0.00–77.1 | 0.9387 |
SUV, standardized uptake value; SD, standard deviation
There were no pathological stage IV thymomas remaining after excluding clinical stage IV thymoma.
PET-CT and Outcome
Follow-up medical information was available for 50 of the 51 patients who presented with a thymic epithelial malignancy. Patients were followed for a median of 942 days (range:139–3,801 days). Fourteen patients had progression of disease and seven patients died. FDG uptake was not a predictor of progression-free survival time (p>0.12) nor of OS (p>0.06).
Follow-up medical information was available for all 37 patients who presented with thymoma. They were followed-up for a median of 1,049 days (range: 139–3,801 days). Six patients had progression of disease and two patients died. FDG uptake could not be used as a valid predictor of progression-free survival (p>0.11) nor of OS (p>0.10).
Discussion
Our study has shown that higher FDG uptake is associated with the more aggressive forms of thymic epithelial malignancies, thymic carcinoma, and thymic carcinoid, but it has also shown that focal FDG uptake cannot distinguish early from advanced disease in patients presenting with thymoma.
Thymoma is more common but carries a better prognosis than thymic carcinoma.11 Studies assessing the use of FDG PET in thymic epithelial malignancies have been small, reviewing from 10 to 49 patients only.12 Early results consistently showed that FDG uptake as measured by SUVmax was much higher in thymic carcinoma than in thymoma, a finding supported by our study as well7, 13–18, and correlates with the more aggressive nature of thymic carcinoma.
Our study has also shown that the user-friendly point of maximal FDG uptake, SUVmax, available on any workstation, or the SUVpeak found on some workstations, correlated better with histology than the more cumbersome volumetric measurements. This finding is useful for treatment planning for patients presenting with smaller masses suggestive of thymic epithelial malignancy because there are surgeons who advocate resection of such masses without preoperative biopsy confirmation. This could be problematic in cases of thymic cancer, for which neoadjuvant chemotherapy is often used because of the cancer’s aggressiveness and in cases of non-surgical/hematological malignancies such as lymphoma. Knowing the FDG uptake can help navigate patients to the correct treatment plan. Patients with lower FDG uptake would be presumed to have thymoma and would require surgery, while those with higher FDG uptake would have a biopsy performed to test for either thymic cancer or lymphoma.18, 19 Although we found the best value for this approach to be SUVmax ≥6, this should be interpreted with caution, as a similar study found the best value to be SUVmax ≥5 19. FDG uptake quantification is affected by many technical factors which vary from one institution to the other and is affected by physiologic factors which can alter the SUV by more than 50% 20.
Imaging studies so far have used a simplified system of low-risk (type A, AB, B1) thymoma and compared them to high-risk (type B2 and B3) thymomas, but this has produced variable results. Two studies showed that FDG PET helped differentiate low-risk from high-risk thymoma (type B2 and B3) 14, 18 while two other studies showed that it did not.7, 15 Because of these variable results, we sought to determine whether a different simplification of the WHO system, separating type B3 from the more indolent forms of thymoma, would better correlate with FDG uptake.22 We chose this form of classification in view of a recent study that assessed 250 thymoma patients and showed that type B3 thymoma has a significantly worse prognosis than the other types.23, 24 Indeed, in our study, FDG uptake was much higher when type B3 was separated from types A through B2. This is of clinical importance, not only for those patients who do not routinely undergo a biopsy procedure before surgery but also for those who do, as thymoma is a heterogeneous tumor and a biopsy does not always sample the most aggressive part of it. Thus, the FDG uptake could be used to direct those patients with a worse prognosis towards neoadjuvant therapy, whether they are part of the high-risk thymoma group (type B3) or the thymic carcinoma group 25–27. This is also useful as type B3 thymoma and thymic carcinoma have been shown in larger studies to commonly present with advanced (stage III or IV) disease 25–27.
In thymoma, the separation of early disease from advanced disease, the latter of which requires neoadjuvant therapy, is the most important goal in this clinical staging. Because most stage III thymomas do not present with direct signs of invasion on morphological imaging (CT or magnetic resonance imaging), recognizing locally advanced disease is challenging and often relies on indirect signs rather than the visualization of the invasion itself. 28 Having a physiological marker to help in the differentiation of advanced disease would be helpful. Unfortunately, we found that none of the volumetric FDG uptake metrics we assessed were helpful in separating early from advanced disease. We chose to assess FDG as measured by both SUVmax and SUVpeak because SUVmax is the most commonly used method for evaluating FDG uptake and is currently available on all commercially available PET-CT workstations. Because SUVmax is based on a single voxel value, its reproducibility is not as good as that of SUVpeak, which assesses a volume of approximately 1 cm3 around the area of maximal FDG uptake. 29 Our study is in agreement with another investigation 17 that confirmed the inability of FDG SUVmax to predict thymoma invasiveness. For many cancers, there is an ongoing fundamental debate about whether tumor prognosis and response to therapy are best evaluated by measuring tumor volume or by quantifying the most metabolically active portion of the tumor. 30–35 It is for this reason that we chose to measure FDG’s highest focal activity as well as its total metabolic volume. Interestingly, higher volumes of metabolic tumor did correlate with advanced disease. This, however, may have been due to the tumor size itself rather than its metabolic activity, as larger tumors are known to be associated with higher stages of disease 28. When patients with obvious clinical stage IV disease were excluded from this analysis, however, the association between total metabolic volume and advanced disease was no longer preserved, showing that, for thymic epithelial tumors, cumbersome volumetric measurements are probably not worthwhile.
The presence of higher FDG uptake in many tumors has been shown to be associated with a worse outcome, regardless of stage. 36–40 We could not find such an association for thymic epithelial malignancies in our study. It remains to be seen if FDG uptake will prove useful for monitoring the response of non-resectable thymic epithelial malignancies. A preliminary study of a subgroup of patients with non-resectable thymic epithelial malignancies has shown that OS was longer for those patients who had partial metabolic responses to treatment than for those who did not. 41
Our study’s main limitations relate to its retrospective nature and the small number of patients evaluated. However, it represents the largest series published so far of patients with this studied rare disease 12. Additionally, many prior studies have analyzed mixed populations of patients with thymic carcinoma and thymoma, creating difficulties in drawing conclusions that might be implemented into daily clinical use. We thus deliberately analyzed thymoma patients separately from thymic carcinoma patients so that our findings could inform daily clinical decision making.
In conclusion, although FDG PET-CT is an excellent tool for the assessment of the patient presenting with an anterior mediastinal mass and can be used to differentiate thymic carcinoma from thymoma, FDG uptake is not helpful in determining the disease stage. Thus for the time being, this imaging modality is reserved for detecting those patients more likely to require preoperative chemotherapy, such as patients with thymic carcinoma or the more aggressive type of thymoma, type B3.
Acknowledgments
Patricia S. Fox has received a Cancer Center Support Grant P30 CA016672 Osama Mawlawi consulted Siemens
Footnotes
Reginald F. Munden gave expert testimony for the Federal District Attorney Office, Florida
Stephen G. Swisher serves on the Magrit Advisory Board
The following authors have no financial relationships to disclose: Marcelo F.K. Benveniste, Cesar A. Moran, Edith M. Marom.
References
- 1.Duwe BV, Sterman DH, Musani AI. Tumors of the mediastinum. Chest. 2005;128:2893–2909. doi: 10.1378/chest.128.4.2893. [DOI] [PubMed] [Google Scholar]
- 2.Casey EM, Kiel PJ, Loehrer PJ., Sr Clinical management of thymoma patients. Hematol Oncol Clin North Am. 2008;22:457–473. doi: 10.1016/j.hoc.2008.03.010. [DOI] [PubMed] [Google Scholar]
- 3.Blumberg D, Port JL, Weksler B, et al. Thymoma: a multivariate analysis of factors predicting survival. Ann Thorac Surg. 1995;60:908–913. doi: 10.1016/0003-4975(95)00669-c. discussion 914. [DOI] [PubMed] [Google Scholar]
- 4.Antoch G, Stattaus J, Nemat AT, et al. Non-small cell lung cancer: dual-modality PET/CT in preoperative staging. Radiology. 2003;229:526–533. doi: 10.1148/radiol.2292021598. [DOI] [PubMed] [Google Scholar]
- 5.Shim SS, Lee KS, Kim BT, et al. Non-small cell lung cancer: prospective comparison of integrated FDG PET/CT and CT alone for preoperative staging. Radiology. 2005;236:1011–1019. doi: 10.1148/radiol.2363041310. [DOI] [PubMed] [Google Scholar]
- 6.Endo M, Nakagawa K, Ohde Y, et al. Utility of 18FDG-PET for differentiating the grade of malignancy in thymic epithelial tumors. Lung Cancer. 2008;61:350–355. doi: 10.1016/j.lungcan.2008.01.003. [DOI] [PubMed] [Google Scholar]
- 7.Sung YM, Lee KS, Kim BT, et al. 18F-FDG PET/CT of thymic epithelial tumors: usefulness for distinguishing and staging tumor subgroups. J Nucl Med. 2006;47:1628–1634. [PubMed] [Google Scholar]
- 8.Koga KMY, Noguchi M, Mukai K, Asamura H, Goya T, et al. A review of 79 thymomas: modification of staging system and reappraisal of coventional division into invasive and non-invasive thymoma. Pathol Int. 1994;44:359–367. doi: 10.1111/j.1440-1827.1994.tb02936.x. [DOI] [PubMed] [Google Scholar]
- 9.Travis WD, Brambilla E, Muller-Hermelik HK, et al. Pathology and Genetics of Tumours of the Lung, Pleura, Thymus and Heart. Lyon: IARC Press; 2004. [Google Scholar]
- 10.Shankar LK, Hoffman JM, Bacharach S, et al. Consensus recommendations for the use of 18F-FDG PET as an indicator of therapeutic response in patients in National Cancer Institute Trials. J Nucl Med. 2006;47:1059–1066. [PubMed] [Google Scholar]
- 11.Detterbeck F, Youssef S, Ruffini E, et al. A review of prognostic factors in thymic malignancies. J Thorac Oncol. 2011;6:S1698–1704. doi: 10.1097/JTO.0b013e31821e7b12. [DOI] [PubMed] [Google Scholar]
- 12.Kaira K, Sunaga N, Ishizuka T, et al. The role of [(1)(8)F]fluorodeoxyglucose positron emission tomography in thymic epithelial tumors. Cancer Imaging. 2011;11:195–201. doi: 10.1102/1470-7330.2011.0028. [DOI] [PMC free article] [PubMed] [Google Scholar]
- 13.Igai H, Matsuura N, Tarumi S, et al. Usefulness of [18F]fluoro-2-deoxy-D-glucose positron emission tomography for predicting the World Health Organization malignancy grade of thymic epithelial tumors. Eur J Cardiothorac Surg. 2011;40:143–145. doi: 10.1016/j.ejcts.2010.09.009. [DOI] [PubMed] [Google Scholar]
- 14.Kaira K, Endo M, Abe M, et al. Biologic correlation of 2-[18F]-fluoro-2-deoxy-D-glucose uptake on positron emission tomography in thymic epithelial tumors. J Clin Oncol. 2010;28:3746–3753. doi: 10.1200/JCO.2009.27.4662. [DOI] [PubMed] [Google Scholar]
- 15.Kumar A, Regmi SK, Dutta R, et al. Characterization of thymic masses using (18)F-FDG PET-CT. Ann Nucl Med. 2009;23:569–577. doi: 10.1007/s12149-009-0283-z. [DOI] [PubMed] [Google Scholar]
- 16.Sasaki M, Kuwabara Y, Ichiya Y, et al. Differential diagnosis of thymic tumors using a combination of 11C-methionine PET and FDG PET. J Nucl Med. 1999;40:1595–1601. [PubMed] [Google Scholar]
- 17.Shibata H, Nomori H, Uno K, et al. 18F-fluorodeoxyglucose and 11C-acetate positron emission tomography are useful modalities for diagnosing the histologic type of thymoma. Cancer. 2009;115:2531–2538. doi: 10.1002/cncr.24278. [DOI] [PubMed] [Google Scholar]
- 18.Terzi A, Bertolaccini L, Rizzardi G, et al. Usefulness of 18-F FDG PET/CT in the pre-treatment evaluation of thymic epithelial neoplasms. Lung Cancer. 2011;74:239–243. doi: 10.1016/j.lungcan.2011.02.018. [DOI] [PubMed] [Google Scholar]
- 19.Luzzi L, Campione A, Gorla A, et al. Role of fluorine-flurodeoxyglucose positron emission tomography/computed tomography in preoperative assessment of anterior mediastinal masses. Eur J Cardiothorac Surg. 2009;36:475–479. doi: 10.1016/j.ejcts.2009.03.055. [DOI] [PubMed] [Google Scholar]
- 20.Boellaard R. Standards for PET image acquisition and quantitative data analysis. J Nucl Med. 2009;50 (Suppl 1):11S–20S. doi: 10.2967/jnumed.108.057182. [DOI] [PubMed] [Google Scholar]
- 21.Rieker RJ, Hoegel J, Morresi-Hauf A, et al. Histologic classification of thymic epithelial tumors: comparison of established classification schemes. Int J Cancer. 2002;98:900–906. doi: 10.1002/ijc.10255. [DOI] [PubMed] [Google Scholar]
- 22.Suster S, Moran CA. Histologic classification of thymoma: the World Health Organization and beyond. Hematol Oncol Clin North Am. 2008;22:381–392. doi: 10.1016/j.hoc.2008.03.001. [DOI] [PubMed] [Google Scholar]
- 23.Moran CA, Walsh G, Suster S, et al. Thymomas II: a clinicopathologic correlation of 250 cases with a proposed staging system with emphasis on pathologic assessment. Am J Clin Pathol. 2012;137:451–461. doi: 10.1309/AJCP36ALGUZWOSEA. [DOI] [PubMed] [Google Scholar]
- 24.Moran CA, Weissferdt A, Kalhor N, et al. Thymomas I: a clinicopathologic correlation of 250 cases with emphasis on the World Health Organization schema. Am J Clin Pathol. 2012;137:444–450. doi: 10.1309/AJCP76KEGWQKWOKA. [DOI] [PubMed] [Google Scholar]
- 25.Chen G, Marx A, Chen WH, et al. New WHO histologic classification predicts prognosis of thymic epithelial tumors: a clinicopathologic study of 200 thymoma cases from China. Cancer. 2002;95:420–429. doi: 10.1002/cncr.10665. [DOI] [PubMed] [Google Scholar]
- 26.Fang W, Chen W, Chen G, et al. Surgical management of thymic epithelial tumors: a retrospective review of 204 cases. Ann Thorac Surg. 2005;80:2002–2007. doi: 10.1016/j.athoracsur.2005.05.058. [DOI] [PubMed] [Google Scholar]
- 27.Lee HS, Kim ST, Lee J, et al. A single institutional experience of thymic epithelial tumours over 11 years: clinical features and outcome and implications for future management. Br J Cancer. 2007;97:22–28. doi: 10.1038/sj.bjc.6603833. [DOI] [PMC free article] [PubMed] [Google Scholar]
- 28.Marom EM, Milito MA, Moran CA, et al. Computed Tomography Findings Predicting Invasiveness of Thymoma. Journal of Thoracic Oncology. 2011 doi: 10.1097/JTO.0b013e31821c4203. [DOI] [PubMed] [Google Scholar]
- 29.Wahl RL, Jacene H, Kasamon Y, et al. From RECIST to PERCIST: Evolving Considerations for PET response criteria in solid tumors. J Nucl Med. 2009;50 (Suppl 1):122S–150S. doi: 10.2967/jnumed.108.057307. [DOI] [PMC free article] [PubMed] [Google Scholar]
- 30.Al-Hajj M, Becker MW, Wicha M, et al. Therapeutic implications of cancer stem cells. Curr Opin Genet Dev. 2004;14:43–47. doi: 10.1016/j.gde.2003.11.007. [DOI] [PubMed] [Google Scholar]
- 31.Huff CA, Matsui W, Smith BD, et al. The paradox of response and survival in cancer therapeutics. Blood. 2006;107:431–434. doi: 10.1182/blood-2005-06-2517. [DOI] [PMC free article] [PubMed] [Google Scholar]
- 32.Li C, Heidt DG, Dalerba P, et al. Identification of pancreatic cancer stem cells. Cancer Res. 2007;67:1030–1037. doi: 10.1158/0008-5472.CAN-06-2030. [DOI] [PubMed] [Google Scholar]
- 33.Matsui W, Wang Q, Barber JP, et al. Clonogenic multiple myeloma progenitors, stem cell properties, and drug resistance. Cancer Res. 2008;68:190–197. doi: 10.1158/0008-5472.CAN-07-3096. [DOI] [PMC free article] [PubMed] [Google Scholar]
- 34.Chen HH, Chiu NT, Su WC, et al. Prognostic Value of Whole-Body Total Lesion Glycolysis at Pretreatment FDG PET/CT in Non-Small Cell Lung Cancer. Radiology. 2012 doi: 10.1148/radiol.12111148. [DOI] [PubMed] [Google Scholar]
- 35.Liu F, Zhao B, Krug LM, et al. Assessment of therapy responses and prediction of survival in malignant pleural mesothelioma through computer-aided volumetric measurement on computed tomography scans. J Thorac Oncol. 2010;5:879–884. doi: 10.1097/JTO.0b013e3181dd0ef1. [DOI] [PubMed] [Google Scholar]
- 36.Al-Sarraf N, Gately K, Lucey J, et al. Clinical implication and prognostic significance of standardised uptake value of primary non-small cell lung cancer on positron emission tomography: analysis of 176 cases. Eur J Cardiothorac Surg. 2008;34:892–897. doi: 10.1016/j.ejcts.2008.07.023. [DOI] [PubMed] [Google Scholar]
- 37.Berghmans T, Dusart M, Paesmans M, et al. Primary tumor standardized uptake value (SUVmax) measured on fluorodeoxyglucose positron emission tomography (FDG-PET) is of prognostic value for survival in non-small cell lung cancer (NSCLC): a systematic review and meta-analysis (MA) by the European Lung Cancer Working Party for the IASLC Lung Cancer Staging Project. J Thorac Oncol. 2008;3:6–12. doi: 10.1097/JTO.0b013e31815e6d6b. [DOI] [PubMed] [Google Scholar]
- 38.Sharif S, Zahid I, Routledge T, et al. Does positron emission tomography offer prognostic information in malignant pleural mesothelioma? Interact Cardiovasc Thorac Surg. 2011;12:806–811. doi: 10.1510/icvts.2010.255901. [DOI] [PubMed] [Google Scholar]
- 39.Zhang B, Li X, Lu X. Standardized uptake value is of prognostic value for outcome in head and neck squamous cell carcinoma. Acta Otolaryngol. 2010;130:756–762. doi: 10.3109/00016480903402981. [DOI] [PubMed] [Google Scholar]
- 40.Costelloe CM, Macapinlac HA, Madewell JE, et al. 18F-FDG PET/CT as an indicator of progression-free and overall survival in osteosarcoma. J Nucl Med. 2009;50:340–347. doi: 10.2967/jnumed.108.058461. [DOI] [PubMed] [Google Scholar]
- 41.Kaira K, Murakami H, Miura S, et al. 18F-FDG uptake on PET helps predict outcome and response after treatment in unresectable thymic epithelial tumors. Ann Nucl Med. 2011;25:247–253. doi: 10.1007/s12149-010-0455-x. [DOI] [PubMed] [Google Scholar]
- 42.Ambrosini V, Castellucci P, Rubello D, et al. 68Ga-DOTA-NOC: a new PET tracer for evaluating patients with bronchial carcinoid. Nucl Med Commun. 2009;30:281–286. doi: 10.1097/MNM.0b013e32832999c1. [DOI] [PubMed] [Google Scholar]
- 43.Miederer M, Seidl S, Buck A, et al. Correlation of immunohistopathological expression of somatostatin receptor 2 with standardised uptake values in 68Ga-DOTATOC PET/CT. Eur J Nucl Med Mol Imaging. 2009;36:48–52. doi: 10.1007/s00259-008-0944-5. [DOI] [PubMed] [Google Scholar]
- 44.Girard N, Teruya-Feldstein J, Payabyab EC, et al. Insulin-like growth factor-1 receptor expression in thymic malignancies. J Thorac Oncol. 2010;5:1439–1446. doi: 10.1097/JTO.0b013e3181e392a8. [DOI] [PubMed] [Google Scholar]


