Abstract
The determination of tobacco derived nicotine alkaloids in biofluid samples is of great importance to testing for tobacco use, tobacco cessation treatment, and studies on exposure to secondhand smoke. Paper spray mass spectrometry (MS) has been adapted for direct, quantitative analysis of tobacco alkaloids from biofluid samples such as blood, urine and saliva in liquid and dried form. Limits of quantitation as low as several ng/mL were obtained for nicotine, cotinine, trans-3′-hydroxycotinine and anabasine. Direct analysis of fresh blood samples has also been achieved with improved sensitivity using print paper substrates of high density. Quantitation of the cotinine in the blood of a rat was performed with both direct analysis using paper spray and a traditional analysis protocol using liquid chromatography MS. Comparable results were obtained and the precision of the two methods was similar. The paper spray MS method is rapid and shows potential for significantly improved analytical efficiency in clinical labs as well as for point-of-care tobacco use assessment.
INTRODUCTION
Tobacco use is a major preventable cause of disease in the US1, 2 while quitting smoking is extremely difficult. Based on data published by the Center for Disease Control in 2010, about 19% of all adults in the US3 are smokers and fewer than 10% of those who quit smoking for a day remained abstinent one year later.4 Smokers have a much higher risk of serious diseases, such as coronary heart disease, stroke, and lung cancer. The adverse health effects caused by smoking contribute to about one fifth of all deaths each year.1 Moreover, $193 billion is spent annually in the US on health issues related to cigarette smoking.5
Due to the significant adverse health effects of tobacco use, identification of smokers is becoming mandatory for health insurance. Testing for smoking is frequently performed for employment purposes but also increasingly ordered for disease diagnosis. These tests are typically done by quantitation of nicotine 2, 6 and its metabolites in blood or other biofluid samples. 7, 8 Nicotine is the major addictive chemical ingredient in tobacco while it is also used in pharmacotherapy for smoking cessation;9 to reduce withdrawal symptoms during smoking cessation, nicotine medications such as nicotine gum are often utilized to maintain a lowered but stable concentration of nicotine in blood.
Nicotine is mainly metabolized in the liver by the enzyme CYP2A6.8 Since the half-life of nicotine in the body is relatively short (about 2 hours), the quantitation of nicotine in biofluids does not provide an accurate assessment of tobacco use. Cotinine, a major metabolite of nicotine, has a much longer half-life of about 16 hours and it is currently used as the biomarker for tests of cigarette smoking and environmental tobacco smoke exposure. Cotinine is further metabolized by the same enzyme CYP2A6 to trans-3′-hydroxycotinine (3HC). A recent study showed that the ratio of 3HC to cotinine can be used as a convenient measure of CYP2A6 activity and so serves as a biomarker of nicotine metabolism in guiding dosage in nicotine medication.10–12 Although nicotine and its metabolites are widely used for assessment of tobacco use, they cannot be used to distinguish smokers from people taking nicotine medications. In such a scenario, another tobacco alkaloid anabasine is used as the marker, as it only exists in tobacco but not in nicotine-medication products.13, 14
Many methods have been reported for the assessment of tobacco use based on analysis of biofluid samples, including chromatography,15, 16 immunoassay,17 and gas chromatography (GC) or liquid chromatography (LC) mass spectrometry (MS)11. Among these methods, GC/MS and LC/MS are most widely used due to their high sensitivity and specificity and high accuracy for quantitation. The quantitation of nicotine and its metabolites is typically carried out with sample pretreatment including solid phase extraction, liquid–liquid extraction, and chromatography before electrospray ionization or atmospheric pressure chemical ionization and MS analysis.7, 18, 19 This standard procedure provides purified analytes from biofluid samples like blood or urine so improving the sensitivity by minimizing the matrix effect. This procedure can be labor-intensive and time-consuming, but can be suitable for a central analysis laboratory where large batches of samples are processed and analyzed in parallel.
The development of ambient ionization methods enabled the possibility of direct analysis of complex samples without the sample pretreatment mentioned above. 20–25 For example, the newly develop paper spray method has been applied for direct analysis of biological samples simply by wetting the sample on a paper substrate with 10–50 μL solvent and applying a high voltage to generate the spray. With proper incorporation of internal standards, accurate quantitation (<15%RSD) of therapeutic drugs in blood samples has been achieved at low concentrations 26–29 with blood sample volumes as low as 0.4 μL. The whole analytical process can be completed within one minute without any sample extraction or purification whatsoever. In this study, we demonstrate the capability of this technique for direct quantitation of biomarkers for identifying tobacco use by analyzing biofluid samples, including blood, urine and saliva. A comparison has also been made between paper spray MS and traditional LC-MS/MS methods in quantitation of the cotinine concentration in the blood of a rat after the administration of nicotine.
EXPERIMENTAL
Nicotine, cotinine, and anabasine were purchased from Sigma-Aldrich (St. Louis, MO). Trans-3′-hydroxycotinine and trans-3′-hydroxycotinine-d3 were purchased from Santa Cruz Biotechnology (Santa Cruz, CA). Nicotine-d3 and cotinine-d3 were purchased from CDN Isotopes (Quebec, Canada). Anabasine-d4 was purchased from United States Biological (Swampscott, MA). Bovine whole blood was purchased from Innovative Research (Novi, MI). Synthetic urine was purchase from CST Technologies (Great Neck, NY) and the saliva sample was donated by Dr. Zheng Ouyang who is the PI of this study.
To measure calibration curves, bovine whole blood was spiked with the alkaloids of interest and the corresponding isotopically labeled internal standards. For dried blood spot analysis, the paper was loaded with 5 μL whole blood, left in the open air overnight, and then stored in a sealed plastic bag containing desiccant at room temperature. For calibration curve measurements, three samples were examined at each concentration. The lower limit of quantitation (LLOQ) was calculated as 10 times the standard deviation of the blank samples containing internal standards divided by the slope of the calibration curve as shown in Equation 1,
| (1) |
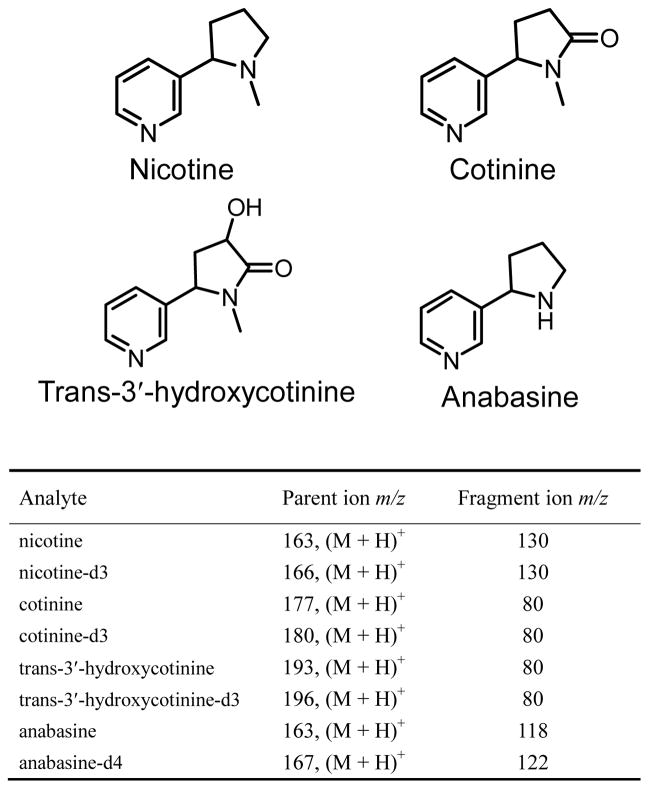
Grade 1 and 31ET chromatography paper was purchased from Whatman (Piscataway, NJ). Print paper (letter size, 75 g/m2) was purchased from Xerox (Norwalk, CT). The pore sizes for Grad 1 and 31ET chromatography paper are 11 μm and 21.5 μm, respectively, based on the information provided by Whatman. The pore sizes for print papers are typically much smaller, e.g. 0.1 μm.30 In our previous study, paper spray using chromatography papers was shown to have relatively low chemical interference.27 Print papers, however, can have various additional pigment coatings.30 For the Xerox print paper used in this study, strong peaks for PEG400 could be observed in the spectra after the paper was wetted for more than 5 minutes by pure organic solvents, such as acetonitrile, which is consistent with the finding in a previous study using DESI.31 In this study, each print paper substrate was used for only once of about 30s spray. The paper was cut into a triangle (base 7 mm, height 12 mm) and a copper clip was used to hold the paper triangle in front of and 3 mm from the mass spectrometer inlet. A high voltage 4 kV DC was applied through the copper clip to produce spray ionization at the tip of the paper triangle. Unless otherwise noted, 90% acetonitrile with 10% water was used as the spray solvent. All paper spray experiments were performed using a TSQ Quantum Access Max mass spectrometer (Thermo Scientific, San Jose, CA). All analytes were monitored in the selected reaction monitoring (SRM) mode. The SRM transitions employed are shown in the table in Figure 1.
Figure 1.
Structures of nicotine, cotinine, trans-3′-hydroxycotinine, and anabasine and SRM transitions for these compounds and their internal standards.
RESULTS AND DISCUSSION
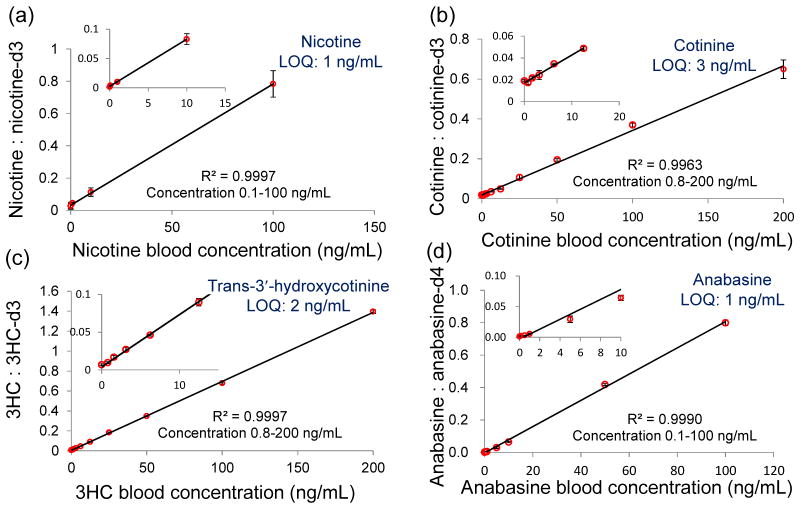
Nicotine, cotinine, 3HC, and anabasine were quantified directly from dried blood spots using paper spray ionization. The calibration curves of the four chemicals are shown in Figure 2. Good linearity was obtained throughout the concentration range tested. The LOQs of these four chemicals were between 1~3 ng/mL. The major biomarkers for testing tobacco use, cotinine, has an established cut-off value of ~14 ng/mL which discriminates between smokers and non-smokers.32
Figure 2.
Calibration curves of nicotine (a), cotinine (b), 3HC (c) and anabasine (d) in dried blood spots. The blood samples were spiked with each alkaloid and its isotopically labeled internal standard (100 ng/mL). Inset plot shows low concentration range. The bars represent the standard deviation of analysis for three replicates at different concentrations.
Different paper substrates were tested to optimize the LOQ. Chromatography paper of two thicknesses (grade 1 0.18 mm and 31 ET 0.5 mm), silica coated paper, and print paper were tested. It was found that print paper was the best paper substrate for all four chemicals. For 3HC and cotinine, similar results could be obtained using chromatography paper and print paper. However, for nicotine and anabasine, analysis with print paper showed much lower background signals than for chromatography paper thus significantly improving the LOQ.
Different methods of applying the solvent were found to have an impact on the analytical results. When the organic solvent was continuously applied to the print paper substrate, the background was low for the first several minutes and then gradually increased. The penetration of the organic solvent to the reverse side of the paper was found to be much slower for the print paper as well. These phenomena suggest that the lower background for using print paper substrates might be because the extraction of the matrix chemicals from the substrate was slower for the print paper than for other papers tested, which is not a surprise given the much smaller pore size of the print paper.
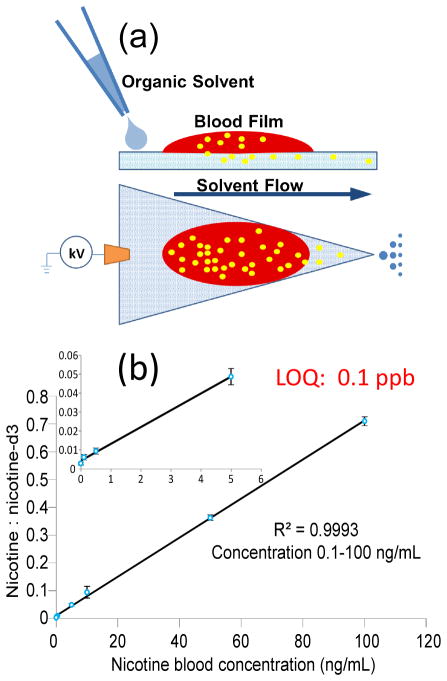
While dried blood spots were being investigated because this is a standard means for blood sample storage, analysis of fresh blood provides immediate results after the sample is taken and might be more compatible with point-of-care applications. Previously, addition of the coagulant alum has been shown to be effective in rapidly drying fresh blood on the paper before analysis using paper spray mass spectrometry.33 In this study, we applied paper spray for analysis of liquid blood samples on paper without drying them. As shown in Figure 3 (a), 5 μL fresh bovine blood was added onto the print paper and a thin blood film formed on the paper. Acetonitrile (20 μL) was then added to the paper immediately and 3.5 kV DC high voltage was applied. It was observed that the organic solvent facilitated the penetration of the blood into the paper substrate and the blood cells were trapped on the paper without being eluted toward the tip of the substrate. This helped to minimize contamination to the inlet of the mass spectrometer. Analysis was performed with fresh blood samples spiked with nicotine and its isotope-labeled internal standard at different concentrations and the calibration curve obtained is shown in Figure 3b. An LOQ of 0.1 ppb was obtained for the fresh blood analysis, which is one order of magnitude better than that for analysis using dried blood spots. In comparison with dried blood analysis, where the organic solvent is applied to extract the analytes from the solid sample spot, this procedure provides a possible liquid-liquid extraction between the spray solvent and the liquid blood sample, which might well has a higher efficiency for the extraction and hereby results in an improvement in the sensitivity.
Figure 3.
(a) Chemical extraction during paper spray ionization from fresh liquid blood. (b) Quantitative analysis of fresh liquid blood spiked with nicotine (0.1 ng/mL – 100 ng/mL) and its internal standard nicotine-d3 (100 ng/mL). Inset plot shows low concentration range. Three replicates for each concentration.
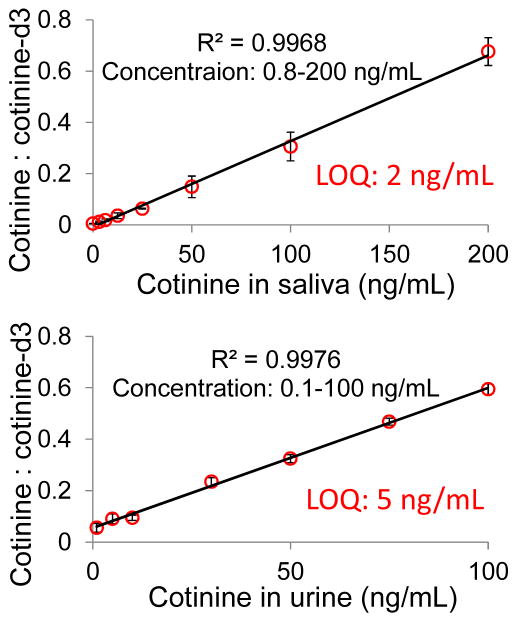
In addition to the analysis of blood samples, we also tested quantitation of cotinine directly from fresh liquid saliva and urine samples. Saliva (5μL) was added onto Grade 1 chromatography paper substrate and 30 μL acetonitrile was then applied as solvent for paper spray. The calibration curve obtained (Figure 4) shows a LOQ of 2 ng/mL, which is adequate for the test of tobacco use given the cut-off value at 14 ng/mL.32 For urine samples, it was found that the matrix effect was more serious than with blood and saliva samples, presumably due to its high concentrations of salts, which interfere with spray ionization. Cotinine could not be detected at concentrations lower than 30 ng/mL using acetonitrile as the solvent. Previously, it has been demonstrated that the addition of high levels of ammonium acetate could significantly counteract the signal suppression caused by metal ions for analysis of proteins 34 and organic compounds.35 This was attributed to the precipitation of metal ions from solution within the evaporating electrospray droplets. Similar improvement was found in our experiment. By adding 20 mM ammonium acetate into the urine solution, an LOQ as low as 5 ng/mL could be reached, which is better than the cut-off value of 50 ng/mL for the test using urine.32
Figure 4.
Calibration curves of cotinine in fresh liquid saliva (1 ng/mL – 200 ng/mL) and urine (1 ng/mL – 100 ng/mL) using printer paper. The bars represent the standard deviation of analysis for three replicates at different nicotine concentrations.
To further validate the potential of paper spray MS analysis of nicotine and its metabolites for clinical applications, an animal study was carried out and a comparison was made with the traditional LC-MS method. A male Sprague-Dawley rat (wight 260 g, age 8 weeks; Japan SLC, Shizuoka, Japan) was subcutaneously injected with nicotine (2 mg/kg, body weight) and sacrificed 6 hr afterwards, when the concentrations of nicotine and its metabolites in small rodents become relatively stable.36, 37 The blood samples were taken and the concentration of cotinine was determined using HPLC-MS following the plasma analysis protocol36, 37 and separately by direct analysis using paper spray MS. The HPLC-MS system consisted of an Agilent 1200 HPLC system (Agilent Technologies, Santa Clara, CA) with a SB-phenyl column (4.6 mm×150 mm, Agilent) and an Agilent 6460 triple quadrupole mass spectrometer. The samples were separated and preconcentrated using a gradient mobile phase consisted of water with 0.1% formic acid (solvent A) and acetonitrile with 0.1% formic acid (solvent B). The sample was eluted at a flow rate 0.80 mL/min with an increase from 0% A to 100% A in 15 min. Liquid blood samples each of 300 μL were used for HPLC-MS analysis while DBS samples each prepared with 1 μL blood on Grad 1 paper substrates were used for direct analysis using paper spray.
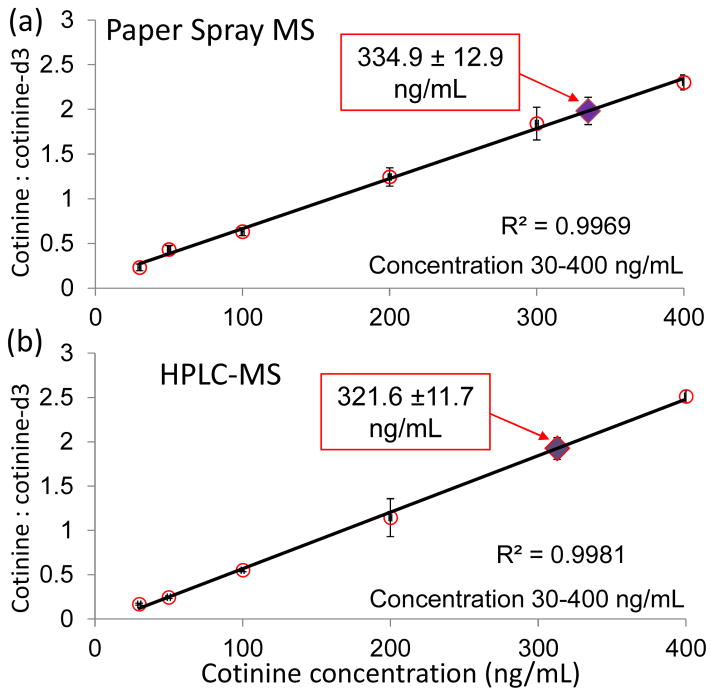
The calibration curves for both HPLC-MS and paper spray MS were established using bovine whole blood samples spiked with cotinine and the internal standard cotinine-d3. Good linearity was obtained for both methods, as shown in Figure 5. The rat blood samples were analyzed and the cotinine concentration was determined as 334.9±12.9 ng/mL by paper spray MS (Figure 5a) and 321.6±11.7 ng/mL by HPLC-MS (blue Figure 5b) method. The difference in concentration was less than 4% for these two methods and the precision of quantitation was similar. The concentrations of cotinine quantified for the rat were higher than previously reported, 31, 32 which was most likely due to the smaller size of the rat used in this study.
Figure 5.
Quantification of cotinine in the blood of a rat. Calibration curves of cotinine for a) paper spray MS analysis of DBSs and b) analysis of liquid blood using HPLC-MS method with the cotinine concentrations determined for rat indicated with solid diamonds. Three replicates for each concentration.
CONCLUSION
In summary, paper spray MS methodology has been developed for direct quantitation of tobacco nicotine alkaloids from biological fluids in the form of both dried spots and fresh liquid. This method shows potential in quantitating human exposure to tobacco and in studying nicotine metabolism related to diseases. It can be performed easily with blood, saliva and urine samples of about several microliters with adequate sensitivity. Relatively good quantitation previsions can also be achieved, with a confirmation by comparison with HPLC-MS method for determining the concentration of cotinine in the blood of a rat.
Acknowledgments
The authors gratefully acknowledge support from the National Science Foundation (Project CHE 0847205), National Science Foundation Instrumentation Development for Biological Research (DBI 0852740), National Center for Research Resources (5R21RR031246) and National Institute of General Medical Sciences (8 R21 GM103454) from the National Institutes of Health, and the Alfred Mann Institute for Biomedical Research at Purdue University.
References
- 1.White RE. Annual Review of Pharmacology and Toxicology. 2000;40:133–157. doi: 10.1146/annurev.pharmtox.40.1.133. [DOI] [PubMed] [Google Scholar]
- 2.Benowitz NL. Annual Review of Pharmacology and Toxicology. 2009;49:57–71. doi: 10.1146/annurev.pharmtox.48.113006.094742. [DOI] [PMC free article] [PubMed] [Google Scholar]
- 3.Chace DH, Kalas TA, Naylor EW. Clinical Chemistry. 2003;49:1797–1817. doi: 10.1373/clinchem.2003.022178. [DOI] [PubMed] [Google Scholar]
- 4.Fiore MC. Medical Clinics of North America. 1992;76:289–303. doi: 10.1016/s0025-7125(16)30354-6. [DOI] [PubMed] [Google Scholar]
- 5.Wong SF, Meng CK, Fenn JB. Journal of Physical Chemistry. 1988;92:546–550. [Google Scholar]
- 6.Benowitz NL. New England Journal of Medicine. 2010;362:2295–2303. doi: 10.1056/NEJMra0809890. [DOI] [PMC free article] [PubMed] [Google Scholar]
- 7.Kim I, Huestis MA. Journal of Mass Spectrometry. 2006;41:815–821. doi: 10.1002/jms.1039. [DOI] [PubMed] [Google Scholar]
- 8.Hukkanen J, Jacob P, Benowitz NL. Pharmacological Reviews. 2005;57:79–115. doi: 10.1124/pr.57.1.3. [DOI] [PubMed] [Google Scholar]
- 9.Henningfield JE. New England Journal of Medicine. 1995;333:1196–1203. doi: 10.1056/NEJM199511023331807. [DOI] [PubMed] [Google Scholar]
- 10.Benowitz NL, Pomerleau OF, Pomerleau CS, Jacob P. Nicotine & Tobacco Research. 2003;5:621–624. doi: 10.1080/1462220031000158717. [DOI] [PubMed] [Google Scholar]
- 11.Jacob P, Yu LS, Duan MJ, Ramos L, Yturralde O, Benowitz NL. Journal of Chromatography B-Analytical Technologies in the Biomedical and Life Sciences. 2011;879:267–276. doi: 10.1016/j.jchromb.2010.12.012. [DOI] [PMC free article] [PubMed] [Google Scholar]
- 12.Dempsey D, Tutka P, Jacob P, Allen F, Schoedel K, Tyndale RF, Benowitz NL. Clinical Pharmacology & Therapeutics. 2004;76:64–72. doi: 10.1016/j.clpt.2004.02.011. [DOI] [PubMed] [Google Scholar]
- 13.Jacob P, Yu L, Shulgin AT, Benowitz NL. American Journal of Public Health. 1999;89:731–736. doi: 10.2105/ajph.89.5.731. [DOI] [PMC free article] [PubMed] [Google Scholar]
- 14.Jacob P, Hatsukami D, Severson H, Hall S, Yu L, Benowitz NL. Cancer Epidemiology Biomarkers & Prevention. 2002;11:1668–1673. [PubMed] [Google Scholar]
- 15.Jacob P, Shulgin AT, Yu L, Benowitz NL. Journal of Chromatography-Biomedical Applications. 1992;583:145–154. doi: 10.1016/0378-4347(92)80547-4. [DOI] [PubMed] [Google Scholar]
- 16.Pichini S, Altieri I, Pacifici R, Rosa M, Ottaviani G, Zuccaro P. Journal of Chromatography-Biomedical Applications. 1992;577:358–361. doi: 10.1016/0378-4347(92)80259-s. [DOI] [PubMed] [Google Scholar]
- 17.Benkirane S, Nicolas A, Galteau MM, Siest G. European Journal of Clinical Chemistry and Clinical Biochemistry. 1991;29:405–410. doi: 10.1515/cclm.1991.29.6.405. [DOI] [PubMed] [Google Scholar]
- 18.Moyer TP, Charlson JR, Enger RJ, Dale LC, Ebbert JO, Schroeder DR, Hurt RD. Clinical Chemistry. 2002;48:1460–1471. [PubMed] [Google Scholar]
- 19.Pacifici R, Pichini S, Altieri I, Rosa M, Bacosi A, Caronna A, Zuccaro P. Journal of Chromatography-Biomedical Applications. 1993;612:209–213. doi: 10.1016/0378-4347(93)80165-z. [DOI] [PubMed] [Google Scholar]
- 20.Takats Z, Wiseman JM, Gologan B, Cooks RG. Science. 2004;306:471–473. doi: 10.1126/science.1104404. [DOI] [PubMed] [Google Scholar]
- 21.Cooks RG, Ouyang Z, Takats Z, Wiseman JM. Science. 2006;311:1566–1570. doi: 10.1126/science.1119426. [DOI] [PubMed] [Google Scholar]
- 22.Cody RB, Laramee JA, Durst HD. Anal Chem. 2005;77:2297–2302. doi: 10.1021/ac050162j. [DOI] [PubMed] [Google Scholar]
- 23.Harris GA, Galhena AS, Fernandez FM. Anal Chem. 2011;83:4508–4538. doi: 10.1021/ac200918u. [DOI] [PubMed] [Google Scholar]
- 24.Cochran KH, Barry JA, Muddiman DC, Hinks D. Anal Chem. 2013;85:831–836. doi: 10.1021/ac302519n. [DOI] [PMC free article] [PubMed] [Google Scholar]
- 25.Nemes P, Vertes A. Trac-Trend Anal Chem. 2012;34:22–34. [Google Scholar]
- 26.Manicke NE, Yang QA, Wang H, Oradu S, Ouyang Z, Cooks RG. International Journal of Mass Spectrometry. 2011;300:123–129. [Google Scholar]
- 27.Liu JJ, Wang H, Manicke NE, Lin JM, Cooks RG, Ouyang Z. Anal Chem. 2010;82:2463–2471. doi: 10.1021/ac902854g. [DOI] [PubMed] [Google Scholar]
- 28.Wang H, Liu JJ, Cooks RG, Ouyang Z. Angewandte Chemie-International Edition. 2010;49:877–880. doi: 10.1002/anie.200906314. [DOI] [PubMed] [Google Scholar]
- 29.Wang H, Manicke NE, Yang QA, Zheng LX, Shi RY, Cooks RG, Zheng OY. Anal Chem. 2011;83:1197–1201. doi: 10.1021/ac103150a. [DOI] [PMC free article] [PubMed] [Google Scholar]
- 30.Preston JS, Elton NJ, Legrix A, Nutbeem C, Husband JC. Tappi J. 2002;1:3–5. [Google Scholar]
- 31.Ifa DR, Gumaelius LM, Eberlin LS, Manicke NE, Cooks RG. Analyst. 2007;132:461–467. doi: 10.1039/b700236j. [DOI] [PubMed] [Google Scholar]
- 32.Jarvis MJ, Tunstallpedoe H, Feyerabend C, Vesey C, Saloojee Y. American Journal of Public Health. 1987;77:1435–1438. doi: 10.2105/ajph.77.11.1435. [DOI] [PMC free article] [PubMed] [Google Scholar]
- 33.Espy RD, Manicke NE, Ouyang Z, Cooks RG. Analyst. 2012 doi: 10.1039/c2an35082c. [DOI] [PubMed] [Google Scholar]
- 34.Iavarone AT, Udekwu OA, Williams ER. Anal Chem. 2004;76:3944–3950. doi: 10.1021/ac049724. [DOI] [PMC free article] [PubMed] [Google Scholar]
- 35.Rosu F, De Pauw E, Gabelica V. Biochimie. 2008;90:1074–1087. doi: 10.1016/j.biochi.2008.01.005. [DOI] [PubMed] [Google Scholar]
- 36.Onoue S, Yamamoto N, Seto Y, Yamada S. Drug Metabolism and Pharmacokinetics. 2011;26:416–422. doi: 10.2133/dmpk.dmpk-11-rg-019. [DOI] [PubMed] [Google Scholar]
- 37.Zhou X, Zhuo XL, Xie F, Kluetzman K, Shu YZ, Humphreys WG, Ding XX. Journal of Pharmacology and Experimental Therapeutics. 2010;332:578–587. doi: 10.1124/jpet.109.162610. [DOI] [PMC free article] [PubMed] [Google Scholar]


