Abstract
Background: We aimed at evaluating the toxicity effects of low (subtoxic) concentrations of silver nanoparticles (AgNP, 5-10 nm) in human hepatoblastoma (HepG2) cell line after and during a period of about one month. Methods: XTT and MTT assays were used to draw a dose-response curve; IC50 (half maximal inhibitory concentration) value of the AgNP on HepG2 cells was calculated to be 2.75-3.0 mg/l. The cells were exposed to concentrations of 0% (control), 1%, 4% and 8% IC50 of AgNP (corresponding to 0.00, 0.03, 0.12 and 0.24 mg/l of AgNP, respectively) for four consecutive passages. The treated cells were compared to the control group with respect to morphology and proliferation at the end of the period. Results: The biochemical studies revealed significant increases of lactate dehydrogenase and alanine aminotransferase enzyme activity in the culture media of cells receiving 4% and 8% IC50; the increases in the aspartate aminotransferase enzyme activity and nitric oxide concentration became significant at 8% IC50. In the cell extracts, the average total protein and activity of glutathione peroxidase enzyme remained unchanged; the decrease in the average content of glutathione (GSH) and superoxide dismutase (SOD) activity became significant at 4% and 8% IC50. There were increases in lipid peroxidation (significant at 4% and 8% IC50) and cytochrome c content (significant at 8% IC50). The accumulations of the effects, during the experiment from one generation to the next, were not statistically remarkable except in cases of GSH and SOD. The results indicate clearly the involvement of oxidative changes in the cells after exposure to low doses of AgNP. Conclusion: The results might help specify a safer amount of AgNP for use in different applications.
Key Words: Cytotoxicity, Liver, Enzyme activity
INTRODUCTION
Particles less than 100 nm in at least one dimension are called nanoparticles. The novel properties of nanoparticles and their greater reactivity as compared to their bulk material counterparts arise from their larger surface area per unit mass [1]. Since their discovery, nanomaterials have found many areas of application affecting and changing almost every aspect of human lifestyle. Silver nanoparticles (AgNP) have shown to possess many of the properties of the precious metal silver and likely to replace it in all traditional as well as numerous novel areas of applications; in medicine, for example, as antibiotics and bactericidal agent in fabrics and ointments for burns and wounds, and in home appliances as eating utensil, sleeping bags, textiles, food storage containers, jewelry, building materials and paints [2, 3].
Together with the growing tendency to use nanomaterials, concerns have also emerged about their adverse side effects on life and environment [4]. Silver and its nanoscale versions possess excellent antibacterial properties and their uncontrolled release into the environment may be challenging the balance of ecosystem by reducing the population of natural bacteria in soil and killing aquatic organisms, or by triggering natural selection of silver resistant bacteria, as genes similar to silver resistance genes have been found to exist in bacteria form environmental and clinical environments [5, 6]. Nanoparticles may enter the human body through ingestion, inhalation, and skin contact or genitourinary tract; inside the body, they may deposit in vital organs such as brain, liver or kidneys. They might change or damage the normal status of the cells at the nanolevel by passing through cellular membranes [7, 8] to interact with biomolecules to cause DNA and protein damage [9-12], or cross the blood-brain barrier to cause neurotoxicity [13]. Despite numerous and extensive reports on potential applications and benefits of AgNP, there is a lack of information concerning health and environmental implications of occupational exposure during manufacturing and handling processes and household applications.
As a detoxifying organ, liver becomes particularly important when ingestion is the entrance route to the body. HepG2 (human hepatoblastoma) cell line, derived from a HepG2 cell line, may be used for xenobiotic metabolism studies as it maintains many specialized functions of normal liver parenchymal cells such as synthesis and secretion of plasma proteins and cell surface receptors. The present study involves evaluation of a number of biochemical variables and morphology during and after exposure of HepG2 cells to low doses of AgNP for four consecutive generations.
MATERIALS AND METHODS
AgNP were purchased from Biocera Company of South Korea (http://www.biocera.co.kr/eng/ Biocera_NS.htm). They were a clear colloidal aqueous suspension with a concentration of 2000 PPM (or mg/l). The particles could be stably diluted with distilled water (no color change and no precipitation), but upon dilution with any buffer solution as PBS (phosphate buffered saline) or cell culture media, silvery precipitation was observed that could settle down and at greater dilutions (>1:100) the cloudiness and precipitation became less significant.
The plastic and glassware used for cell culturing were from Orange Scientific (Belgium); superoxide dismutase (SOD) and glutathione peroxidase (GSHPx) assay kits were purchased from Randox company (UK), cytotoxicity detection assay kit (LDH [lactate dehydrogenase]) and nitric oxide (NO) colorimetric assay kit from Roche Diagnostics GmbH (Germany), and aspartate aminotransferase (AST) and alanine aminotransferase (ALT) assay kits from Chem Enzyme company (Iran). Enzyme-linked immunosorbent assay for the quantitative detection of human Cytochrome c was obtained from BenderMedSystems. RPMI, fetal bovine serum (FBS), penicillin and streptomycin, MTT and Bradford solution were from Sigma Chemical Company (St. Louis, MO, USA). Cell proliferation kit (XTT) was procured from Roche diagnostics GmbH (Mannheim, Germany). All other analytical grade chemicals for biochemical studies were obtained from Sigma (USA) and Merck (Germany) Chemical Company.
Cell culture. The cell line HepG2 was obtained from National Center for Cell Sciences, Pasteur Institute of Iran (Tehran). The cells were cultured in RPMI medium supplemented with 1% (v/v) penicillin-streptomycin and 10% (v/v) heat inactivated FBS. Cells were maintained in 5% CO2 humidified incubator at 37ºC. During subculture, cells were detached by trypsinization when they reached 80% confluency.
In vitro cytotoxicity assay (dose-response relationship). Cell viability was tested using XTT and MTT assays both of which are based on the cleavage of the tetrazolium salt (XTT or MTT) by metabolically active cells to form a formazan dye which is soluble in case of XTT but water-insoluble in case of MTT. The insoluble dye formed in MTT assay was solubilized using isopropanol. Cells were seeded in 96-well tissue culture plates (1 × 10⁴ cells/200 l growth medium/well) followed by an overnight incubation. Nanoparticles, diluted 1:20 (100 ppm) with deionized water, were added to quadruplicate wells to a final concentration range of 0-6 mg/l and incubated for another 24 hours (for this reason, 0, 2, 4, 6, 8, 10, and 12 µl of the 100 ppm solution were added to quadruplicate wells). In case of MTT, supernatants were aspirated out and MTT reagent (200 l) was added to each well. After incubation for 3 h, the supernatants were replaced by 200 l isopropanol. With respect to XTT assay, the XTT labeling mixture (50 µl) was added directly to the wells. One hour after incubation with either isopropanol or XTT, the formazan dye was quantitated at 570 nm and 492 nm, respectively, using an ELISA reader (Anthos 2020, Austria). Concentrations of AgNP showing 50% reduction in cell viability (IC50 [half maximal inhibitory concentration] values) were then calculated.
Treatment with subtoxic AgNP. Cells were seeded twice independently into a duplicate series of four 75 cm2 flasks containing 30 ml of growth medium with 1 106 cells per flask. After an overnight incubation, the cells were challenged in duplicate with 0% (control group), 1%, 4% and 8% IC50 concentration of AgNP and incubated. When the control group reached about 80% confluency, the cell cultures in all the flasks were renewed. The cells were trypsinized and then pelleted by centrifugation at 800 rpm for 5 min. After a total cell count, another batch of 1 106 cells were reseeded in new flasks, the remaining cells were washed twice with PBS buffer and kept frozen for later analyses. The culture media were collected and total volumes recorded. They were further centrifuged at 1300 g and transferred into new tubes to separate cell debris. Using a 100 mM stock solution, phenylmethylsulfonyl fluoride (PMSF, final concentration of 5 mM) was added to prevent loss of enzyme activity due to serine proteases. They were kept frozen at -20C until use. Again, when the control flasks seemed to have reached 80% confluency, all four groups of flasks (total of 8 flasks; 2 controls and 2 of each of 1%, 4% and 8%) were subjected to the same procedure as above (the culture media collected and frozen and the cells trypsinized, pelleted, counted, a million of each seeded again and the rest frozen as pellets). This procedure was repeated 4 times, meaning that the cells in each flask were exposed to a given concentration of AgNP for four consecutive generations. At the end of final generation, before collection of cells, the morphological changes in four groups of cells were observed under an inverted microscope.
Biochemical assays in culture media. The frozen cell culture media were thawed and centrifuged at 1300 g to separate any sedimentation. In the supernatant, LDH, ALT and AST activities, as well as NO concentration were measured according to manufacturer's instructions of their respective assay kits.
Preparation of cell extract and biochemical assays. The cell pellets were suspended in 500 l chilled homogenizing buffer (250 mM sucrose, 12 mM Tris-HCl, 0.1% Triton X-100, pH 7.4, 5mM PMSF) and lysed. The lysates were centrifuged (12000 ×g, 10 min, 4C) and the supernatants (cell extracts) were used in various biochemical assays. Protein concentration in the cell extracts was estimated by Bradford method [14]. SOD dismutase and GSHPx activities and the concentration of cytochrome c released from mitochondria to cytoplasm were measured according to the instructions in assay kits. Lipid peroxidation was assayed by measuring malondialdehyde (MDA) [15], and the total glutathione (GSH, reduced) content was measured as described by Seldak and Lindsay [16].
Transmission electron microscopy (TEM). Two flasks of HepG2 cells (one control and one test) were prepared. The test cells were treated with 1 PPM of AgNP (10 µl of the original 2000ppm solution) for 12 hours. Both the untreated and the treated cells were trypsinized, washed with PBS and processed for TEM. Briefly, the cells were fixed in 2.5% glutaraldehyde in 0.1 M phosphate buffer, post-fixed in 1% osmium tetroxide and finally embedded in epoxy resin. Thin sections were stained with uranyl acetate followed by lead citrate and examined under a ZIESS electron microscope (EM902A) at 80KV. In case of AgNP morphology (Fig. 1), a drop of the original solution was placed on a carbon-coated copper grid, air dried, and observed with the same electron microscope.
Fig. 1.
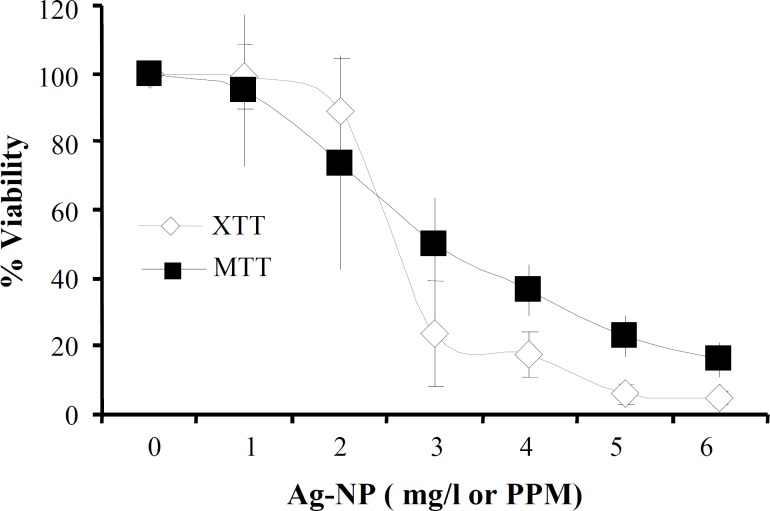
IC50 determination. Cell viability was measured by XTT and MTT assays on HepG2 cells after a 24 h exposure to increasing doses of AgNP. The data are expressed as mean standard deviation of two independent experiments. An OD value of control cells was taken as 100% viability. The relative cell viability related to control was calculated by [OD]test/[OD]control 100. Using the dose-response curves, IC50 was calculated to be 2.75-3.0mg/l (ppm).
Statistics. The experiment was carried out twice in duplicate. All enzyme activity measurements were performed once in duplicate. The results are presented as means ± S.D. Data were analyzed by unpaired student t-test (two-tailed) using GraphPad InStat Software program. The Welch test was applied when “standard deviations” were significantly different. Comparisons with P values <0.05 were considered to be statistically significant.
RESULTS
AgNP (NS series 2K) from Biocera resulted in the death of HepG2 cells and after 24 h exposure to AgNP concentrations ranging from 1-6 mg/l, 50% cell death (IC50) occurred at around 2.75-3.0 mg/l as determined from the dose-response curve obtained by XTT and MTT assays (Fig. 1). 1%, 4%, and 8% IC50 were calculated to be 0.03, 0.12, and 0.24 mg/l, respectively.
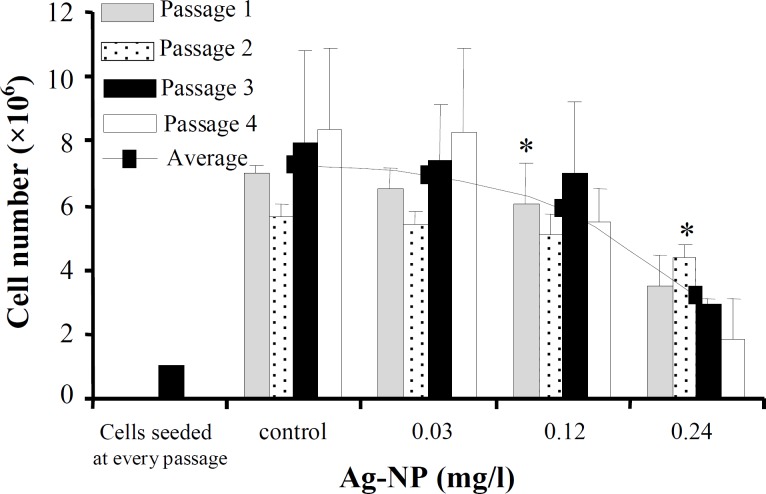
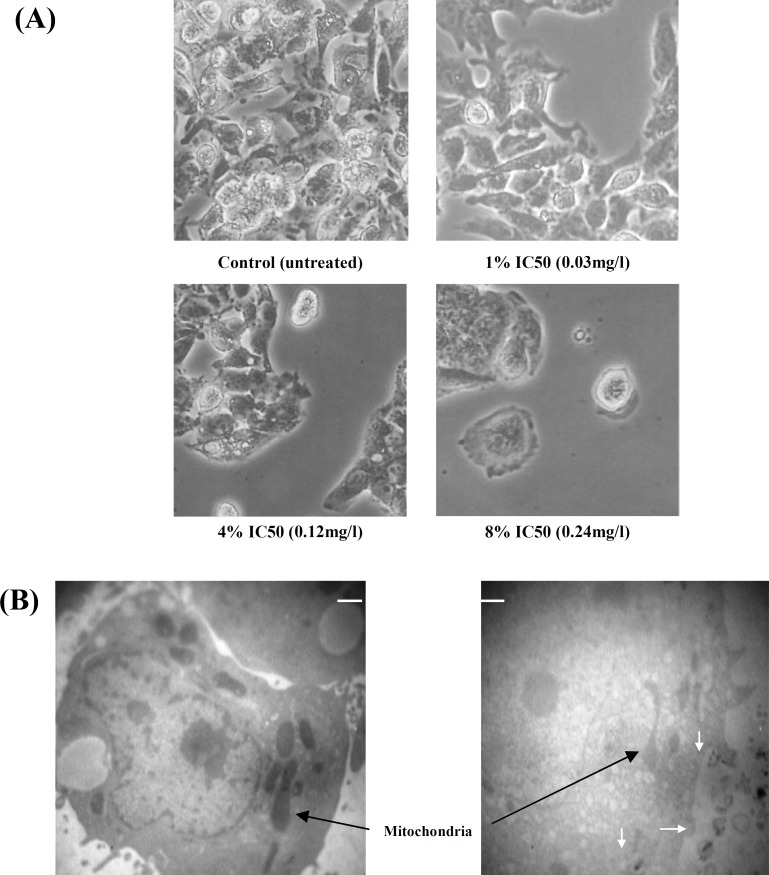
According to Figure 2, after four generations of exposure to 0.03, 0.12, and 0.24 mg/l, the cell population and the capacity of proliferation decreased significantly in the samples treated with 4% IC50 (0.12 mg/l) and 8% IC50 (0.24 mg/l), compared to the untreated control cells (P<0.05 andP<0.0001, respectively). Under the microscope, these cells seemed shrunken and rounded (Fig. 3A). TEM pictures showed heavy cell damage after treatment with 1 mg/l of AgNP for 12 hours (Fig. 3B).
Fig. 2.
Cell viability under low doses of AgNP and with time. After seeding in eight 75 cm flasks, the cells (1 106) were allowed to adhere. AgNP were added to duplicate flasks to reach final concentrations of 1%, 4%, and 8% IC50 value corresponding to 0.03, 0.12, and 0.24 mg/l, respectively. When the control flasks approached 70-80% confluent, the cells in all of the flasks were detached. After a total cell count, another batch of 1 106 cells was reseeded in new flasks, the rest was washed twice with PBS and kept frozen. Although an equal number of cells was seeded at every cell culture renewal (1 106), cells of the group receiving 0.24 mg/l could not proliferate quickly enough to fill the flasks during the same time period that the control flask reached its confluence. Data are expressed as mean SD of two duplicate experiments. * indicates a statistically significant difference relative to the control at 0.12 mg/l (P<0.05) and 0.24 mg/l (P<0.0001).
Fig. 3.
Morphological characterization of HepG2 cells. (A) Four groups of cells, control and those treated with three different concentrations of AgNP (0.03, 0.12, and 0.24 mg/l) were visualized by inverted microscope at the end of final exposure (magnification 32). (B) Two flasks of HepG2 cells (one control and one test) were prepared. The test cells were treated with 1 mg/l of AgNP for 12 h. Both the untreated and the treated cells were trypsinized, washed with PBS and processed for TEM. Despite apparently intact membranes, the cytoplasmic features and organelles of the treated cells including mitochondria are remarkably different from those of control cells. (Scale marker indicates 2500 nm, 3000). Clusters of AgNP are present both inside and outside of the cell (white arrows).
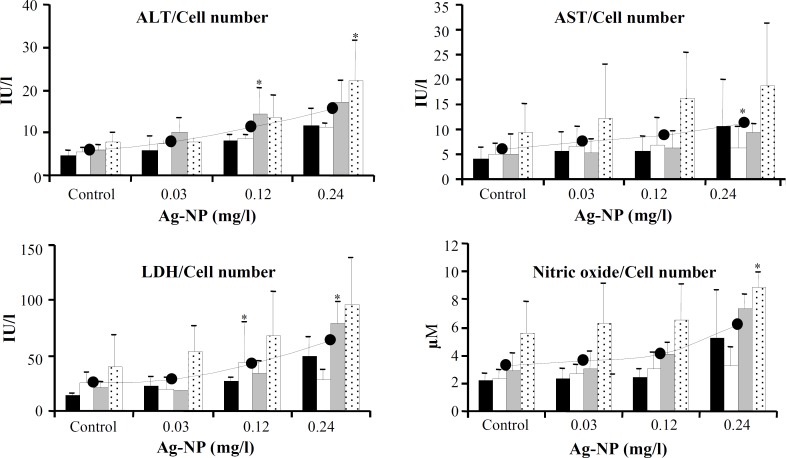
All the four variables monitored in the culture medium of cells showed dose-dependent increases (Fig. 4). Compared to unexposed cells, the average activities of LDH and ALT were significantly higher in the culture media of cells exposed to 4% (0.12 mg/l) and 8% IC50 (0.24 mg/l) of AgNP (for LDH: 63.8 IU/l, 43.0 IU/l and 24.8 IU/l; and for ALT: 15.4 IU/l, 11.1 IU/l and 5.8 IU/l, respectively, at 0.24 mg/l, 0.12 mg/l, and in unexposed cells). The increase in AST and NO was significant at 0.24 mg/l of AgNP (for AST: 11.2 IU/l compared to 5.9 IU/L and for NO: 6.2 M compared to 3.2 M in unexposed cells). For variables measured in culture media, the values were normalized by considering the respective cell numbers in each group.
Fig. 4.
Effect of AgNP on ALT, AST, LDH, and NO levels measured in culture media of unexposed control cells and cells exposed to 0.03, 0.12, and 0.24 mg/l of AgNP. The values were obtained using their respective assay kits, corrected according to the volume of culture media, and further normalized by considering the total cell number at the end of each generation. Data are expressed as mean SD of two duplicate experiments. *indicates a statistically significant difference compared to the control. Within each dose group, among generations one to four, the differences were not statistically significant. first exposure, second exposure, third exposure, fourth exposure and average.
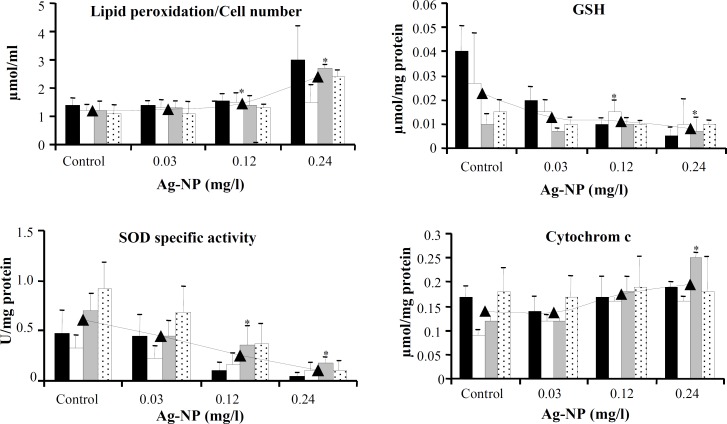
Among the variables measured in cell extracts, the reduced GSH content (0.023 µmol/mg, 0.01 µmol/mg, and 0.008 µmol/mg, respectively, for unexposed versus exposed to 0.12mg/l and 0.24mg/l of AgNP) and SOD specific activity (0.60 U/mg, 0.24 U/mg and 0.11 U/mg for unexposed versus exposed to 0.12 mg/l and 0.24 mg/l of AgNP, respectively) decreased. In addition, the level of lipid peroxidation (1.22 µmol/ml, 1.44 µmol/ml, and 2.4 µmol/ml for unexposed versus exposed to 0.12mg/l and 0.24mg/l of AgNP, respectively) and the concentration of cytochrome c (0.14 ng/ml, 0.17 ng/ml, 0.19 ng/ml for unexposed versus exposed to 0.12 mg/l and 0.24 mg/l of AgNP, respectively) increased compared to the unexposed cells. GSH and cytochrome c contents were normalized by dividing the values into the protein content in the cell extracts. Lipid peroxidation values were divided by cell number in each group (Fig. 5). The specific activity of GSHPx and the protein content remained unchanged (graphs not included).
Fig. 5.
Effect of AgNP on the levels of lipid peroxidation, total GSH, SOD activity and cytochrome c measured in cell extracts. Cells (control and treated with 0.03, 0.12, and 0.24 mg/l of AgNP) were homogenized for one hour on ice in a solution containing 5 mM PMSF. Measurements were done as described in the method section. The data are normalized by dividing each value by the protein content of its respective cell extract. Lipid peroxidation values were divided by cell numbers. Data are expressed as mean SD of two duplicate experiments. * denotes a statistically significant difference compared to the control (P<0.05). first exposure, second exposure, third exposure, fourth exposure and average
Within the group of cells receiving 0.24 mg/l of AgNP, significant differences were noted between generations 1 and 4 with regard to GSH (0.005 µmol/mg vs. 0.001 µmol/mg), and generations 1 and 3 with regard to SOD (0.05 U/mg vs. 0.18 U/mg). In case of SOD activity, the difference between generations 1 and 4 was also significant at 0.12 mg/l of AgNP (0.05 U/mg vs. 0.11 U/mg).
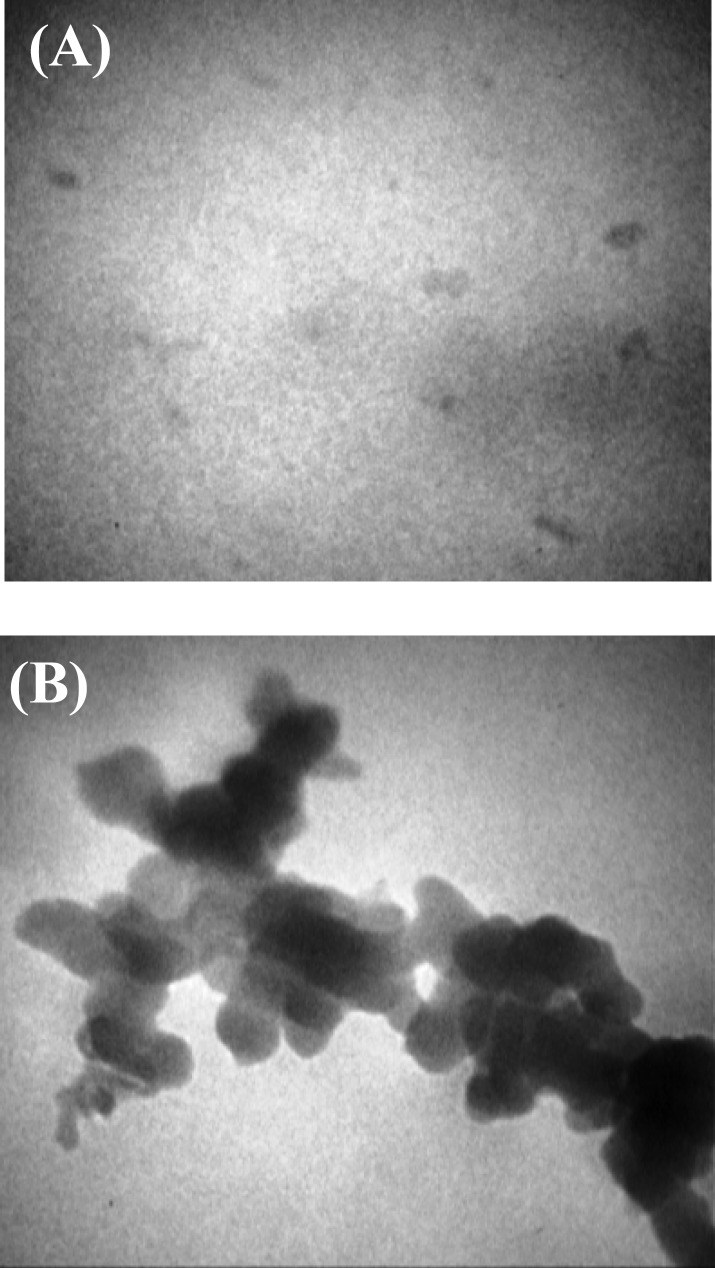
Finally, Figure 6 shows two pictures taken from different areas of a single TEM grid, indicating that although some AgNP had preserved their original state of being individual particles of 5-10 nm in size (Fig. 6A), most AgNP had formed aggregations larger than 150 nm (Fig. 6B).
Fig. 6.
Characterization of AgNP. A drop of the original solution was placed on a carbon-coated copper grid, air dried, and observed with ZIESS electron microscope (EM902A) at 80KV. Pictures (A) spherical around 10 nm, and (B) agglomerated structures above 150, were taken from different areas of one single grid. Most of the grid was covered with agglomerations. (Scale markers indicate 50 nm ( 140000) and 150 nm ( 50000), respectively.
DISCUSSION
As markers of cytotoxicity, the activities of enzymes such as SOD, GSHPx, LDH and catalase, and the contents of reduced GSH as well as the degree of lipid peroxidation have been measured and used by several studies to describe the oxidative stress-dependent acute toxic effects of ultrafine particles in various cell types [17-19]. Hussain et al. [19] reported a significant cytotoxicity of AgNP in BRL 3A rat liver cells. But, reports on the toxic effects of chronic long-term exposure to non-cytotoxic doses of nanoparticles are few. Kawata et al. [20] studied the toxicity effects of AgNP at low, non-toxic levels (up to 0.5 mg/l) by micronucleus test and DNA microarray analysis; they observed significant cytotoxicity at higher doses (>1.0 mg/l). Similar to Kim et al. [21] who used AgNO3 as a source of Ag+ ions, their parallel investigation of toxicity induced by Ag2CO3 resulted in the suggestion that "nanosized particles of Ag" are the major contributors to the cytotoxicity effects with limited contribution from "ionic Ag+" released from AgNP. AgNP have found numerous household applications, in water purification, and for disinfecting raw fruits and vegetables [22]. Their inclusion in some edible products as milk and canned foods as preservatives provides a further means of exposure of the liver organ of the human body to very low levels of AgNP [2, 23]. Therefore, this study was undertaken to assess whether very low, sub-IC50 levels of AgNP, can cause any serious damage to liver cells over time.
Untreated HepG2 cells (1 106 seeded) filled a 75 mm2 flask every 5-7 days; therefore, to achieve a long-term exposure time, the cells were treated with a given dose of AgNP for four consecutive generations. Always, the cells received AgNP 24 h after seeding because in the presence of nanoparticles, the cells could not adhere. There are two aspects for each graph. First, at every dose of AgNP, there exist four columns, each representing the concentration or the activity of a certain variable at each of the four consecutive generations of exposure. Second, the line in each graph connects the average points of the columns at each AgNP dose. Every average point is meant to represent the activity or the concentration of the variable if the cell culture would have survived all four passages in one batch.
Kawata et al. [20] observed an acceleration of cellular proliferation of HepG2 cells at very low concentrations of AgNP. The increase in cell number may be an initial effort by the liver to promote its detoxifying capacity after exposure to manageable levels of potential toxic substances. In this study, the occasional increases of cell number from one generation to the next were not statistically significant (Fig. 2). At high AgNP levels, i.e., after exposure to 1.0 mg/l for 24 hours in the study by Kawata et al., [20] and upon exposure to 0.12 and 0.24 mg/l for about 6 days in this study (average time required for one generation of 1 × 10⁶ cells to reach confluency in control flask), cell viability began to decrease significantly (Fig. 2). In addition to reducing cell viability, very low concentrations of AgNP damaged the cell membranes, evidenced by the release of LDH to the culture medium which became significant at 0.12 mg/l and 0.24 mg/l (Fig. 4). Looking at the averages, the rise in LDH levels in culture media with increasing AgNP dosage was accompanied by increases in NO levels and cellular lipid peroxidation. The relationship between NO and lipid peroxidation has been reported by Evereklioglu et al. [24]. There was also a loss of SOD activity suggesting that perhaps other types of free radicals, reactive oxygen species (ROS) not measured in this study, also accumulated within the cells in greater concentrations and along with NO enhanced further the cell membrane lipid peroxidation and damage. ALT and AST activities are liver function tests with ALT being more specific for liver. While the activity of AST rises in acute liver damages, high levels of ALT activity are a sign of chronic liver diseases [25]. The earlier and more significant rise in the activity of ALT may be suggestive of chronic liver condition under low concentrations of AgNP.
Inside the control and each of the treated groups, during the course of four generations, the changes in the activities of LDH, AST, ALT, and NO levels (the columns within each dose) were not statistically different from each other with the exception of SOD (at 0.12 and 0.24 mg/l) and GSH (at 0.24 mg/l). Despite the overall decline of average SOD activity with increasing AgNP dosage, the SOD activity within each dose showed a tendency to significantly increase from one generation to the next, possibly due to a natural attempt by the cells faced with oxidative stress to upgrade antioxidant capacity, analogous to the situation when successful upregulation of oxidative defenses sometimes help tumor cells resist oxidative insult from chemotherapy [26].
As suggested by Scibior et al. [27] decrease in GSH levels might have resulted from its increased utilization by antioxidant mechanisms. Increased activity of GSHPx and reaction catalyzed by glutathione S-transferase may have caused the reduction in GSH levels in the treated cells [27]. In this study, GSHPx levels remained basically unchanged with increasing dose of AgNP, and despite a significant reduction of cell number under different doses of AgNP, the protein content also remained constant implying the increased synthesis of some proteins in the treated cells of which GSHPx may be one. A greater effect of AgNP on SOD as compared to GSH has been observed by Arora et al. [18]. Cytochrome c which is associated with the internal membranes of mitochondria and a component of respiratory chain was measured in the cell extract. Its significant difference of concentration in the treated cells with 0.24 mg/l AgNP may be indicative of apoptosis taking place.
In addition, the role of apoptosis in AgNP toxicity has been revealed by DNA fragmentation and caspase-3 assay by Arora et al. [17]. In the present study, a comparison of electron microscopic pictures of the control and the cells treated with a final concentration of 1 mg/l of AgNP (created by a 10 l of the original 2000 mg/l solution) for 12 h showed some AgNP containing bodies and a considerable deterioration of inner organelles as mitochondria. Arora et al. [18] found 7-20 nm AgNP within the cytoplasm and mitochondria of primary rat liver cells after a 24 h exposure to about 1/2 IC50 (225 µg/ml) AgNP without signs of heavy cellular damage. Heavier damage was observed in our case when a 2000 mg/l stock solution was used to create a final concentration of 1 mg/l of AgNP (judged from TEM pictures) compared to little damage to mitochondria when the same AgNP concentration was created from a diluted solution (100 mg/l) (Fig. 3). This may be due to a transfer of different number of nanoparticles to the sample when using concentrated versus diluted stock solution which means that unlike soluble chemicals, cellular dosage of nanoparticles can be affected by processes as settling, diffusion and aggregation [28].
An evaluation of the original colloidal solution of 5-10 nm AgNP suspended in water, used in this study, under TEM showed few single, 5-10 nm silver particles but more of larger agglomerations (Fig. 6). Compared to non aggregated ones, aggregated nanoparticles may become more, less or equally toxic [29]. Insensible solvent evaporation or conditions such as long storage times, and temperature changes may be listed as reasons for nanoparticles aggregation; therefore, since aggregation can change the effective concentration, concerns may be raised upon over-the-counter colloidal silver products marketed as dietary supplements. Aggregation can as well complicate urinary excretion of nanoparticles from the body since large particles (>40 nm) are not filtered via the kidneys [30].
Considering the average course of events with increasing dosage of AgNP (0, 0.03, 0.12 and 0.24 mg/l), results of this study indicate that oxidative stress-dependent toxic effects due to exposure to AgNP can start becoming significant at doses much less that the calculated IC50. In addition, the results show that the accumulations of the effects with time from generation 1 to generation 4, within each dose group, were significant with regard to SOD activity and GSH content suggesting that the oxidative stress related events in the cells can become worse by repeated exposure.
ACKNOWLEDGMENTS
This research was funded by Tehran University of Medical Sciences and Health Services under Grant No. 132/246. Also, we would like to thank Seyed Mohammad Hadi Hashemi and the Electron Microscope Department of the School of Science, University of Tehran for their assistance with TEM pictures.
References
- 1.Kreuter J. Nanoparticles-a historical perspective. Int J Pharm. 2007;331(1):1–10. doi: 10.1016/j.ijpharm.2006.10.021. [DOI] [PubMed] [Google Scholar]
- 2.Maynard A D, Aitken R J, Butz T, Colvin V, Donaldson K, Oberdorster G, Philbert M A, Ryan J, Seaton A, Stone V, Tinkle S S, Tran L, Walker N J, Warheit D B. Safe handling of nanotechnology. Nature. 2006;444(7117):267–269. doi: 10.1038/444267a. [DOI] [PubMed] [Google Scholar]
- 3.Chen X, Schluesener H J. Nanosilver: a nanoproduct in medical application. Toxicol Lett . 2008;176(1):1–12. doi: 10.1016/j.toxlet.2007.10.004. [DOI] [PubMed] [Google Scholar]
- 4.Panyala N R, Pena-Mendez E N, Havel J. Silver or silver nanoparticles: a hazardous threat to the environment and human health. J Appl Med. 2008;6:117–129. [Google Scholar]
- 5.Silver S, Phung le T, Silver G. Silver as biocides in burn and wound dressings and bacterial resistance to silver compounds. J Ind Microbiol Biotechnol. 2006;33(7):627–634. doi: 10.1007/s10295-006-0139-7. [DOI] [PubMed] [Google Scholar]
- 6.Silver S. Bacterial silver resistance: molecular biology and uses and misuses of silver compounds. FEMS Microbiol Rev. 2003;27(2-3):341–353. doi: 10.1016/S0168-6445(03)00047-0. [DOI] [PubMed] [Google Scholar]
- 7.Chithrani B D, Stewart J, Allen C, Jaffray D A. Intracellular uptake, transport, and processing of nanostructures in cancer cells. Nanomedicine. 2009;5(2):118–127. doi: 10.1016/j.nano.2009.01.008. [DOI] [PubMed] [Google Scholar]
- 8.Li S Q, Zhu R R, Zhu H, Xue M, Sun X Y, Yao S D, Wang S L. Nanotoxicity of TiO2 nanoparticles to erythrocyte in vitro. Food Chem Toxicol . 2008;46(12):3626–3631. doi: 10.1016/j.fct.2008.09.012. [DOI] [PubMed] [Google Scholar]
- 9.Ahamed M, Karns M, Goodson M, Rowe J, Hussain S M, Schlager J J, Hong Y. DNA damage response to different surface chemistry of silver nanoparticles in mammalian cells. Toxicol Appl Pharm. 2008;233(3):404–410. doi: 10.1016/j.taap.2008.09.015. [DOI] [PubMed] [Google Scholar]
- 10.Liu R, Sun F, Zhang L, Zong W, Zhao X, Wang L, Wu R, Hao X. Evaluation on the toxicity of nanoAg to bovine serum albumin. Sci Total Environ. 2009;407(13):4184–4188. doi: 10.1016/j.scitotenv.2009.01.042. [DOI] [PubMed] [Google Scholar]
- 11.Ginzburg V V, Balijepalli S. Modeling the thermodynamics of the interaction of nanoparticles with cell membranes. Nano Lett. 2007;7(12):3716–3722. doi: 10.1021/nl072053l. [DOI] [PubMed] [Google Scholar]
- 12.Singh N, Manshian B, Jenkins G J S, Griffiths S M, Williams P M, Maffeis T G G, Wright C J, Doak S H. NanoGenotoxicology: The DNA damaging potential of engineered nanomaterials. Biomaterials. 2009;30:3891–3914. doi: 10.1016/j.biomaterials.2009.04.009. [DOI] [PubMed] [Google Scholar]
- 13.Rahman M F, Wang J, Patterson T A, Saini U T, Robinson B L, Newport G D, Murdock R C, Schlager J J, Hussain S M, Ali S F. Expression of genes related to oxidative stress in the mouse brain after exposure to silver-25 nanoparticles. Toxicol Lett. 2009;187(1):15–21. doi: 10.1016/j.toxlet.2009.01.020. [DOI] [PubMed] [Google Scholar]
- 14.Bradford M M. A rapid and sensitive method for the quantitation of microgram quantities of protein utilizing the principle of protein-dye binding. Anal Biochem. 1976;72:248–254. doi: 10.1016/0003-2697(76)90527-3. [DOI] [PubMed] [Google Scholar]
- 15.Ohkawa H, Ohishi N, Yagi K. Assay for lipid peroxides in animal tissues by thiobarbituric acid reaction. Anal Biochem. 1979;95(2):351–358. doi: 10.1016/0003-2697(79)90738-3. [DOI] [PubMed] [Google Scholar]
- 16.Seldak J, Lindsay R H. Estimation of total, protein-bound, and nonprotein sulfhydryl groups in tissue with Ellman's reagent. Anal Biochem. 1968;25(1):192–205. doi: 10.1016/0003-2697(68)90092-4. [DOI] [PubMed] [Google Scholar]
- 17.Arora S, Jain J, Rajwade J M, Paknikar K M. Cellular responses induced by silver nanoparticles: in vitro studies. Toxicol Lett . 2008;179(2):93–100. doi: 10.1016/j.toxlet.2008.04.009. [DOI] [PubMed] [Google Scholar]
- 18.Arora S, Jain J, Rajwade J M, Paknikar K M. Interactions of silver nanoparticles with primary mouse fibroblasts and liver cells. Toxicol Appl Pharm. 2009;236(3):310–318. doi: 10.1016/j.taap.2009.02.020. [DOI] [PubMed] [Google Scholar]
- 19.Hussain S M, Hess K L, Gearhart J M, Geiss K T, Schlager J J. in vitro toxicity of nanoparticles in BRL 3A rat liver cells. Toxicol In Vitro. 2005;19(7):975–983. doi: 10.1016/j.tiv.2005.06.034. [DOI] [PubMed] [Google Scholar]
- 20.Kawata Koji, Osawa M, Okabe S. in vitro toxicity of silver nanoparticles at noncytotoxic doses to HepG2 human hepatoma cells. Environ Sci Technol. 2009;43(15):6046–6051. doi: 10.1021/es900754q. [DOI] [PubMed] [Google Scholar]
- 21.Kim S, Choi J E, Choi J, Chung K H, Park K, Yi J, Ryu D Y. Oxidative stress-dependent toxicity of silver nanoparticles in human hepatoma cells. Toxicol In Vitro. 2009;23(6):1076–1084. doi: 10.1016/j.tiv.2009.06.001. [DOI] [PubMed] [Google Scholar]
- 22.Li Q, Mahendra S, Lyon D Y, Brunet L, Liga M V, Li D, Alvarez P J J. Antimicrobial nanomaterials for water disinfection and microbial control: Potential applications and implications. Water Res. 2008;42(18):4591–602. doi: 10.1016/j.watres.2008.08.015. [DOI] [PubMed] [Google Scholar]
- 23.Bouwmeester H, Dekkers S, Noordam M Y, Hagens W I, Bulder A S, de Heer C, ten Voorde S E C J, Wijnhoven S W P, Marvin H J P, Sips A J A M. Review of health safety aspects of nanotechnologies in food production. Regul Toxicol Pharm . 2009;53(1):52–62. doi: 10.1016/j.yrtph.2008.10.008. [DOI] [PubMed] [Google Scholar]
- 24.Evereklioglu C, Er H, Doganay S, Cekmen M, Turkoz Y, Otlu B, Ozerol E. Nitric oxide and lipid peroxidation are increased and associated with decreased antioxidant enzyme activities in patients with age-related macular degeneration. Doc Oophthalmol. 2003;106(2):129–136. doi: 10.1023/a:1022512402811. [DOI] [PubMed] [Google Scholar]
- 25.Park J H, Park C K, Kim E S, Park S Y, Jo C M, Tak W Y, Kweon Y O, Kim S K, Choi , Y W. The diagnostic value of serum hyaluronic acid, 7S domain of type IV collagen and AST/ALT ratio as markers of hepatic fibrosis in chronic hepatitis B and cirrhosis patients. Taehan Kan Hakhoe Chi. 2003;9(2):79–88. [PubMed] [Google Scholar]
- 26.Kumaraguruparan R, Kabalimoorthy J, Nagini S. Correlation of tissue lipid peroxidation and antioxidants with clinical stage and menopausal status in patients with adenocarcinoma of the breast. Clin Biochem. 2005;38(2):154–158. doi: 10.1016/j.clinbiochem.2004.10.012. [DOI] [PubMed] [Google Scholar]
- 27.Scibior D, Skrzycki M, Podsiad M, Czeczot H. Glutathione level and glutathione-dependent enzyme activities in blood serum of patients with gastrointestinal tract tumors. Clin Biochem. 2008;41(10-11):852–858. doi: 10.1016/j.clinbiochem.2008.03.005. [DOI] [PubMed] [Google Scholar]
- 28.Teeguarden J G, Hinderliter P M, Orr G, Thrall B D, Pounds J G. Particokinetics in vitro: dosimetry considerations for in vitro nanoparticle toxicity assessments. Toxicol Sci. 2007;95(2):300–312. doi: 10.1093/toxsci/kfl165. [DOI] [PubMed] [Google Scholar]
- 29.Soto K, Garza K M, Murr L E. Cytotoxic effects of aggregated nanomaterials. Acta Biomater. 2007;3(3):351–358. doi: 10.1016/j.actbio.2006.11.004. [DOI] [PubMed] [Google Scholar]
- 30.Sadauskas E, Wallin H, Stoltenberg M, Vogel U, Doering P, Larsen A, Danscher G. Kupffer cells are central in the removal of nanoparticles from the organism. Part Fibre Toxicol . 2007;4:10. doi: 10.1186/1743-8977-4-10. [DOI] [PMC free article] [PubMed] [Google Scholar]


