Abstract
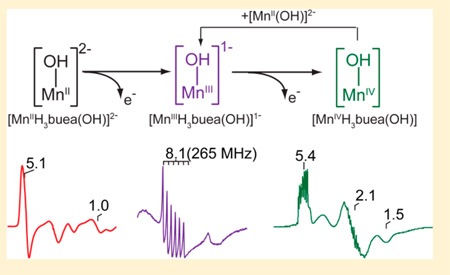
Manganese–hydroxo species have been implicated in C–H bond activation performed by metalloenzymes, but the electronic properties of many of these intermediates are not well characterized. The present work presents a detailed characterization of three Mnn–OH complexes (where n = II, III, and IV) of the tris[(N′-tert-butylureaylato)-N-ethylene]aminato ([H3buea]3−) ligand using X- and Q-band dual mode electron paramagnetic resonance (EPR). Quantitative simulations for the [MnIIH3buea(OH)]2− complex demonstrated the ability to characterize similar MnII species commonly present in the resting states of manganese-containing enzymes. The spin states of the MnIII and MnIV complexes determined from EPR spectroscopy are S = 2 and 3/2, respectively, as expected for the C3 symmetry imposed by the [H3buea]3− ligand. Simulations of the spectra indicated the constant presence of two MnIV species in solutions of [MnIVH3buea(OH)] complex. The simulations of perpendicular- and parallel-mode EPR spectra allow determination of zero-field splitting and hyperfine parameters for all complexes. For the MnIII and MnIV complexes, density functional theory calculations are used to determine the isotropic Mn hyperfine values, to compare the excited electronic state energies, and to give theoretical estimates of the zero-field energy.
INTRODUCTION
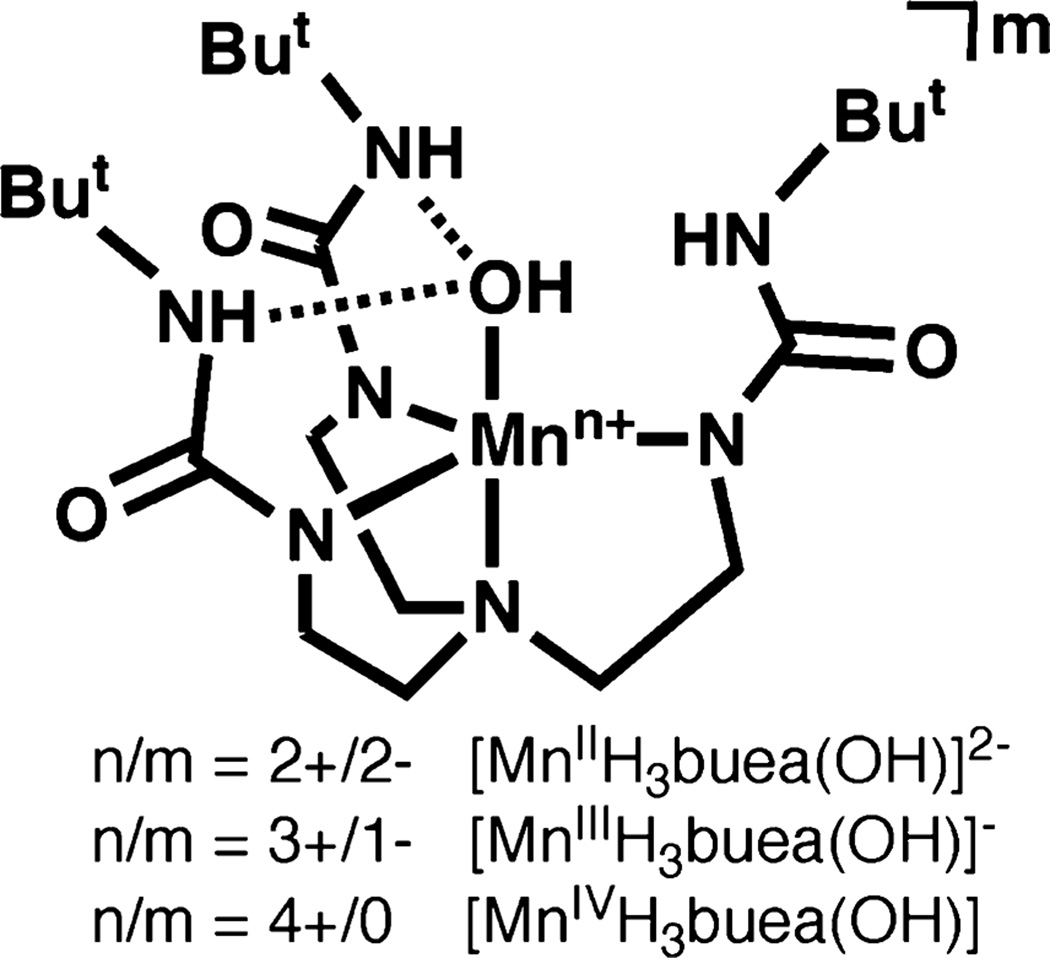
Non-heme manganese and iron complexes with terminal hydroxo and oxo ligands are proposed intermediates in the catalytic cycles of a variety of metalloproteins.1–4 The protonation state of the terminal oxygen ligand is a key factor in the reactivity of these intermediates.5 For example, the stepwise conversion of a Mn–OH2 species to a Mn–oxo species has been proposed to be essential for water oxidation in Photosystem II complex.6,7 Similarly, a high-valent Fe–oxo species is believed to convert to an Fe–OH complex via a rebound mechanism during the hydroxylation of C–H bonds in cytochrome P450.8–13 Biomimetic complexes have provided insight into the effects of protonation of the metal–oxo species without the added complexity introduced by the surrounding protein structure. For instance, the ligand tris[(N′-tert-butylureaylato)-N-ethylene]aminato ([H3buea]3−) forms both monomeric M–OH and M–oxo (M = Fe, Mn) complexes in various oxidation states at the metal center. This ligand has butylureaylato arms that form a H-bonding cavity around the M–O(H) unit.14 In addition, anionic ureato N-donors are used to enforce local trigonal symmetry at the metal center, thereby stabilizing high-spin electronic states for these complexes (Figure 1).
Figure 1.
Structure of the [MnnH3buea(OH)]m complexes characterized in this report.
We have characterized previously the electronic properties of the Fen–O(H) (n = II, III, or IV).15 In this report, the electronic properties of the corresponding Mnn–OH complexes (n = II, III, or IV) are determined from electron paramagnetic resonance (EPR) spectroscopy. EPR spectroscopy has long been important for the characterization of Mn complexes; however, the interpretation of spectra is often more complicated than the corresponding Fe complexes. The spin-orbit interactions of S = 5/2 MnII complexes result in lower zero-field energies (~D) that are comparable to the microwave energy (hv) for common X-band spectrometers. This causes mixing of spin states and multiple overlapping transitions, and consequently, the interpretation of spectra has been qualitative. High-field EPR studies on monomeric MnII and MnII have been reported in literature, which can give more accurate determinations of g- and D-values 16–20. We have developed a methodology for quantitative interpretation based on computer simulation of spectra, and here we demonstrate its use in the interpretation of X- and Q-band spectra for both parallel (B1 ‖ B) and perpendicular (B1 ⊥ B) orientations of the oscillating microwave field (B1) relative to the static field (B)21. The simulations allow unambiguous determination of the electronic parameters and the MnII concentrations directly from spectra. The analysis described for [MnII H3buea(OH)]2− is presented as a case study for interpretation of EPR signals from S = 5/2 MnII complexes, which can also be applied to manganese enzymes.
Oxidation of [MnII H3buea(OH)]2− yields the integer-spin (S = 2) MnIII–OH analog, which is best observed with B1 ‖ B, and our methodologies were applied to determine the electronic parameters and species concentrations for this species. Further oxidation produced the S = 3/2 MnIV–OH complex [MnIVH3buea(OH)], a new addition to this series. Half integer-spin MnIV complexes typically give simpler spectra due to the larger D-values relative to MnII , but simulations of the spectra showed that two S = 3/2 species were always present in a constant ratio. Density functional theory (DFT) calculations were performed to determine ground-state structures and electronic parameters, and comparisons of these results were made to the experimental values where possible. The ability to chemically prepare monomeric Mn– OH complexes in three oxidation states provided an opportunity to experimentally determine and compare the electronic properties of Mnn–OH complexes having the same primary and secondary coordination spheres.
EXPERIMENTAL METHODS
Preparation of Mnn+–OH Complexes
All reagents were purchased from commercial sources and used as received, unless otherwise noted. Solvents were sparged with argon and dried over columns containing Q-5 and molecular sieves. DMF was stored over activated 4 Å molecular sieves for 2 days in a Vacuum Atmospheres, Co. drybox under an Ar atmosphere and then decanted onto a second portion of 4 Å molecular sieves for 2 days before use. The syntheses of metal complexes were conducted in an Ar atmosphere. The preparation of K2[MnIIH3buea(OH)], K[MnIIIH3buea(OH)], and [Cp2Fe]BF4 followed the literature procedure.14,22,23
Sample Preparation for EPR Measurements
A solution of [MnIIH3buea(OH)]2− (5.0 µmol, 180 µL of a 28 mM solution in 1/1 THF/DMF) containing 2 equiv of 18-crown-6 ether (2.6 mg, 10 µmol) in an EPR tube was cooled to −78 °C in an acetone/dry ice bath for 15 min. The ether tightly bound to K+ ions to form an (18-crown-6 ether)(K+) pair, which provided better solubility of the MnII starting material. The same EPR signals were observed in the absence of ether. For generating [MnIVH3buea(OH)], 2 equiv of [Cp2Fe]BF4 (10 µmol, 40 µL of 250 mM solution in DMF) was injected with a gas tight syringe. The solution was allowed to sit for an additional 15 min and then frozen in liquid N2. A similar procedure was used for generating [MnIIIH3buea(OH)]− in situ from [MnIIH3buea(OH)]2− using 1 equiv of [Cp2Fe]BF4 (5.0 µmol, 20 µL of 250 mM solution in DMF). The same procedures were used when the samples with different concentrations were prepared.
EPR Spectroscopy
X-band EPR spectra were recorded on a Bruker 300 spectrometer equipped with an Oxford ESR-910 liquid helium cryostat. Q-band (34.0 GHz) EPR spectra were recorded on a Bruker 200 spectrometer with a home-built microwave probe and cryostat.24 The quantification of all signals is relative to a CuEDTA spin standard, the concentration of which is derived from an atomic absorption standard (Aldrich). For both instruments, the microwave frequency was calibrated with a frequency counter and the magnetic field with a NMR gaussmeter. A modulation frequency of 100 kHz was used for all EPR spectra. The EPR simulation software (SpinCount) was written by one of the authors.21 The software diagonalizes the electronic spin Hamiltonian H = βeB·g·S + S·D·S, where S is the total spin of the complex unless explicitly stated and the parameters have the usual definitions. The hyperfine term (S·A·I) is treated as a perturbation in second order for the energies of the spin states. The line width of the spectra is dominated by a distribution in the rhombicity E/D, where one standard deviation in the distribution is σE/D. The quantitative simulations are least-squares fits of the experimental spectra generated with consideration of all intensity factors, which allows computation of simulated spectra for a specified sample concentration.
DFT Calculations
The DFT calculations were performed using the hybrid functional B3LYP and the basis set 6–311G provided by Gaussian 03 (Revision E.01) software package.25 Geometry optimizations were terminated upon reaching the default convergence criteria and were performed for MnII–OH (S = 5/2), MnIII–OH (S = 2), and MnIV–OH (S = 3/2) complexes without imposing any symmetry on the complexes. The optimizations of the molecular structures for the MnII–OH and MnIII–OH were initiated using coordinates obtained from their structures determined via X-ray diffraction methods23 and MnIV–OH calculation was initiated using the X-ray diffraction structure of the MnIII–OH complex. Time-dependent (TD) DFT calculations were performed for the S = 2 and S = 1 states of the MnIII–OH complex and S = 3/2 states of the MnIV– OH complex. The TD-DFT calculations gave positive excitation energies suggesting that the self-consistent field (SCF) solutions represent the ground states.
RESULTS AND DISCUSSION
Oxidation of MnII–OH to MnIV–OH
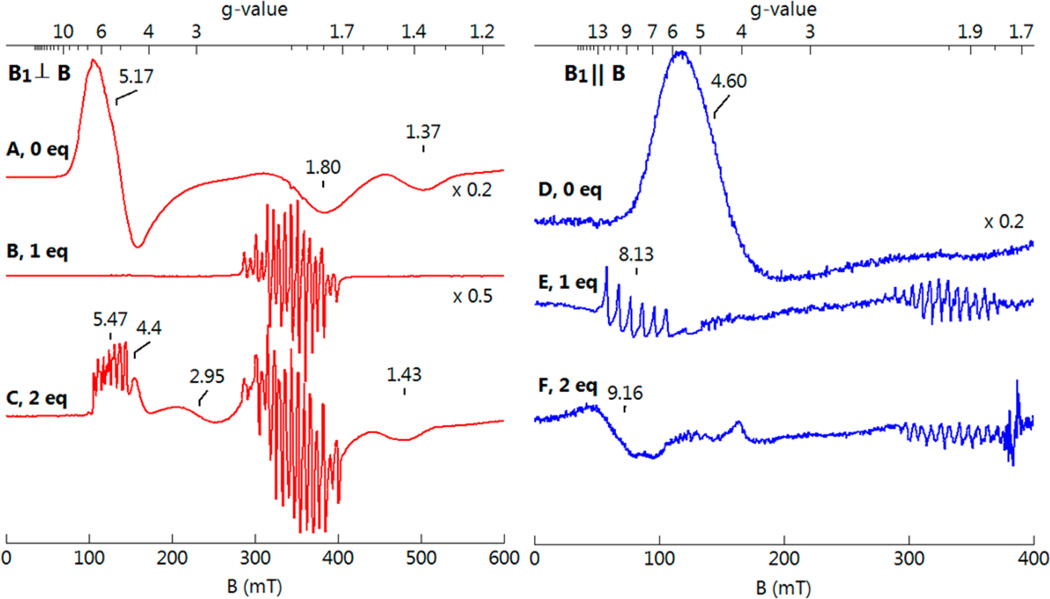
A series of EPR samples were prepared by treating [MnIIH3buea(OH)]2− with increasing amounts of the oxidant [Cp2Fe]BF4. The spectral changes are first summarized, and then further detail of each complex is given. EPR spectra of a typical oxidation experiment for the microwave magnetic field (B1) perpendicular (left side, red) or parallel (right side, blue) to the static magnetic field (B) are shown in Figure 2. The EPR data of the starting MnII–OH complex (Figure 2A,D) showed strong signals at g = 5.17, 1.80, and 1.37 in perpendicular mode and g = 4.60 in parallel mode from the S = 5/2 spin center. The addition of 1 equiv [Cp2Fe]BF4 resulted in the loss of the MnII–OH signals and the appearance of a six-line hyperfine signal centered at g = 8.14 (A = 270 MHz, a = 9.6 mT) in parallel mode (Figure 2B,E). This signal originates from an S = 2 spin center and is assigned to the MnIII–OH complex. The multiple-line hyperfine signal centered at g = 2 in perpendicular mode was from a minority binuclear mixed-valence species generated during the oxidation of the MnII–OH complex. The binuclear species was preparation dependent and accounted for less than 10% of the total Mn in the sample. The signal was also present in parallel mode due to imperfect alignment of B1 and B. The addition of another equivalent of [Cp2Fe]BF4 resulted in the loss of the six-line signal from the MnIII–OH complex in parallel mode and the appearance of signals in perpendicular mode (Figure 2C,F) at g = 5.47, 2.95, and 1.43. The positions of these resonances are indicative of an S = 3/2 spin state, and this signal is assigned to the MnIV–OH complex. The signal at g = 4.4 was from slight excess of [Cp2Fe]BF4 still present in the reaction mixture. The residual broad signal at g = 9.16 was from an impurity of unknown origin, and its amount was preparation dependent. As discussed below, the stepwise addition of [Cp2Fe]BF4 resulted in the near quantitative oxidation of the MnII–OH complex to the MnIII–OH complex, and then to the MnIV–OH complex. The signals from the MnIII–OH and MnIV–OH complexes are distinctly different than the signals of the corresponding Mn–oxo complexes.26
Figure 2.
Perpendicular mode (red) and parallel mode (blue) EPR spectra of (A, D) 10 mM MnII–OH in in DMF/THF; (B, E) +1 equiv [Cp2Fe]BF4; (C, F) +2 equiv [Cp2Fe]BF4. Experimental conditions: temperature, 10 K; power, 0.2 mW; frequency, 9.63 (red), 9.29 (blue) GHz.
MnII–OH Complex
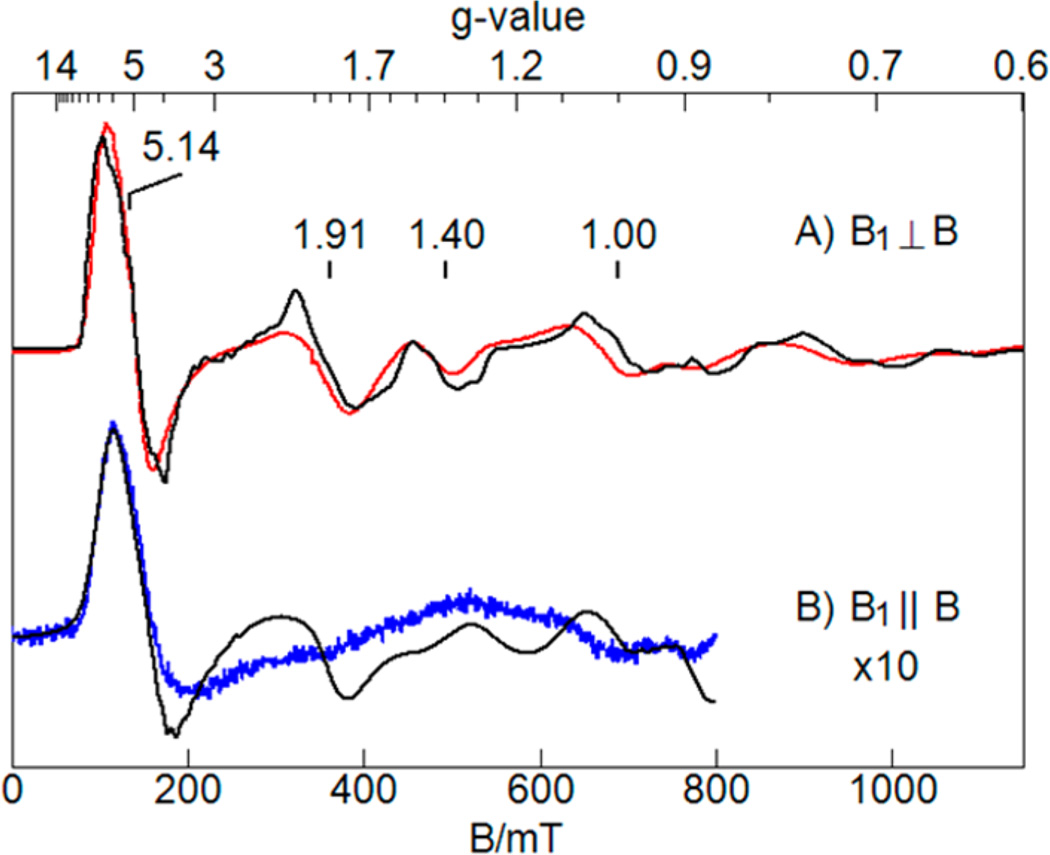
The EPR spectra are complicated by resonances from multiple overlapping transitions, which is often true for MnII complexes, but advances in simulation capabilities can now provide a detailed interpretation with specific resonance assignments. The present work is a relatively rare presentation of data from perpendicular and parallel modes at both X-band and Q-band microwave frequencies. Half-integer spin systems for which the Kramers doublets (±ms) are well separated in energy (D ≫ hv) normally have no intensity in parallel mode. For MnII complexes, however, the magnitude of zero-field splitting (D) is often comparable to the energy of the microwave quantum (hv) for X-band spectrometers. For this regime, the magnetic ms levels are significantly mixed and ms is not a strictly good quantum number. In such instances, parallel mode signals can be observed. Figure 3 shows X-band EPR spectra of [MnIIH3buea(OH)]2− on a wider magnetic scale than that of Figure 2 with simulations using the parameters of Table 1. The simulation intensity quantitatively predicted the sample concentration determined from the weight of the complex dissolved in the solvent. The simulations indicated a small rhombicity (E/D = 0.03), and as discussed later, this complex is nearly axial in comparison to the corresponding FeIII–OH complex with [H3buea]3− (E/D = 0.17).
Figure 3.
X-band EPR spectra (colored) and simulations (black) of the MnII –OH complex, 5 mM in DMF/THF, (A) B1 ⊥ B, (B) B1 ‖ B. The complex is the same state as that of Figure 2A, D but shown for a wider field range. Experimental conditions: temperature, 10 K; power, 0.2 mW; frequency, 9.634 (A), 9.299 (B) GHz. The simulation parameters are in Table 1.
Table 1.
EPR Parameters of the Mnn+–OH Complexes
| complex | S | D, cm−1 | E/D, σE/D | g | A, MHz | Aiso, MHz |
|---|---|---|---|---|---|---|
| MnII–OH | 5/2 | −0.28(1) | 0.031(3), 0.006 | 1.95(5), 1.99(5), 1.99(5) | 250(25) | |
| MnIII–OH | 2 | +1.7(5) | 0.05, 0.02 | −, −, 2.040a | −, −, 270(5)a | 212 |
| MnIV–OH (S1) | 3/2 | +0.88(5) | 0.31(1), 0.015 | 2.00(5), 2.01(5), 2.00(5) | 257, 190(2), 210(2) | 219 |
| MnIV–OH (S2) | 3/2 | +0.67(5) | 0.17(1), 0.015 | 2.00(5), 2.05(5), 2.00(5) | 252, 210(2), 210(2) | 224 |
Values with “−” are not determined.
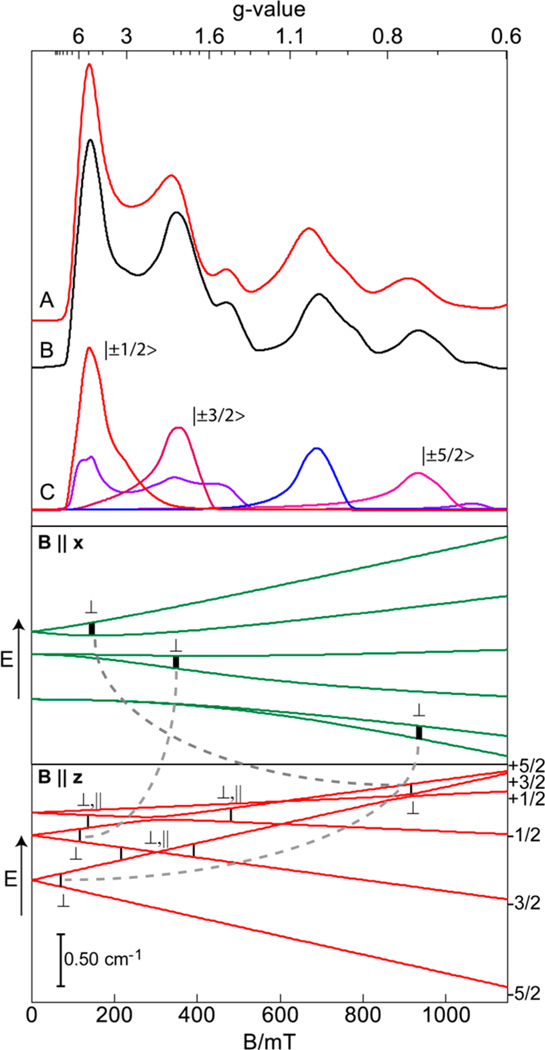
The MnII–OH spectra were complicated by the overlap of resonances from many different transitions within the S = 5/2 manifold. Figure 4C shows the simulated contribution of the signal from each transition for B1 ⊥ B, which are plotted as absorption spectra to simplify the presentation. Figure 4B shows the resulting sum of all the individual signals of Figure 4C, which matched the experimental absorption spectrum of Figure 4A. The lower region in Figure 4 shows the energy levels for B parallel to the x and z directions of the molecular frame determined by the D-tensor. The corresponding transitions are indicated with the polarization of incident field that induced the transitions. For B ‖ x, there are three signals with large contributions (reddish simulations) from the approximate |±ms〉 transitions indicated on the figure. In the limit of large D-value, the |1/2〉 transition would display (in the absence of hyperfine) the common g = 6.0 resonance that dominates EPR spectra of iron complexes (e.g., ferric porphyrins). As the field rotates toward the z-axis, the resonances move as indicated by the dashed line. The two bluish simulations are interdoublet (looping) transitions that have no contribution for B ‖ x but have contributions for field angles of θ < 60° with B1 ⊥ B. These interdoublet transitions are also the dominate contributions to the B1 ‖ B spectra of Figure 3B, the most intense is at g = 4.4 and corresponds to the transition |+3/2 〉↔|−1/2〉. Several of the levels are separated by an energy spacing close to the D-value, allowing an accurate determination from simulation, D = −0.28(1) cm−1. The sign and magnitude of the D-value are determined from fitting 2 and 10 K spectra (Figure S1, Supporting Information). The A-tensor for MnII ions is typically isotropic with a magnitude of approximately 250 MHz (89 G).29 The hyperfine splitting for the MnII–OH complex was unresolved because of broadening by intermo-lecular interactions; however, the line widths are a strong function of the unresolved hyperfine broadening. The hyperfine term of the spin Hamiltonian has a different magnetic field dependence than the other terms that typically dominate the line width, specifically distributions in D and E/D. Consequently, an approximate A-value of 250 ± 25 MHz was determined from simulations of the experimental spectra, which have different microwave frequencies and multiple transitions.
Figure 4.
Top panel: Absorption X-band EPR spectrum (A) and simulation (B) of the MnII–OH complex. The simulation parameters are in Table 1. (C) The contributions from approximate |±ms〉 transitions (reddish lines) and interdoublet transitions (bluish lines). Bottom two panels: The energies of the S = 5/2 spin manifold versus magnetic field B are shown for applied field along the x-axis (green) and z-axis (red) of the D-tensor. The vertical bars correspond to 9.6 GHz and indicate the important transitions for microwaves oscillating B1 ⊥ B and B1 ‖ B.
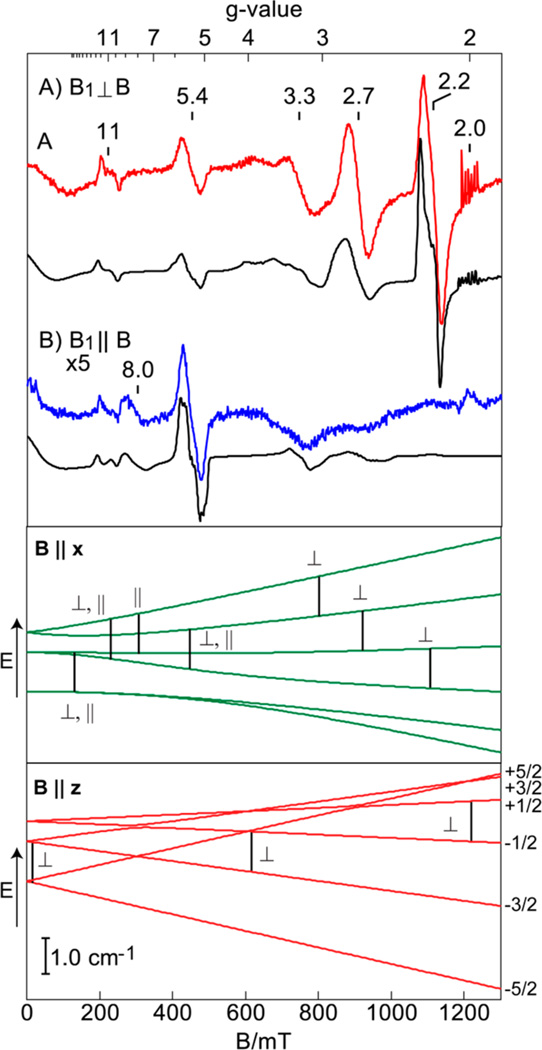
Figure 5 shows perpendicular and parallel mode Q-band EPR spectra and simulations for the electronic parameters of Table 1. As in Figure 4, the energy level diagrams in Figure 5 indicate the transitions with higher intensity and the direction of the incident oscillating microwave field for the transition. Similar to the X-band features, the higher intensity signals in perpendicular mode for Q-band (Figure 5A) originate from transitions with B ‖ x. The marked transitions for B ‖ z are allowed, but the corresponding signals are generally weak due to the polycrystalline average of the nearly axial complex, which results in relatively few molecules with B ‖ z. The most intense signals are at g = 3.3, 2.7, and 2.2 and are transitions obeying the standard selection rule Δms = ±1. In parallel mode (Figure 5B), the g = 8 and 5.4 signals are from Δms = ±2 transitions. The signal at g = 2.0 is from an unknown minority MnII impurity (<0.1% of total Mn).
Figure 5.
Q-band EPR spectra (colored lines) and simulations (black lines) of 5 mM MnII –OH in DMF/THF, (A) B1 ⊥ B; (B) B1 ‖ B. Experimental conditions: temperature, 11 K; frequency, 33.90 GHz; power, 5 µW (A), 50 µW (B). The energy diagrams are for the same spin system as Figure 4. The vertical bars correspond to 33.9 GHz and indicate the important transitions for microwaves oscillating B1 ⊥ B and B1 ‖ B.
The simulations of Figures 3–5 used the same parameters (Table 1) to fit the parallel and perpendicular mode spectra at both X- and Q-band frequencies. A simultaneous fit of all these spectra gave a unique result that quantitatively predicted the amount of the MnII –OH complex However, the simulation of the parallel mode X-band spectrum (Figure 3B) predicted resonances that are overall sharper than the experimental spectrum. Simply increasing various parameters that control line widths resulted in overly broad resonances for the other three spectra (both modes of Q-band, and perpendicular mode of X-band). Currently, we are unable to explain the overly broad parallel mode X-band spectra. We have observed a similar problem in parallel mode spectra of MnEDTA and for MnII bound protein systems. Intermolecular interactions can be ruled out as the source of broadening for the latter. The magnitude of the broadening is too large to be associated with ligand hyperfine (1H, 14N). As well, g-strain for MnII complexes is insufficient because the intrinsic g-values are close to 2.00. The lineshapes are a strong function of D-strain (mainly E/D) and the unresolved 55Mn hyperfine splitting, but the proper values of these distributions are well determined by the simulations of the other three spectra. The hyperfine term is treated as a perturbation to second order for the energies of the spin states, but we have not fully considered the corrections to the wave functions. We remain open to this possibility even though the broadening appears to be most problematic at higher magnetic fields, where second order corrections should be less important.
Electronic Excited State Energies
The d-orbitals of [MnIIH3buea(OH)]2− are singly occupied giving a ground orbital singlet with S = 5/2. The excited electronic state corresponding to the S = 3/2 configuration contributes via spin-orbit coupling to the zero-field energies of the ground S = 5/2 state. The experimental D-value of the isoelectronic Fe – OH complex (−2.4 cm−1 ) is an order of magnitude greater than the MnII complex (−0.28 cm−1 ). From DFT calculations, the SCF energy for a vertical excitation to the S = 3/2 state for the MnII –OH and FeIII –OH complexes were 1.76 and 0.8 eV, respectively. TD-DFT calculations to determine the other higher lying excited S = 3/2 and S = 1/2 states were not performed. The magnitude of the D-value is in part dependent on the energies of the excited electronic states, and the smaller vertical SCF energy for the FeIII –OH complex is consistent with the larger magnitude of D-value as compared to the MnII complex. However, a delicate balance of other contributions is present for d5 systems that can raise or lower the D-value, making accurate theoretical calculations difficult. 30,31
Mn–OH Complex
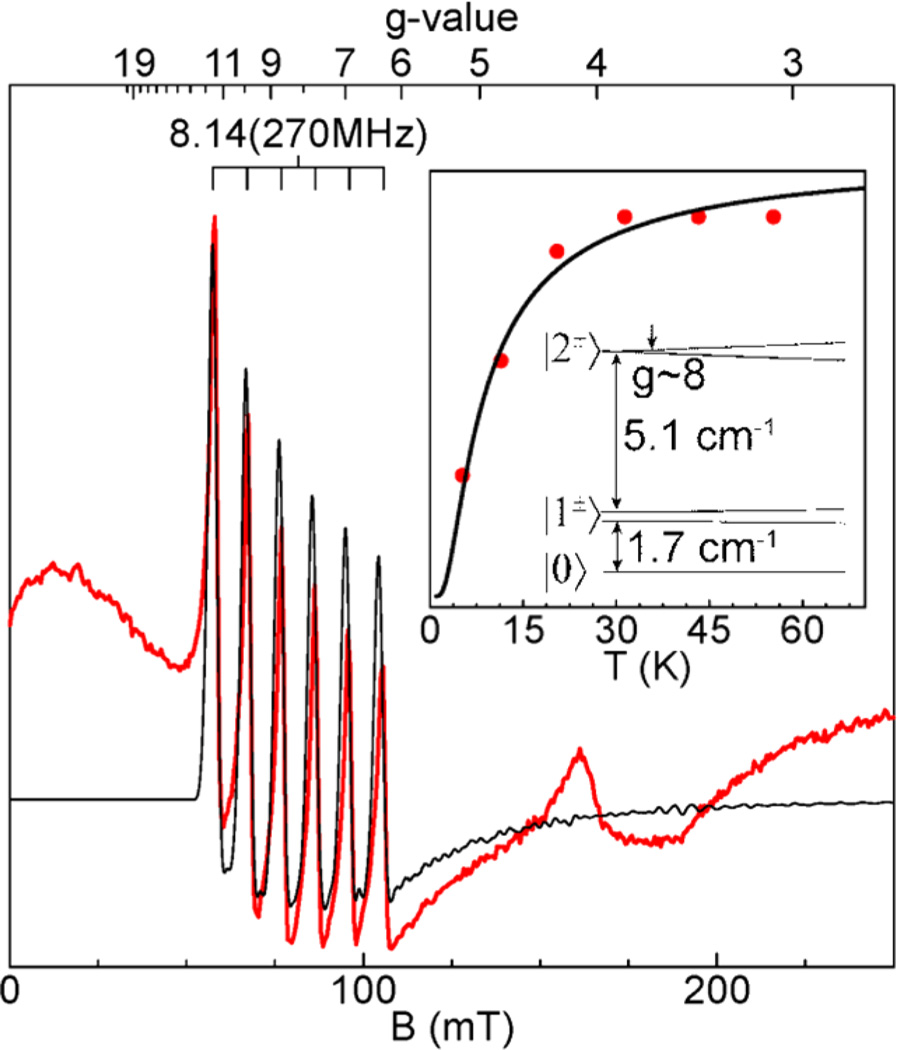
Figure 6 shows a higher resolution EPR spectrum of [MnIIIH3buea(OH)]− and a simulation using the parameters given in Table 1. The complex showed a six-line hyperfine pattern at g = 8.14 in parallel mode that originated from a transition within the |2±〉 levels of an S = 2 spin manifold, where |2±〉 = (|+2〉 ± |−2〉)/√2 for an integer-spin system with axial symmetry. The temperature dependence (Figure 6, inset) of this signal indicated D = +1.7(5) cm−1. The resonance condition for this doublet is (hv)2 = Δ22 + [4gZβB cos θ]2, where θ is the angle between the molecular z-axis defined by the D-tensor and B, and the zero-field splitting of the doublet is Δ2 = 3(E/D)2D32. The concentration of a species determined from the spectrum depends on the value of Δ2 and the g-value. To accurately determine both Δ2 and the g-value, data from at least two microwave frequencies is required. This was applied successively to the FeIV–oxo complex of the same ligand where both X- and Q-band spectra were observed.15 We could not detect a signal in the Q-band EPR spectrum of the MnIII–OH complex, because the small value of Δ2 corresponds to a signal intensity below the sensitivity of our spectrometer. However, this limits the range of the g-value value to within the literature range of g-values of MnIII ions (1.95 < g < 2.04).19,33–37 For this range, the species concentration determined from the EPR spectrum was in agreement with the concentration of the MnII complex (10 mM) prior to oxidation. The broad underlying negative feature in the experimental spectrum near g ~ 8 was from a preparation dependent impurity of unknown origin. The signal at g = 4 was from small amount of O2 in the sample.
Figure 6.
Parallel mode EPR spectrum of MnIII–OH in DMF/THF. (Inset) signal intensity times temperature versus temperature of g = 8.14 signal (dots) and a theoretical curve (line) for the |2±〉 transition of an S = 2 spin manifold with D = +1.7(5) cm−1. Experimental condition: temperature, 10 K; power, 20 mW; frequency, 9.298 GHz.
Excited State Energies and D-Value
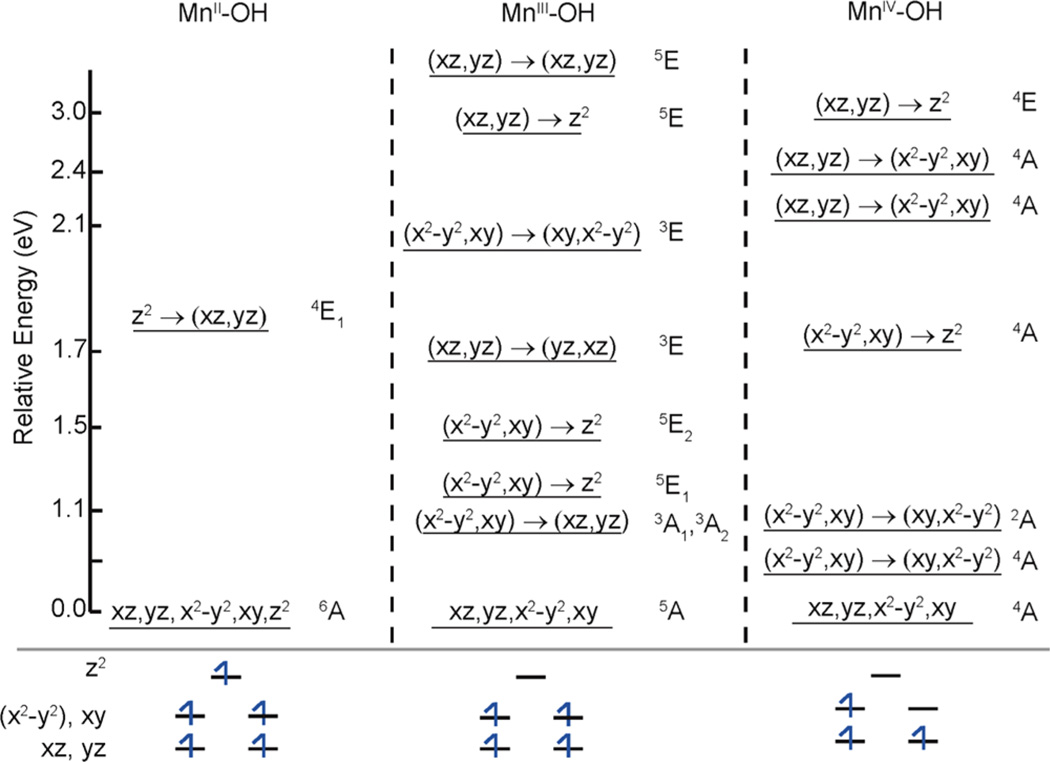
TD-DFT calculations were performed to give a theoretical estimate of the zero-field splitting of the MnIII–OH complex. As shown in Figure 7, the lowest eight excited electronic configurations having S = 2 are a set of two degenerate pairs near 1.3 eV and another set of two degenerate pairs near 3 eV above the ground S = 2 state. These excited configurations correspond to the promotion of an electron from the dx2−y2, xy (1.3 eV) and dxz, yz (3 eV) orbitals to the unoccupied dz2 orbital. The 5E configurations near 1.3 eV do not contribute to the D-tensor because the matrix elements of the angular momentum operator (L) between dz2 and dx2−y2, xy vanish. For the 5E configurations near 3 eV, the matrix elements of L for dz2 and dxz, yz are nonzero and these configurations contributed to the D-tensor. The UV–vis spectra of the complex will be published elsewhere. Two prominent bands are observed with peaks at 1.7 and 2.9 eV, which are reasonably close to the TD-DFT calculated energies for the transitions dx2−y2, xy → dz2 and dxy, xz → dz2, respectively.
Figure 7.
Relative energies of the excited states from TD-DFT calculations for the MnII, MnIII, and MnIV trigonal complexes reported here. The orbitals connected by horizontal arrows indicate the d–d electronic transition with respect to the ground state configuration. The bottom panel shows the electronic configuration of the ground state.
The triplet-spin excited states may also contribute to the D-tensor. The lowest triplet configuration, calculated by computing the SCF energy for a vertical excitation from the ground state, is approximately 1.1 eV higher in energy than the quintet state. TD-DFT calculations revealed three more triplet states near this energy. The spin-orbit contributions to the D-value of a quintet state from the S = 1 (D1) and the S = 2 (D2) excited configurations using second-order perturbation theory are15
| (2) |
where ζ is the single electron spin–orbit coupling constant and has a value of ≈350 cm−1,38 γ are covalency factors, and Δi is the energy gap corresponding to the electronic transition denoted by the subscript. The covalent interactions in the metal–ligand bonds can give values of γi less than 1. A simplistic analysis allowed an estimate of the covalency due to delocalization of a d-electron onto a single ligand p-orbital.39 The covalency factors from the Mulliken populations are given in Table S1 (Supporting Information). Using the excitation energies calculated from TD-DFT and the covalency factors in eq 2 gave D-value contributions: D2 = +0.5 cm−1 and D1 = +3.5 cm−1 and a total value of D = D1 + D2 = +4.0 cm−1.
Compared to the isoelectronic FeIV–O complex, [FeIVH3buea(O)]−, in which the calculated and the experimentally determined D-values were in excellent agreement,15 the theoretical value (+4.0 cm−1) for the MnIII complex was significantly greater than the experimentally determined D-value (+1.7 cm−1). A plausible explanation comes from the Mulliken spin density of the d-orbitals for the MnIII ion. Covalency of the metal–ligand bonds would delocalize the ligand spin density onto the metal orbitals to give Mulliken spin populations that are greater than 1 for the formally singly occupied metal orbitals. However, the Mulliken populations of the dx2−y2 and dyz orbitals determined from DFT are less than 1 (Table S1, Supporting Information), suggesting that these orbitals are mixed with the empty dz2 orbital and thus invalidating the simplistic analysis of the covalency factors.
The isoelectronic FeIV–O and MnIII–O complexes of the same ligand exhibit positive D values.15,26 For d4 metal ions in approximate axial C3 symmetry, the molecular orbital configuration causes the magnitude of the negative components of the D-tensor to be smaller than the positive component, implying such symmetry will exhibit D > 0.
MnIV–OH Complex
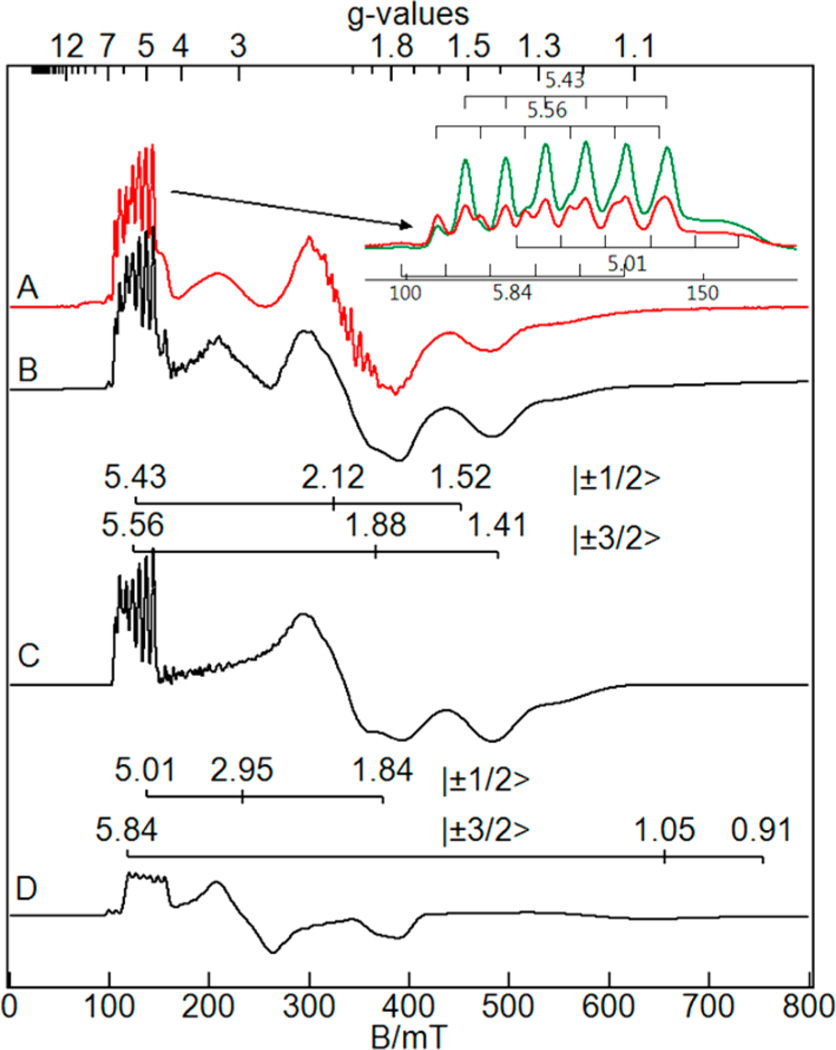
The perpendicular mode EPR spectrum of [MnIVH3buea(OH)] is shown in Figure 8A for a sample with less of the binuclear mixed-valence Mn impurity than the series of Figure 2. The complex showed signals near g = 5, 2, and 1.5, which were in the range expected for an S = 3/2 spin manifold. The spectra recorded at 2 and 10 K show signals from the ground |±1/2〉 and excited |±3/2〉 doublets. The spectra at these two temperatures indicate the presence of two S = 3/2 species, as it is impossible to simulate all the features with a single S = 3/2 species. The spectra consistently showed a ratio of species concentrations S1:S2 equal to 70:30 for multiple synthetic preparations and multiple solvents in DMF, DMF/THF (1:1), DMF/THF (1:2), and possibly for DMA/ THF, but the spectra are much broader. Figure 8B shows simulation of the spectrum of the MnIV–OH complex with two distinct species, using the parameters given in Table 1. The two species have similar D-values and A-tensors, but species S2 was significantly more axial (E/D = 0.17) in comparison to species S1 (E/D = 0.31). Figure 8C,D shows the individual simulations and g-values for each species. As shown in the inset of Figure 8, both species showed hyperfine splitting in the low field region from the ground and excited doublets. The six-line patterns centered at g = 5.43 (A = 190 MHz〉 and 5.56 (A = 210 MHz) are from the |±1/2〉 and |±3/2〉 doublets of species S1, respectively, with hyperfine constants in parentheses. The signals at g = 5.01 (A = 210 MHz) and 5.84 (A = 210 MHz) are from the |±1/2〉 and |±3/2〉 doublets of species S2, respectively. The relative intensities of signals allowed an accurate determination of the D-values for both complexes. The observed speciation is solvent independent suggesting an equilibrium of two conformations of the complex. The large change is symmetry for the two conformations suggests a change in the primary coordination sphere of the metal, such as the orientation of the hydroxide bond relative to the equatorial Mn–N bonds.
Figure 8.
(A) 5 mM MnIV–OH in DMF/THF, (B) simulation sum of the contributions of species S1 (C) and species S2 (D). The g-values of the corresponding |±ms〉 transitions of the S = 3/2 manifold are shown for the two species. Inset: The low field region at 2 K (green) and 10 K (red). Experimental condition: temperature 10 K, power 0.2 mW, frequency 9.630 GHz.
TD-DFT calculations were performed on the MnIV–OH complex to determine the energies of the excited electronic states. The SCF energy for the vertical transition to the S = 1/2 state was 0.7 eV. The positive vertical SCF energy was consistent with the S = 3/2 ground state configuration for the optimized geometry. There are six electron excited states with S = 3/2 configuration within 3 eV of the ground state (Figure 7). The first excited state is 0.5 eV higher than the ground state, corresponding to promotion of an electron in the occupied equatorial orbital (dx2−y2, xy) to the unoccupied equatorial orbital (dx2−y2, xy). This transition represents the stabilization in the energy induced by Jahn–Teller distortion between the otherwise degenerate equatorial orbitals. The distortion results in significant mixing between the axial and the equatorial orbitals. The orbital mixing causes off-diagonal terms in the D-tensor, consequently, no simple derivation of the D-value from perturbation theory is available. The UV–vis spectra of the complex will be published elsewhere. A broad absorbance is observed between 1.6 and 3.2 eV with a peak at 2.7 eV. The energy of this broad absorbance agrees with the TD-DFT energies of transitions from the ground configuration to the multiple S = 3/2 configurations above 1.7 eV shown in Figure 7.
Symmetry of the Mnn–OH complexes
Relative to the Mn-oxo complexes of [H3buea]3−, the Mn–OH complexes are significantly more rhombic (less axial).15 Two possible interactions that can lower symmetry are (1) the differential interaction of the lone pairs on the hydroxo ligand with the metal d-orbitals and (2) the distortion of the urea arms caused by steric interaction from the hydroxo ligand. The distortion of a urea arm is observed in all DFT calculated structures and crystal structures of the Mn–OH complexes, whereas the Mn– oxo complexes show no distortion of the urea arms, and the EPR spectroscopy of these complexes also indicate near axial symmetry.14,23 MnIII–OH and FeIII–OH complexes of the amide-based ligand tris(N-isopropylcarbamoylmethyl)aminato have also been characterized.40,41 These complexes lack the urea arms, and consequently, no steric interactions with the hydroxo ligand. Nevertheless, both the Fe and Mn complexes of this ligand do not display axial electronic symmetry: FeIII– OH (E/D = 0.1),40 MnIII–OH (E/D ≥ 0.1). These comparisons indicate that the differential interaction of the hydroxo lone pairs with the metal d-orbitals is the dominate cause for the loss of axial symmetry.
The MnII–OH complex are significantly more axial relative to the isoelectronic FeIII–OH complex (E/D = 0.03 and 0.17, respectively).15 Consistent with the charge and ionic size, the bonds of the MnII complex are 0.16 Å longer on average as compared to the FeIII–OH complex (Table S2, Supporting Information). Consequently, the MnII–OH complex more easily accommodates the hydroxide with less interaction of the lone pair of electrons on hydroxide and the metal d-orbitals. Notably, the urea arms are also bent for the MnII–OH complex but the electronic symmetry is near axial, which corroborates the lone pair interaction of the hydroxo ligand as a determinant of symmetry.
55Mn Isotropic Hyperfine Interaction
Table 1 gives the isotropic 55Mn hyperfine constant (Aiso) for various Mn complexes characterized in this report. For the S = 2 MnIII complex, only the component of the A-tensor along the z-coordinate of the molecular frame can be determined experimentally. DFT calculations have been shown to accurately predict the dipolar component but underestimate the Fermi contact term of the A-tensor.42 Therefore, the Aiso value for this complex is calculated using the expression Aiso = Az – Adip.z, where Az (±270 MHz) is the experimentally observed hyperfine splitting, and Adip.z (−58 MHz) is the theoretical dipolar contribution to the A-tensor from DFT calculation. The sign of A-tensor cannot be determined from EPR spectroscopy, giving possible values of Aiso = −212 or +328 MHz. The value of Fermi contact term for 55Mn nucleus is negative,20,43 ruling out the positive value. The Aiso value for the series of MnII,III,IV–hydroxo complexes are 250, 212, 219 (S1), or 224 (S2) MHz, respectively. In comparison with literature values for each respective oxidation state, the present values are within the observed ranges of isotropic hyperfine constants for Mn.20,34,35,44–46
CONCLUSION
Three 5-coordinate Mn–OH complexes, [MnIIH3buea-(OH)]2−, [MnIIIH3buea(OH)]−, and [MnIVH3buea(OH)] were characterized with EPR spectroscopy to give spin, g-values, zero-field, and hyperfine parameters for all complexes. These complexes with localized C3 symmetry are high-spin, giving detectable EPR signals in perpendicular and parallel mode at X-band and/or Q-band microwave frequencies. These complexes demonstrate the ability to quantitatively interpret relatively complicated EPR spectra from multiple different oxidation states of the same ligand. Sequential oxidation of [MnIIH3buea(OH)]2− showed nearly quantitative conversion to [MnIIIH3buea(OH)]− and to [MnIVH3buea(OH)]. DFT calculations provided an explanation for the relatively high symmetry of the MnII and MnIII complexes. The large rhombicity found for the MnIV complex is caused by Jahn– Teller distortions expected for an S = 3/2 spin system in trigonal symmetry.
Supplementary Material
Acknowledgments
Funding
The authors thank the NIH (GM50781 to A.S.B.; GM77387 to M.P.H.).
Footnotes
ASSOCIATED CONTENT
Supporting Information
Table of covalency factors, table of selected metal–ligand bond distance from DFT calculations, and X-band EPR spectra and simulations of the MnII–OH complex. This material is available free of charge via the Internet at http://pubs.acs.org.
The authors declare no competing financial interest.
REFERENCES
- 1.Shook RL, Borovik AS. Inorg. Chem. 2010;49:3646. doi: 10.1021/ic901550k. [DOI] [PMC free article] [PubMed] [Google Scholar]
- 2.Solomon EI, Brunold TC, Davis MI, Kemsley JN, Lee S-K, Lehnert N, Neese F, Skulan AJ, Yang Y-S, Zhou J. Chem. Rev. (Washington, DC, U. S.) 2000;100:235. doi: 10.1021/cr9900275. [DOI] [PubMed] [Google Scholar]
- 3.Solomon EI, Wong SD, Liu LV, Decker A, Chow MS. Curr. Opin. Chem. Biol. 2009;13:99. doi: 10.1016/j.cbpa.2009.02.011. [DOI] [PMC free article] [PubMed] [Google Scholar]
- 4.Stone KL, Borovik AS. Curr. Opin. Chem. Biol. 2009;13:114. doi: 10.1016/j.cbpa.2009.02.008. [DOI] [PMC free article] [PubMed] [Google Scholar]
- 5.Borovik AS. Chem. Soc. Rev. 2011;40:1870. doi: 10.1039/c0cs00165a. [DOI] [PMC free article] [PubMed] [Google Scholar]
- 6.Cady CW, Crabtree RH, Brudvig GW. Coord. Chem. Rev. 2008;252:444. doi: 10.1016/j.ccr.2007.06.002. [DOI] [PMC free article] [PubMed] [Google Scholar]
- 7.McEvoy JP, Brudvig GW. Chem. Rev. 2006;106:4455. doi: 10.1021/cr0204294. [DOI] [PubMed] [Google Scholar]
- 8.Hersleth HP, Ryde U, Rydberg P, Gorbitz CH, Andersson KKJ. Inorg. Biochem. 2006;100:460. doi: 10.1016/j.jinorgbio.2006.01.018. [DOI] [PubMed] [Google Scholar]
- 9.Behan RK, Green MTJ. Inorg. Biochem. 2006;100:448. doi: 10.1016/j.jinorgbio.2005.12.019. [DOI] [PubMed] [Google Scholar]
- 10.Andersson LA, Dawson JH. Struct. Bonding (Berlin, Ger.) 1990;64:1. [Google Scholar]
- 11.Chance B, Powers L, Ching Y, Poulos T, Schonbaum GR, Yamazaki I, Paul KG. Arch. Biochem. Biophys. 1984;235:596. doi: 10.1016/0003-9861(84)90234-0. [DOI] [PubMed] [Google Scholar]
- 12.Penner-Hahn JE, Smith Eble K, McMurry TJ, Renner M, Balch AL, Groves JT, Dawson JH, Hodgson KOJ. Am. Chem. Soc. 1986;108:7819. doi: 10.1021/ja00284a054. [DOI] [PubMed] [Google Scholar]
- 13.Chang CS, Yamazaki I, Sinclair R, Khalid S, Powers L. Biochemistry. 1993;32:923. doi: 10.1021/bi00054a025. [DOI] [PubMed] [Google Scholar]
- 14.MacBeth CE, Gupta R, Mitchell-Koch KR, Young VG, Jr, Lushington GH, Thompson WH, Hendrich MP, Borovik ASJ. Am. Chem. Soc. 2004;126:2556. doi: 10.1021/ja0305151. [DOI] [PubMed] [Google Scholar]
- 15.Gupta R, Lacy DC, Bominaar EL, Borovik AS, Hendrich MPJ. Am. Chem. Soc. 2012;134:9775. doi: 10.1021/ja303224p. [DOI] [PMC free article] [PubMed] [Google Scholar]
- 16.Stich TA, Lahiri S, Yeagle G, Dicus M, Brynda M, Gunn A, Aznar C, Derose VJ, Britt RD. Appl. Magn. Reson. 2007;31:321. doi: 10.1007/BF03166263. [DOI] [PMC free article] [PubMed] [Google Scholar]
- 17.Mantel C, Baffert C, Romero I, Deronzier A, Pecaut J, Collomb MN, Duboc C. Inorg. Chem. 2004;43:6455. doi: 10.1021/ic049650k. [DOI] [PubMed] [Google Scholar]
- 18.Duboc C, Phoeung T, Zein S, Pecaut J, Collomb MN, Neese F. Inorg. Chem. 2007;46:4905. doi: 10.1021/ic062384l. [DOI] [PubMed] [Google Scholar]
- 19.Krzystek J, Telser J, Pardi LA, Goldberg DP, Hoffman BM, Brunel L-C. Inorg. Chem. 1999;38:6121. doi: 10.1021/ic9901970. [DOI] [PubMed] [Google Scholar]
- 20.Krivokapic I, Noble C, Klitgaard S, Tregenna-Piggott P, Weihe H, Barra AL. Angew. Chem., Int. Ed. 2005;44:3613. doi: 10.1002/anie.200463084. [DOI] [PubMed] [Google Scholar]
- 21.Golombek AP, Hendrich MPJ. Magn. Reson. 2003;165:33. doi: 10.1016/j.jmr.2003.07.001. [DOI] [PubMed] [Google Scholar]
- 22.Connelly NG, Geiger WE. Chem. Rev. 1996;96:877. doi: 10.1021/cr940053x. [DOI] [PubMed] [Google Scholar]
- 23.Gupta R, MacBeth CE, Young VG, Jr, Borovik ASJ. Am. Chem. Soc. 2002;124:1136. doi: 10.1021/ja016741x. [DOI] [PubMed] [Google Scholar]
- 24.Petasis DT, Hendrich MPJ. Magn. Reson. 1999;136:200. doi: 10.1006/jmre.1998.1657. [DOI] [PubMed] [Google Scholar]
- 25.Frisch MJ, et al. Gaussian 03. Wallingford, CT: Gaussian Inc; 2004. Revision E.01. [Google Scholar]
- 26.Taguchi T, Gupta R, Lassalle-Kaiser B, Boyce DW, Yachandra VK, Tolman WB, Yano J, Hendrich MP, Borovik ASJ. Am. Chem. Soc. 2012;134:1996. doi: 10.1021/ja210957u. [DOI] [PMC free article] [PubMed] [Google Scholar]
- 27.MacBeth CE, Golombek AP, Young VG, Jr, Yang C, Kuczera K, Hendrich MP, Borovik AS. Science. 2000;289:938. doi: 10.1126/science.289.5481.938. [DOI] [PubMed] [Google Scholar]
- 28.Palmer G. Phys. Methods Bioinorg. Chem. 2000:121. [Google Scholar]
- 29.Duboc C, Collomb M-N, Neese F. Appl. Magn. Reson. 2010;37:229. [Google Scholar]
- 30.Neese F, Solomon EI. Inorg. Chem. 1998;37:6568. doi: 10.1021/ic980948i. [DOI] [PubMed] [Google Scholar]
- 31.Tzima TD, Sioros G, Duboc C, Kovala-Demertzi D, Melissas VS, Sanakis Y. Polyhedron. 2009;28:3257. [Google Scholar]
- 32.Hendrich MP, Debrunner PG. Biophys. J. 1989;56:489. doi: 10.1016/S0006-3495(89)82696-7. [DOI] [PMC free article] [PubMed] [Google Scholar]
- 33.Zheng M, Khangulov SV, Dismukes GC, Barynin VV. Inorg. Chem. 1994;33:382. [Google Scholar]
- 34.Peloquin JM, Campbell KA, Randall DW, Evanchik MA, Pecoraro VL, Armstrong WH, Britt RDJ. Am. Chem. Soc. 2000;122:10926. [Google Scholar]
- 35.Campbell KA, Yikilmaz E, Grant CV, Gregor W, Miller A-F, Britt RDJ. Am. Chem. Soc. 1999;121:4714. [Google Scholar]
- 36.Pierce BS, Elgren TE, Hendrich MPJ. Am. Chem. Soc. 2003;125:8748. doi: 10.1021/ja021290h. [DOI] [PubMed] [Google Scholar]
- 37.Teutloff C, Schafer KO, Sinnecker S, Barynin V, Bittl R, Wieghardt K, Lendzian F, Lubitz W. Magn. Reson. Chem. 2005;43(Spec No):S51. doi: 10.1002/mrc.1685. [DOI] [PubMed] [Google Scholar]
- 38.Bendix J, Brorson M, Schaffer CE. Inorg. Chem. 1993;32:2838. [Google Scholar]
- 39.Chanda A, Shan X, Chakrabarti M, Ellis W, Popescu D, Tiago de Oliveria F, Wang D, Que L, Jr, Collins TJ, Munck E, Bominaar EL. Inorg. Chem. 2008;47:3669. doi: 10.1021/ic7022902. [DOI] [PMC free article] [PubMed] [Google Scholar]
- 40.Mukherjee J, Lucas RL, Zart MK, Powell DR, Day VW, Borovik AS. Inorg. Chem. 2008;47:5780. doi: 10.1021/ic800048e. [DOI] [PMC free article] [PubMed] [Google Scholar]
- 41.Shirin Z, Young VG, Jr, Borovik AS. Chem. Commun. (Cambridge, U. K.) 1997:1967. [Google Scholar]
- 42.Jensen F. Introduction to computational chemistry. New York: Wiley; 1999. [Google Scholar]
- 43.Gerritsen HJ, Sabisky ES. Phys. Rev. 1963;132:1507. [Google Scholar]
- 44.Zheng M, Dismukes GC. Inorg. Chem. 1996;35:3307. doi: 10.1021/ic9512340. [DOI] [PubMed] [Google Scholar]
- 45.Campbell KA, Force DA, Nixon PJ, Dole F, Diner BA, Britt RDJ. Am. Chem. Soc. 2000;122:3754. [Google Scholar]
- 46.Kessissoglou DP, Li XH, Butler WM, Pecoraro VL. Inorg. Chem. 1987;26:2487. [Google Scholar]
Associated Data
This section collects any data citations, data availability statements, or supplementary materials included in this article.


