

Abstract
Mitochondrial DNA (mtDNA) is essential for proper mitochondrial function and encodes 22 tRNAs, 2 rRNAs and 13 polypeptides that make up subunits of complex I, III, IV, in the electron transport chain and complex V, the ATP synthase. Although mitochondrial dysfunction has been implicated in processes such as premature aging, neurodegeneration, and cancer, it has not been shown whether persistent mtDNA damage causes a loss of oxidative phosphorylation. We addressed this question by treating mouse embryonic fibroblasts with either hydrogen peroxide (H2O2) or the alkylating agent methyl methanesulfonate (MMS) and measuring several endpoints, including mtDNA damage and repair rates using QPCR, levels of mitochondrial- and nuclear-encoded proteins using antibody analysis, and a pharmacologic profile of mitochondria using the Seahorse Extracellular Flux Analyzer. We show that a 60 min treatment with H2O2 causes persistent mtDNA lesions, mtDNA loss, decreased levels of a nuclear-encoded mitochondrial subunit, a loss of ATP-linked oxidative phosphorylation and a loss of total reserve capacity. Conversely, a 60 min treatment with 2 mM MMS causes persistent mtDNA lesions but no mtDNA loss, no decrease in levels of a nuclear-encoded mitochondrial subunit, and no mitochondrial dysfunction. These results suggest that persistent mtDNA damage is not sufficient to cause mitochondrial dysfunction.
Keywords: Mitochondria, Methyl methane sulfonate, Hydrogen peroxide, Mitochondrial DNA repair, mtDNA
1. Introduction
Mitochondrial DNA has been shown to be susceptible to damage by a wide variety of agents including oxidants [1-6] and alkylating agents [7-11]. While mitochondria lack some repair pathways they have robust base excision repair of base damage resulting from alkylating or oxidizing agents [1,5]. Furthermore, mitochondria are the major source of endogenous ROS and produce as much as 90% of the cellular ROS during oxidative phosphorylation (reviewed in [12]). In this regard oxidative stress and mitochondrial dysfunction are implicated in premature aging [13,14], retinal degeneration [15], neurodegenerative diseases such as Alzheimer’s and Parkinson’s disease [16,17], and various cancers [18-20] (also reviewed in [21]).
One commonly used oxidant, hydrogen peroxide (H2O2) is freely diffusible within the cell and causes a wide range of effects based on concentration and cell type, including an increase in mtDNA damage compared to nDNA damage (nuclear DNA) [3,4,6,22,23], mtDNA degradation [10], increased mitochondrial mass [24], cell growth arrest [3,25-29], apoptosis [6,29-31], autophagy [31], increased secondary ROS such as H2O2 and superoxide [32], and decreased antioxidant activity [33,34]. However, the only study linking oxidative stress to a decrease in mitochondrial function is a 2001 study by Szweda and Nulton-Persson, which suggested that H2O2 treatment of isolated rat heart mitochondria caused a reversible decline in oxidative phosphorylation [34]. A systematic study linking H2O2-induced mtDNA damage with subsequent mitochondrial functional decline has not been performed to date.
With regard to alkylating agents, diethylnitrosamine (DEN), dimethylnitrosamine (DMN), and N-methyl-N-nitrosourea (MNU) have all been shown to cause significant mtDNA damage [7-11]. A study in 1970 by Wunderlich et al. used 14C-labeled MNU to show that mtDNA is preferentially targeted by alkylators [7]. In addition, the authors of a 1985 study with DEN and DEM gave mice a single dose of 14C-labeled DEN and DMN, and DNA isolated from the mitochondria of mouse tissues showed a 10–90-fold enrichment of 14C compared to nDNA, and they concluded that mtDNA was preferentially targeted [11]. These studies may be incomplete because the authors did not account for the DNA repair that may have occurred before the harvesting of the tissues. It was not until 1988 that mtDNA repair of alkylating lesions was addressed in a study by Myers and colleagues in which the authors found that (1) O6-MeG lesions were present at higher levels in mtDNA than in nDNA and were repaired in mtDNA at similar rates to nDNA, and yet (2) butyl adducts on mtDNA were repaired very slowly [8]. In a 1991 study, Pettepher and coworkers showed that in mammalian mtDNA, the alkali-labile sites produced by the alkylating agent streptozotocin were 55% repaired by 8 h following treatment, and 70% repaired by 24 h following treatment [9]. A 2009 study by Shokolenko and coworkers in HeLa cells demonstrated that mtDNA damage generated during a short treatment (30 min) with MMS (1 mM) and MMS (2 mM) is 86% and 50% repaired by 6 h, respectively following treatment [10]. However, the effect of this damage on mitochondrial function was not addressed in this study and the relationship between mtDNA damage and subsequent declines in mitochondrial function represents an important knowledge gap.
This present study seeks to elucidate the effects of the oxidant H2O2 and the alkylating agent MMS on mtDNA and mitochondrial function. We have used two novel approaches involving quantitative PCR [35] to measure both mtDNA copy number and levels of DNA damage and the Seahorse flux analyzer to measure oxidative phosphorylation and glycolysis in cells treated with H2O2 or MMS [36]. The later approach uses real-time measurements and pharmacological inhibitors to understand mitochondrial function in live cells [37,38].
2. Materials and methods
2.1. Cells and cell culture
The simian virus 40 (SV40)-transformed mouse embryonic fibroblast cell line, 92TAg, a gift from Dr. Robert Sobol Jr., was maintained at 37 °C and 5% CO2 incubator in Dulbecco’s Modified Eagle Medium (Gibco), 10% FBS, 1% Penicillin/Streptomycin, 2% Glutamax (Gibco). The cells were routinely split 2 times a week to a cell density of 1−2 × 10⁴ cells/mL.
2.2. Treatment of cells with H2O2 or MMS
92TAg MEFs were plated at a density of 6 × 10⁵ cells in duplicate 60 mm dishes for each treatment type the evening before treatment. H2O2 (30%, Sigma) was first diluted into serum-free media to a concentration of 0.1 M, and then further diluted in serum-free media to the treatment concentration (50–400 μM). MMS (99%, Sigma) was diluted directly into serum-free media to the treatment concentration (1–3 mM). The original plating media was saved before the drug-containing media was added to the plates, and this conditioned media was put back on the plates after treatment for harvest times of 1 h, 4 h, and 8 h. For H2O2, 6.25 mL of serum-free media ± H2O2 was added to each plate, and then cells were incubated in the media for 15 or 60 min at 37 °C. For MMS, 6.25 mL of serum-free media ± MMS was added to each plate, and then cells were incubated in the media for 60 min at 37 °C. To determine DNA damage and repair in a time-course, cells were harvested at 0 h (immediately following treatment), 1 h, 4 h and 8 h. At the time of harvest, cells were washed once with PBS, trypsinized, and then pelleted at 1500 rpm. The supernatant was removed and the pellets were moved to −80 °C. Viability was examined with electric current exclusion after 48 h [39,40], with 93% viability in cells treated for 60 min with 200 μM H2O2, and 77% viability in cells treated for 60 min with 2 mM MMS. Visual inspection of H2O2- and MMS-treated cells at 24 and 48 h after treatment indicated reduced growth rate compared to control. At 48 h after treatment, H2O2-treated cells looked healthier than MMS-treated cells.
2.3. DNA isolation and quantitative PCR (QPCR)
High molecular weight DNA was isolated with the automated QIAcube accompanied by the DNeasy Blood & Tissue kit (Qiagen, Chatsworth, CA) as described by the manufacturer. The concentration of total cellular DNA was determined by PicoGreen fluorescence (Invitrogen, Carlsbad, CA) and was read using a BioTek Synergy 2 plate reader (BioTek, Winooski, VT) with an excitation filter at 485 nm and an emission filter at 528 nm using λ/HindIII DNA as a standard. When using QIAcube-extracted DNA with mitochondrial primer sets, we found that the DNA of control-treated samples would not amplify the small mitochondrial primer set as well as treated samples. This decrease in amplification was proposed to be due to the supercoiling of undamaged DNA, which would restrict primer access. DNA was thus digested with HaeII restriction enzyme for 1 h at 37 °C in a 50 μL digest mix containing 225 ng DNA, 1X BSA, and 20 units of HaeII enzyme. After the digest, PicoGreen was used to quantitate the DNA and then 15 ng DNA for the QPCR assay was removed directly from the restriction digest mix. QPCRs were performed in a Biometra Professional standard thermocycler 96 (Biometra, Göttingen, Germany) with the GeneAmp XL PCR kit (Applied Biosystems, Foster City, CA) as previously described [35]. Reaction mixtures contained 15 ng of template DNA, 1.2 mM Mg(AOc)2 for use with the large mito and β-polymerase primers and 1.1 mM Mg(AOc)2 for use with the small mito primers, 100 ng/μL BSA (Roche, Basel, Switzerland), 0.2 mM deoxynucleotide trisophates (Applied Biosystems, Foster City, CA), 20 pM primers and 1 unit of rTth DNA polymerase XL (Applied Biosystems, Foster City, CA). The primer nucleotide sequences were as follows: for the 6.6-kb fragment of the β-polymerase gene (GenBank database accession number AA79582), 5′-TATCTCTCTTCCTCTTCACTTCTCCCCTGG-3′ and 5′-CGTGATGCCGCCGTTGAGGGTCTCCTG-3′; for the 10-kb fragment of the mouse mitochondrial genome, 5′-GCCAGCCTGACCCATAGCCATAATAT-3′ and 5′-GAGAGATTTTATGGGTGTAATGCGG-3′, and for the 117-bp fragment of the mouse mitochondrial genome, 5′-CCCAGCTACTACCATCATTCAAGT-3′ and 5′-GATGGTTTGGGAGATTGGTTGATGT-3′. For the 6.6-kb and 10-kb fragments, PCR was initiated with a 75 °C hot start addition of the polymerase. For the 117-bp fragment, polymerase was added before the tubes were placed in the thermocycler. The samples underwent thermocycler parameters as described [35]. To ensure quantitative conditions within the linear range of fragment amplification, a 50% control containing 7.5 ng of template DNA was included with each sample set. To ensure a lack of contamination in the PCR reaction components, a ‘no template’ control was included with each sample set, and contained a volume of 1X TE equal to the volume of DNA samples in the other reactions. PCR products were quantified using PicoGreen fluorescence (Invitrogen, Carlsbad, CA) and a plate reader. The fluorescence of the ‘no template’ control was subtracted from the average fluorescence of triplicate reads for each PCR reaction. PCR products were run on a 0.8% agarose gel (for large mito and β-pol fragments) or a 1.8% agarose gel (for small mito fragments) to ensure correct size of the PCR product and the absence of product in the ‘no template’ lane. Relative mitochondrial DNA copy number was calculated after subtracting the ‘no template’ fluorescence from the fluorescence values of the samples and comparing this fluorescent value to the average fluorescence – no template value of all the samples. The resultant ratio indicates the relative mtDNA copy number of each sample compared to each other. DNA lesion frequencies were calculated as described [35]. Briefly, after subtracting the ‘no template’ fluorescence from the fluorescence values of the control and treated samples, the fluorescence values of treated samples (FT) were divided by the fluorescence values of control samples (FC). The resulting ratio is the relative amplification of damaged to control samples. If lesions are assumed to be randomly distributed, then nondamaged templates can be set as the zero class in the Poisson equation and can be used to calculate the lesion frequency per DNA strand of treated samples: λ = −ln FT/FC. One-way analysis of variance (ANOVA) was utilized for statistical analysis, with p values corresponding to <0.05 (*) as significant.
2.4. Measurement of mitochondrial function
OCR (oxygen consumption rate) and ECAR (extracellular acidification rate) measurements were made with a Seahorse XF24-3 Extracellular Flux Analyzer (Seahorse Bioscience, Billerica, MA). The Seahorse Bioscience XF24 Extracellular Flux Analyzer measures oxidative phosphorylation (OXPHOS) and glycolysis in real time. The apparatus contains two fluorophores, one sensitive to changes in pH and the other sensitive to changes in oxygen concentration. The pH-sensitive fluorophore measures the extracellular acidification rate (ECAR), which is proportional to the rate of lactate production by glycolysis. The oxygen-sensitive fluorophore measures the oxygen consumption rate (OCR), which enables it to accurately measure the rate at which cytochrome c oxidase (complex IV) reduces one O2 molecule to two H2O molecules during OXPHOS. Cells were seeded in 24-well Seahorse tissue culture microplates in growth media at a density of 4 × 10⁴ cells per well and incubated overnight at 37 °C. Before running the Seahorse assay, cells were incubated for 1 h without CO2 in unbuffered DMEM. OCR and ECAR were measured to establish a baseline. Additional automated measurements were performed after the injection of four compounds affecting bioenergetic capacity: oligomycin (1 μM) at injection port A, FCCP (300 nM) at injection port B, 2-DG (100 mM) at injection port C, and rotenone (1 μM) at injection port D. Experiments were performed by simultaneously measuring OCR and ECAR rates in real time by averaging rate data for 4–6 replicate wells of each drug treatment. Data was reported in pmol/min for OCR and mpH/min for ECAR. After the completion of the experiment, cells were immediately trypsinized and counted with the CASY Cell Counter (Innovatis, Bielefeld, Germany) to normalize individual well rate data to cell counts. ANOVA analysis was used to compare mitochondrial function of control and drug-treated wells.
2.5. Western blot analysis
92TAg MEFs were exposed to 200 μM H2O2 for either 15 or 60 min or 2 mM MMS for 60 min and were allowed to recover in conditioned media for 8 h. Antibodies against ND4 (A-16; Santa Cruz), β-actin (AC-15; Sigma), complex V α subunit (Mitosciences) and porin (Mitosciences) were used. Cell pellets were lysed in 1% NP-40 lysis buffer and protein concentrations were measured using the Bradford assay (BioRad). Equal volumes and concentrations of proteins were loaded on a 4–15% Tris–HCl gel (BioRad) and run at 90 V for 1.5 h. Gels were transferred overnight at 150 mA onto a nitrocellulose membrane (BioRad). Blocking was performed overnight at 4 °C in 20% PBST milk and antibody incubations were performed in 10% PBST milk. Primary antibody incubation was performed overnight at 4 °C with rocking. Secondary antibody incubation was done at room temperature for 30 min on a shaker. Three 5-min washes in PBST were done between primary and secondary antibody incubations and after secondary antibody incubation. Blots were developed using the SuperSignal West Femto Maximum Sensitivity Substrate (Thermo Scientific) onto X-ray film (Thermo Scientific) and were analyzed using ImageJ software. Porin, ND4, and complex V α subunit bands were normalized to β-actin.
2.6. Multiplex analysis
92TAg MEFs were plated and treated with 200 μM H2O2 or 2 mM MMS for 1 h and were harvested 8 h later. The Milliplex® MAP (Millipore, Billerica, MA) Magnetic Bead Panel for OXPHOS complexes I, III, and V (cat #RM0XPSMAG-17K) coupled with the Luminex® XMAP® platform was performed in a 96-well plate as previously described [41]. Samples were analyzed using the Bio-Plex suspension array system (Bio-Rad Laboratories, Hercules, CA).
2.7. Amplex red assay
92TAg MEFs were plated and treated with H2O2 as described in other sections. Amplex Red solutions (1X reaction buffer, HRP stock solution, Amplex Red solution) were prepared as described by the manufacturer. At 5–10 min increments after the H2O2 treatment had commenced, the plate was swirled around and a small sample of media was removed and placed into ice cold 1X reaction buffer. At the end of the treatment, each sample was mixed briefly and pipetted into a 96-well plate, along with the standards for a H2O2 standard curve that had been previously prepared in reaction buffer in H2O2 concentrations ranging from 0 to 20 μM. Amplex Red solution was combined with 1X reaction buffer and HRP stock solution to make a working solution that was then pipetted into the 96-well plate. The plate was then incubated at room temperature for 30 min, protected from light. A plate reader with excitation in the range of 530–560 nM and emission at 590 nM was used to read the resulting fluorescence. The H2O2 concentration of each sample was calculated using the H2O2 standard curve.
3. Results
The goal of this study was to understand the relationship between persistent mtDNA damage and mitochondrial function. To accomplish this goal, we utilized the QPCR assay to quantify DNA damage and mtDNA copy number in H2O2- and MMS-treated samples relative to control mock-treated samples, western blots to measure cellular levels of nuclear and mitochondrially encoded proteins, and the Seahorse Extracellular Flux Analyzer to measure cellular glycolysis and oxidative phosphorylation.
3.1. Hydrogen peroxide and MMS cause persistent mtDNA damage
92TAg MEFs were incubated in H2O2-containing media for 15 min (Fig. 1A) or 60 min (Fig. 1B), with a wide range of H2O2 concentrations employed (50–400 μM for 15 min or 50–200 μM for 60 min). As observed previously, initial mtDNA lesions were dependent on concentration and influenced by the treatment time [3,6]. For example, a 15-min treatment with 100 μM H2O2 initially caused 1.1 lesions/10 kb, which were repaired almost completely by 8 h. In contrast, a 60 min treatment with 100 μM H2O2 initially caused 1.6 lesions/10 kb, which were incompletely repaired, even after 8 h (0.65 lesions/10 kb remaining). These data indicate that persistent mtDNA damage depended more upon the treatment time (15 versus 60 min) than on H2O2 concentration. To further illustrate the differences in mtDNA repair rates between 15- and 60-min treated cells, the number of mtDNA lesions after a 15- or 60- min treatment with 200 μM H2O2 was measured at 0, 1, 4, and 8 h recovery (Supplementary Fig. 1A). While the initial mtDNA lesion frequencies are comparable (Supplementary Fig. 1A), the 60-min treated cells show persistent mtDNA damage and loss of mtDNA at 8 h (Supplementary Fig. 1B). In regards to nDNA damage, amplification of a nuclear DNA fragment near the β-polymerase gene indicated that nDNA damage inflicted by the H2O2 treatment was below the detection range of this assay, ~1 lesion/105 bases (data not shown).
Fig. 1.
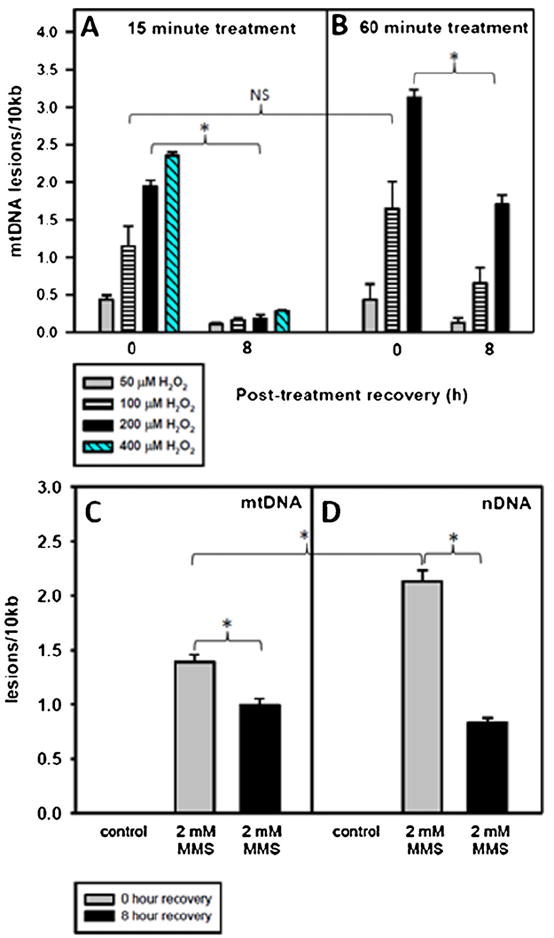
A 60 min treatment with H2O2 or MMS causes persistent mtDNA damage. Cells were plated and the following day were treated for 15 or 60 min with various concentrations of H2O2 or for 60 min with 2 mM MMS in serum-free media. After the treatment, the media was replaced with conditioned media and the cells were allowed to recover for 0 or 8 h. Cells at 0 h recovery were immediately harvested following treatment. mtDNA lesions at 0 and 8 h after a (A) 15-min H2O2 treatment, (B) a 60-min H2O2 treatment or a (C) 60-min MMS treatment. Error bars represent the SEM of n = 4–19, with 2–9 biological experiments and 2–3 replicates per treatment type. H2O2 at 400 μM was not used to treat cells for 60 min. One-sided ANOVA and a Tukey test were used to analyze these data, p < 0.05 (*).
Once persistent mtDNA lesions had been observed in an oxidant model of damage, 92TAg MEFs were treated with the alkylating agent MMS to determine if a non-oxidant model of damage would lead to mtDNA lesions persisting at 8 h. Based on the observation that a 60-min H2O2 was able to cause persistent mtDNA lesions, a 60-min treatment time with MMS was employed. After performing a dose–response experiment with MMS to establish a moderate initial lesion frequency (1–2 lesions/10 kb mtDNA)(Supplementary Fig. 2), 2 mM MMS was used to treat 92TAg MEFs. A 60-min treatment with 2 mM MMS caused 1.5/10 kb initial mtDNA lesions, and by 8 h following treatment, 71% of these lesions persisted (Fig. 1C). Additionally, this same concentration and treatment time of MMS caused 2.1/10 kb nDNA lesions (Fig. 1D). Unlike the mtDNA damage, nDNA damage was more effectively repaired (61% reduction in nDNA lesions) by 8 h recovery. MMS caused both persistent mtDNA and nDNA damage.
3.2. A rapid loss of mtDNA occurs after H2O2 treatment and not after MMS treatment
Treatment with 200 μM H2O2 caused a loss of mtDNA copy number in both 15- and 60-min treated cells (Fig. 2A and B), with the 60-min treated cells showing increased loss of mtDNA as compared to the 15 min-treated cells. A time course was performed at 0, 1, 4, and 8 h recovery to measure the rate of mtDNA loss in cells treated for 15 or 60 min with 200 μM H2O2 (Supplementary Fig. 1B). A 15-min 200 μM H2O2 treatment caused a 29% loss of mtDNA at 8 h as opposed to the 65% loss of mtDNA in the 60-min treated cells. Since the 15 min treatment only caused 29% lower number of lesions, but showed a 2-fold increase in retention of mtDNA as compared to the 60-min treated cells, these data suggest that it is the treatment duration and not mtDNA lesion frequency that affects loss of mtDNA.
Fig. 2.
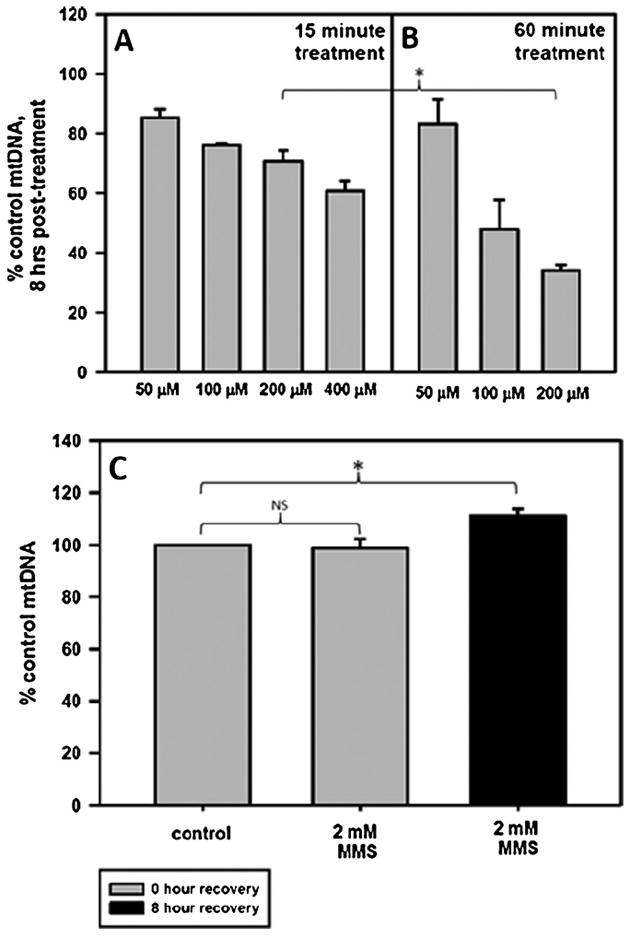
H2O2 and not MMS causes rapid loss of mtDNA. Cells were plated and the following day were treated for 15 or 60 min with various concentrations of H2O2 in serum-free media or for 60 min with 2 mM MMS in serum-free media. After the treatment, the media was replaced with conditioned media and the cells were allowed to recover for 0 or 8 h. Cells at 0 h recovery were immediately harvested following treatment. Fraction of mtDNA copy number remaining at 8 h after a (A) 15-min H2O2 treatment, (B) 60 min H2O2 treatment or a (C) 60-min MMS treatment. Error bars represent the SEM of n = 4–19, with 2–9 biological experiments and 2–3 replicates per treatment type. H2O2 at 400 μM was not used to treat cells for 60 min. One-sided ANOVA and a Tukey test were used to analyze these data, p < 0.05 (*). There is a significant difference in the mtDNA copy number at 8 h when comparing cells treated with 200 μM H2O2 for 15 min to cells treated with 200 μM H2O2 for 60 min.
Although a 60-min treatment with 2 mM MMS caused similar mtDNA lesions to a 60-min treatment with 100 μM H2O2 (1.4 lesions/10 kb and 1.6 lesions/10 kb, respectively), the MMS treatment did not result in any loss of mtDNA at 8 h following treatment (Fig. 2C). In fact, there was a slight increase in the mtDNA copy number at 8 h following MMS treatment. Thus, H2O2 treatment or MMS treatment, despite causing similar lesion frequencies, show striking differences in loss of mtDNA.
3.3. A 60 min treatment with H2O2 and not MMS causes a loss of complex V α subunit
Based on the persistent mtDNA lesions in the 60-min H2O2-treated cells and in the MMS-treated cells, we hypothesized that there would be a decrease in a mitochondrially encoded protein after these treatments. This hypothesis was further supported by the results of a previous study that did not look at individual mitochondrial protein levels but showed decreased mitochondrial protein synthesis in epithelial cells treated with 200 μM H2O2 [22]. For this purpose, we determined the levels of ND4, a mitochondrially encoded subunit of complex I, normalized to the nuclear-encoded β-actin (Fig. 3). We found that at 8 h after a 60-min treatment with 2 MMS or 200 μM H2O2, ND4 levels were not significantly decreased compared to control levels (Fig. 3). Similarly, the 15-min H2O2-treated cells did not show a decrease in ND4 levels at 8 h after treatment.
Fig. 3.
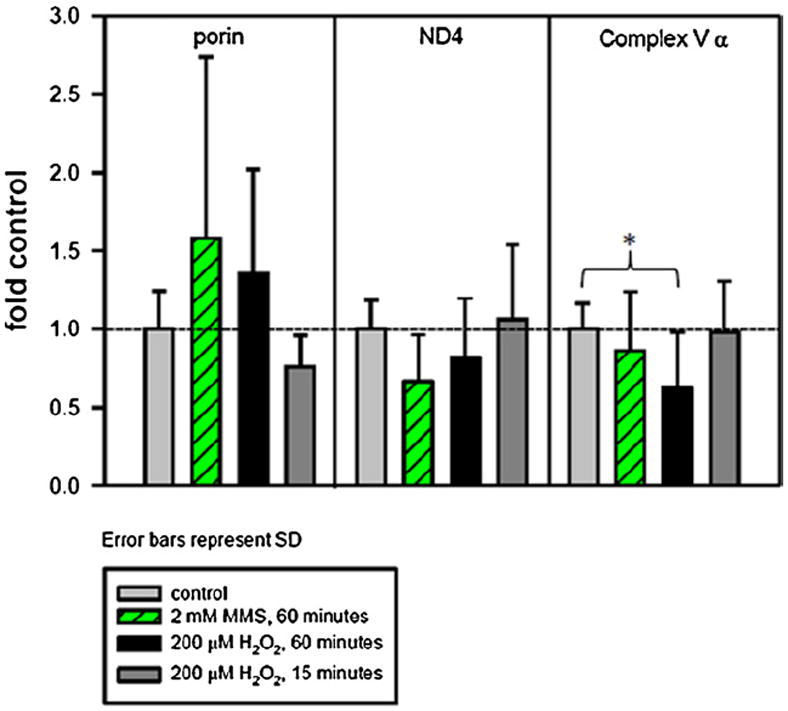
H2O2 and MMS affect mitochondrial protein levels differently. Cells were plated and the following day were treated for 15 or 60 min with 200 μM H2O2 or for 60 min with 2 mM MMS in serum-free media. After the treatment, the media was replaced with conditioned media and the cells were allowed to recover for 8 h. Cells at 8 h recovery were harvested and subjected to western blotting with anti-ND4, anti-complex V α subunit, anti-porin and anti-β-actin. Histogram of ND4 and complex V α subunit levels after H2O2 or MMS treatment, normalized to β-actin (Fig. 3). For H2O2, four individual experiments were performed, with 2–4 separate gels per experiment and 1–3 replicates per treatment type. For MMS, three individual experiments were performed, with 1–2 gels per experiment and 3–6 samples per treatment type. Light gray bar, control; green striped bar, 2 mM MMS for 60 min; black bar, 200 μM H2O2 for 60 min; dark gray bar, 200 μM H2O2 for 15 min. Error bars represent standard deviation. A one-way ANOVA was used to analyze these data, p < 0.05 (*). Complex V α levels in cells treated for 60 min with 200 μM H2O2 are significantly decreased compared to control. (For interpretation of the references to color in this figure legend, the reader is referred to the web version of the article.)
We measured levels of a nuclear-encoded mitochondrial protein, the α subunit of complex V, and observed a significant 37% decrease in the level in cells treated with H2O2 for 60 min, but not in cells treated with MMS for 60 min or in cells treated with H2O2 for 15 min (Fig. 3). Histogram data was acquired from 3 to 6 biological repeats, with 2–6 samples per repeat, and 1–4 westerns performed for each biological repeat. Included in summary figures are representative blots for the H2O2 treatment (Supplementary Fig. 3A) and MMS treatment (Supplementary Fig. 3B).
In addition to measuring levels of ND4 and complex V α, we measured the levels of the outer membrane transporter porin (VDAC-1) and found that the levels of porin were highly variable and thus showed no significant difference from control (Fig. 3).
3.4. Complex I is significantly reduced at 8 h in H2O2-treated cells but not MMS-treated cells
We sought to reiterate the observed decrease in complex V α subunit using western blot analysis with a multiplex assay and different capture antibodies. The Milliplex® MAP multiplex assay utilizes fluorescently labeled magnetic beads to simultaneously assay the levels of complex I, complex III, and complex V in mouse cell lysates.
We predicted that complex V would be decreased in cells treated for 60 min with 200 H2O2 but not in cells treated for 60 min with 2 mM MMS. Fig. 4 shows the levels of complex I, complex III, and complex V compared to control-treated cells. This assay showed no significant differences in complex I, III, or V between MMS-treated cells and control-treated cells. Interestingly, the assay also showed no difference in complex V level between control-treated cells and H2O2-treated cells, which is in contrast to our western blot data. However, the level of complex I was significantly decreased in H2O2-treated cells compared to control.
Fig. 4.
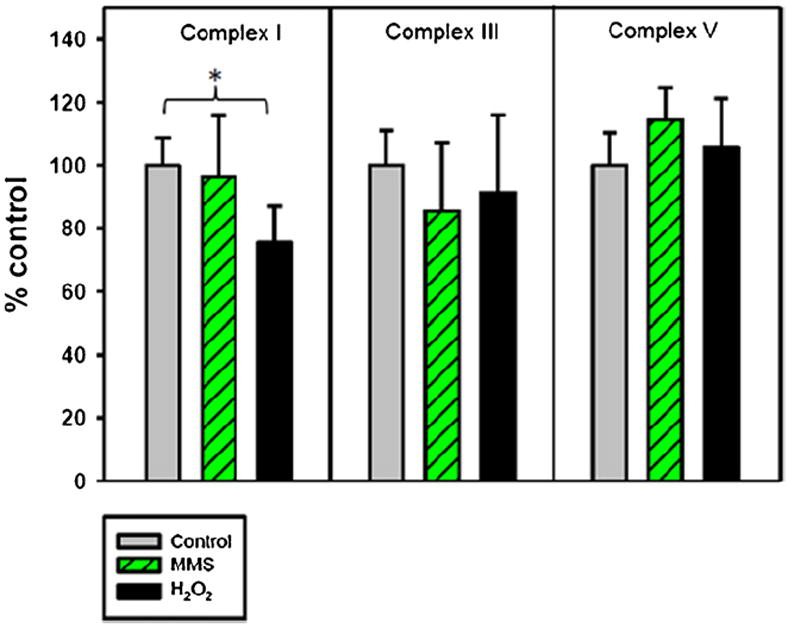
H2O2 and MMS affect mitochondrial complex levels differently. Cells were plated and the following day were treated for 15 or 60 min with 200 μM H2O2 or for 60 min with 2 mM MMS in serum-free media. After the treatment, the media was replaced with conditioned media and the cells were allowed to recover for 8 h. Cells at 8 h recovery were harvested and subjected to a multiplex assay detecting complex I, complex III, and complex V levels. Histogram of complex I, III, and V levels after H2O2 or MMS treatment. Three individual experiments were performed, with 1–2 replicates per treatment type. Light gray bar, control; green striped bar, 2 mM MMS for 60 min; black bar, 200 μM H2O2 for 60 min. Error bars represent SD, n = 5–6. A one-way ANOVA was used to analyze these data, p < 0.05 (*). (For interpretation of the references to color in this figure legend, the reader is referred to the web version of the article.)
3.5. Hydrogen peroxide but not MMS causes a steep decline in oxidative phosphorylation and a concomitant increase in glycolysis
In order to examine mitochondrial function, a combination of four pharmacological inhibitors was used consecutively during the Seahorse extracellular flux analysis. The oxygen consumption rate (OCR) measurements before compound injections are referred to as the basal OCR. The first compound that is injected is oligomycin, which inhibits complex V in the electron transport chain and causes a decrease in respiration. The difference between the resulting OCR and the basal OCR is the ATP-linked OXPHOS (Fig. 5A). The second and third compounds, FCCP and 2-DG, uncouple the mitochondria and inhibit glycolysis, respectively, which drives mitochondrial respiration to its maximal capacity, referred to in this study as the total reserve capacity (Fig. 5A). Finally, rotenone inhibits oxidative phosphorylation at complex I and blocks all mitochondrial oxygen consumption.
Fig. 5.
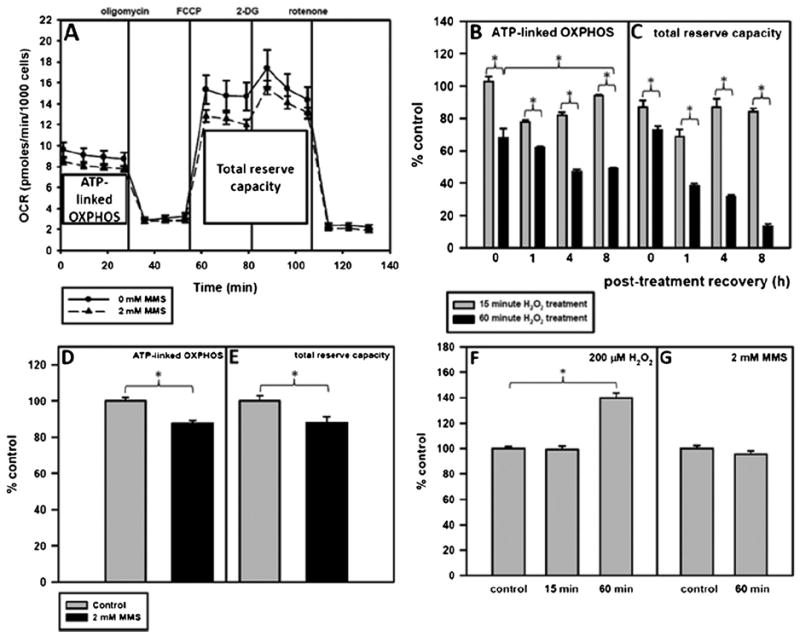
A 60-min H2O2 treatment and not a 60-min MMS treatment causes major mitochondrial dysfunction. Cells were plated and the following day were treated for 15 or 60 min with 200 μM H2O2 or for 60 min with 2 mM MMS in serum-free media. After the treatment, the media was replaced with conditioned media and the cells were allowed to recover. One hour before putting the cell plate into the Seahorse, unbuffered serum-free media was put on the cells and the cells were placed in a 0% CO2 incubator to rid the media of CO2. ATP-linked OXPHOS is represented by X̄1–4–X̄5–7 and total reserve capacity is represented by X̄8–13–X̄5–7. (A) Pharmacologic profile of mitochondrial OXPHOS 8 h after treatment with 2 mM MMS. Control-treated cells are represented by —●— and MMS-treated cells are represented by --▲--. Error bars represent the SEM of 2 separate Seahorse experiments with 6 replicates per run. (B) ATP-linked OXPHOS and (C) total reserve capacity of H2O2-treated cells at 0, 1, 4, and 8 h as compared to control-treated cells. (D) ATP-linked OXPHOS and (E) total reserve capacity of MMS-treated cells at 8 h as compared to control-treated cells. Basal glycolysis at 8 h after (F) H2O2 or (G) MMS treatment as compared to control-treated cells. ANOVA was used to analyze these data and a Tukey test for multiple comparisons was used to compare across groups, p < 0.05 (*). At all timepoints measured, the 60 min with 200 μM H2O2 treatment causes a significant reduction in mitochondrial function as compared to cells treated for 15 min with 200 μM H2O2.
We predicted that persistent mtDNA damage in both 60-min H2O2- and MMS-treated cells would result in mitochondrial dysfunction at 8 h. Fig. 5B shows the ATP-linked OXPHOS at 0, 1, 4, and 8 h following either a 15- or a 60-min treatment with H2O2. Immediately after a 60 min treatment with hydrogen peroxide, mitochondria become uncoupled, as evidenced by the smaller decrease in oxygen consumption rate after the addition of oligomycin (Supplementary Fig. 4A), and this is illustrated in Fig. 5B by the 32% drop in ATP-linked OXPHOS. After 1 h recovery from H2O2 treatment, there is a decrease in ATP-linked OXPHOS and total reserve capacity in both 15-min and 60-min H2O2-treated cells. This effect is greater in the 60-min treated cells (38% decrease in ATP-linked OXPHOS and 62% decrease in total reserve capacity). By 4 h after the H2O2 treatment, the 15-min treated cells have nearly recovered their total reserve capacity to control levels, but their ATP-linked OXPHOS is still decreased. This is in contrast to the 60-min H2O2-treated cells, which did not recover ATP-linked OXPHOS or total reserve capacity to mock-treated levels (53% loss of ATP-linked OXPHOS and 68% loss of total reserve capacity). At 8 h recovery, the 15-min H2O2-treated cells have restored their ATP-linked OXPHOS to control levels, but the 60-min H2O2-treated cells now show a 51% loss of ATP-linked OXPHOS and an 87% loss of total reserve capacity (Fig. 5C), in addition to a 40% increase in baseline glycolysis (Fig. 5F). The complete Seahorse profiles summarized in Fig. 5B and C are shown in Supplementary Fig 4A–D.
Fig. 5A shows the mitochondrial pharmacologic profile of MMS-and control-treated cells at 8 h after treatment. Unlike in 60-min H2O2-treated cells, a 60 min treatment with MMS did not cause massive mitochondrial dysfunction, and in fact only resulted in a 12% loss of ATP-linked OXPHOS (Fig. 5D) and total reserve capacity (Fig. 5E) at 8 h recovery and no concomitant increase in glycolysis (Fig. 5G).
4. Discussion
The purpose of this study was to better understand the relationship between persistent mtDNA damage and mitochondrial dysfunction. In this study we found that: (1) mtDNA damage persisted in cells treated with H2O2 or MMS for 60 min, but not in cells treated with H2O2 for 15 min; and that H2O2 damage persistence was not dependent upon the initial lesion frequency; (2) both the 15 min and 60 min H2O2 treatments caused a significant loss of mtDNA, but the 60 min treatment with MMS did not result in mtDNA loss; (3) cells treated for 60 min with MMS did not have significantly decreased levels of mitochondrial complexes or mitochondrial proteins at 8 h, while the 60-min H2O2-treated cells showed a decrease in the nuclear-encoded complex V subunit α (37% loss) and complex I (24% loss) at 8 h; (4) a 60 min H2O2 treatment caused a 51% loss of ATP-linked OXPHOS and a plunge in mitochondrial function to 13% of the control total reserve capacity by 8 h following treatment, unlike MMS-treated cells, which only resulted in a 12% loss of mitochondrial function at 8 h. Collectively, these data suggest that persistent mtDNA damage is not sufficient to cause rapid mtDNA loss and mitochondrial dysfunction.
QPCR analysis indicated persistent mtDNA lesions at 8 h following a 60 min treatment with H2O2 or MMS. The persistence of the lesions is not dependent on initial lesion frequency, but is dependent on treatment time; cells treated for 15 min with H2O2 did not have persistent mtDNA lesions at 8 h. To better understand the disparities between a 15-min and a 60-min treatment with H2O2, the H2O2 concentration was measured over time in the presence and absence of cells. The data show that the half-life of H2O2 in cells to be 15 min (Supplementary Fig. 5). Although the 15-min-treated cells are exposed to 50% of the H2O2 of the 60-min-treated cells, they have different fates regarding mtDNA, mtDNA damage, and mitochondrial function.
Although both H2O2 and MMS were able to induce persistent mtDNA damage, we suggest that persistent mtDNA damage may occur through two different mechanisms (Fig. 6). These differences may be due to one or more factors, including: (1) oxidation of mitochondrial proteins during H2O2 treatment that leads to a vicious cycle of ROS production and generation of mtDNA damage [3,6]; (2) impaired mitochondrial import of DNA repair proteins in H2O2- but not MMS-treated cells; (3) direct or indirect ROS-mediated inhibition of mtDNA repair during a crucial window of time for the initiation of repair; (4) insufficient alkylation repair pathway and/or (5) oxidant-induced alterations in mitochondrial dynamics of fission and fusion.
Fig. 6.
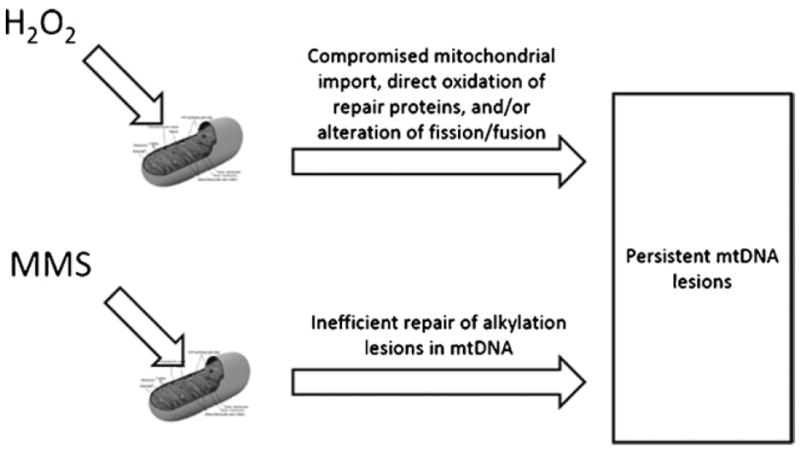
Model of mtDNA damage persistence in H2O2- versus MMS-treated cells. Mitochondrial DNA damage is predicted to persist in H2O2-treated cells due to oxidant-induced inhibition of mitochondrial protein import, direct oxidation of repair proteins, and/or perturbations in mitochondrial dynamics. MMS-induced mtDNA lesions are predicted to persist due to an insufficient alkylation repair pathway in mitochondria. As of yet, no proteins that recognize and repair alkylating lesions have been identified in mammalian mitochondria.
Oxidant treatments for 15- and 60-min led to a loss of mtDNA at 8 h, but a 60-min MMS treatment did not cause rapid mtDNA loss. Initial mtDNA lesion frequencies for the H2O2 and MMS treatments were similar, and these data indicate that mtDNA loss is not dependent on DNA lesion frequency. Likewise, mtDNA loss is not predictive for the persistence of mtDNA damage. Our data supports earlier work, which used different methods to suggest that oxidatively damaged mtDNA is degraded [10,42]; in addition, it reproduces in mammalian cells the results of a study in yeast in which MMS treatment showed no loss of mtDNA [43].
Cells treated for 60 min with 200 μM H2O2 showed a significant 37% decrease in the nuclear-encoded complex V subunit α (Fig. 3). However, results from the multiplex assay suggest that this decrease in complex V subunit α does not affect the total levels of complex V (Fig. 4). The lack of complex V loss suggests that perhaps complex V subunit α is produced in excess. Western analysis probably measures both free and complex-associated complex V α, whereas the multiplex assay was designed to pull down only intact complex V. Although the multiplex assay did not detect a loss of complex V in H2O2-treated cells, it did show a 24% loss of complex I. The decrease in complex V α in H2O2-treated cells could be due to (1) oxidant-impaired import of nuclear-encoded mitochondrial proteins [44,45] or (2) selective oxidative damage to the complex V subunit α gene (ATP5A1α) promoter, as suggested in a 2004 study [46]. In regard to cells treated with MMS for 60 min, these cells had no significant loss in either ND4 or complex V α using western blot (Fig. 3), and this finding was recapitulated using the multiplex assay, which showed no loss of complex I, III, or V (Fig. 4). The loss of complex I at 8 h after H2O2 treatment but no loss of complex I, III, or V at 8 h after MMS treatment is consistent with the significant mitochondrial dysfunction observed at 8 h post-treatment in H2O2-treated but not MMS-treated cells.
A 60 min H2O2 treatment led to a rapid and continual decrease in mitochondrial function. ATP-linked OXPHOS showed a 32% loss immediately following treatment, which increased to a 51% loss of ATP-linked OXPHOS at 8 h recovery. Startlingly, the initial 27% drop in total reserve capacity was exacerbated to 87% by 8 h following H2O2 treatment. In contrast, MMS-treated cells only showed a 12% loss of mitochondrial function by 8 h. Although the H2O2 treatment and the MMS treatment both had persistent mtDNA damage at 8 h post-treatment, this was not sufficient to drive mitochondrial dysfunction. The difference in mitochondrial function between the 60 min H2O2 treatment and the 60 min MMS treatment may instead be due to other factors, including: (1) oxidant-impaired import of nuclear-encoded proteins, which is suggested by the 37% loss of complex V α subunit in the H2O2-treated cells, (2) selective oxidant damage to the promoter region of ATP5A1α and/or (3) the excessive H2O2-induced loss of mtDNA (>50%), which is supported by the complete lack of OXPHOS seen in cells deficient in mtDNA (ρ0 cells).
Though the QPCR assay uses recombinant Thermus thermophilus polymerase, the ability of DNA lesions to block the polymerase is comparable to the mitochondrial DNA polymerase, polymerase γ. DNA lesions such as abasic sites and 8-oxoguanine in particular have been previously studied in the context of these two polymerases. Abasic sites are generated not only by oxidant treatment and base excision repair, but also by heating DNA lesions induced by alkylating agents [47]. T. thermophilus polymerase is blocked by abasic sites 95% of the time, and polymerase γ is blocked by this lesion greater than 80% of the time [48,49]. Regarding the 8-oxoguanine lesion, T. thermophilus polymerase was found to be blocked by this lesion 89% of the time, whereas polymerase γ is blocked by this lesion 95% of the time [48,50]. These findings indicate that the number of polymerase-blocking lesions measured in our study is applicable to polymerase γ.
In summary, this study addressed two important questions: (1) Do persistent mtDNA lesions lead to rapid mtDNA loss and/or mitochondrial dysfunction? (2) What are the effects of MMS on mtDNA lesion levels, mtDNA loss and mitochondrial function? The results of this study demonstrate that persistent mtDNA damage is not sufficient to cause rapid mtDNA loss or mitochondrial dysfunction. In addition, we showed that MMS generates more nDNA lesions than mtDNA lesions. Importantly, the mtDNA lesion frequencies that a range of 1–3 mM MMS generates are similar to H2O2-induced lesion frequencies in our study. However, unlike H2O2, MMS causes no mtDNA loss and a modest (12%) decrease in mitochondrial function. The question of slow repair kinetics of MMS-induced mtDNA damage remains unresolved. Surprisingly little is known about the enzymology of alkylation repair in the mitochondria. Future studies are needed to address the mechanism and kinetics of alkylation repair in mtDNA.
This study suggests that mitochondrial dysfunction is not caused by initial mtDNA lesion frequency or by persistent mtDNA damage and may instead be influenced by mtDNA copy number. With the observation that a 15-min 200 μM H2O2 treatment led to a 30% loss of mtDNA but a restoration of mitochondrial function by 8 h, it would be predicted that a >50% loss of mtDNA would lead to the further decline of mitochondrial function as seen in cells treated with 200 μM H2O2 for 60 min. Similarly, MMS-treated cells show no loss of mtDNA and perhaps consequently, no loss of mitochondrial function. Future studies will address the cause of H2O2-induced mtDNA loss and the possible role of mitophagy and/or mitochondrial fission in this process.
Supplementary Material
Acknowledgments
We thank Dr. Sruti Shiva for optimizing the ND4 antibody for our cells, Dr. Robert Sobol for the 92TAg MEFs, and Dr. Wei Qian for help with fluorescence microscopy. We thank Dr. Wei Zheng from Merck for providing the Milliplex® assay kit and for help in optimizing the assay, and the Cancer Biomarkers Facility for performing the multiplex assay.
Funding
This project is funded, in part, under a grant with the Pennsylvania Department of Health, PA CURE. Other sources of funding include the NCI-supported center grant P30CA047904 and R01ES019566. The Department specifically disclaims responsibility for any analyses, interpretations or conclusions. A.F. was supported by the University of Pittsburgh Cancer Institute Fellowship.
Footnotes
Appendix A. Supplementary data
Supplementary data associated with this article can be found, in the online version, at http://dx.doi.org/10.1016/j.dnarep.2012.06.002.
Conflict of interest statement
The authors declare that they have no conflict of interest.
References
- 1.LeDoux SP, Driggers WJ, Hollensworth BS, Wilson GL. Repair of alkylation and oxidative damage in mitochondrial DNA. Mutat Res. 1999;434:149–159. doi: 10.1016/s0921-8777(99)00026-9. [DOI] [PubMed] [Google Scholar]
- 2.Wallace DC. Diseases of the mitochondrial DNA. Annu Rev Biochem. 1992;61:1175–1212. doi: 10.1146/annurev.bi.61.070192.005523. [DOI] [PubMed] [Google Scholar]
- 3.Yakes FM, Van Houten B. Mitochondrial DNA damage is more extensive and persists longer than nuclear DNA damage in human cells following oxidative stress. Proc Natl Acad Sci U S A. 1997;94:514–519. doi: 10.1073/pnas.94.2.514. [DOI] [PMC free article] [PubMed] [Google Scholar]
- 4.Salazar JJ, Van Houten B. Preferential mitochondrial DNA injury caused by glucose oxidase as a steady generator of hydrogen peroxide in human fibroblasts. Mutat Res. 1997;385:139–149. doi: 10.1016/s0921-8777(97)00047-5. [DOI] [PubMed] [Google Scholar]
- 5.Sawyer D, Van Houten B. Repair of DNA damage in mitochondria. Mutat Res. 1999;434:161–176. doi: 10.1016/s0921-8777(99)00027-0. [DOI] [PubMed] [Google Scholar]
- 6.Santos JH, Hunakova L, Chen Y, Bortner C, Van Houten B. Cell sorting experiments link persistent mitochondrial DNA damage with loss of mitochondrial membrane potential and apoptotic cell death. J Biol Chem. 2003;278:1728–1734. doi: 10.1074/jbc.M208752200. [DOI] [PubMed] [Google Scholar]
- 7.Wunderlich V, Schutt M, Bottger M, Graffi A. Preferential alkylation of mitochondrial deoxyribonucleic acid by N-methyl-N-nitrosourea. Biochem J. 1970;118:99–109. doi: 10.1042/bj1180099. [DOI] [PMC free article] [PubMed] [Google Scholar]
- 8.Myers KA, Saffhill R, O’Connor PJ. Repair of alkylated purines in the hepatic DNA of mitochondria and nuclei in the rat. Carcinogenesis. 1988;9:285–292. doi: 10.1093/carcin/9.2.285. [DOI] [PubMed] [Google Scholar]
- 9.Pettepher CC, LeDoux SP, Bohr VA, Wilson GL. Repair of alkali-labile sites within the mitochondrial DNA of RINr 38 cells after exposure to the nitrosourea streptozotocin. J Biol Chem. 1991;266:3113–3117. [PubMed] [Google Scholar]
- 10.Shokolenko I, Venediktova N, Bochkareva A, Wilson G, Alexeyev M. Oxidative stress induces degradation of mitochondrial DNA. Nucleic Acids Res. 2009;37:2539–2548. doi: 10.1093/nar/gkp100. [DOI] [PMC free article] [PubMed] [Google Scholar]
- 11.Daugherty JP, Clapp NK. Association of nitrosamine-derived radioactivity with nuclear and mitochondrial DNA in mice. Jpn J Cancer Res. 1985;76:197–201. [PubMed] [Google Scholar]
- 12.Balaban R, Nemoto S, Finkel T. Mitochondria, oxidants, and aging. Cell. 2005;120:483–495. doi: 10.1016/j.cell.2005.02.001. [DOI] [PubMed] [Google Scholar]
- 13.Kujoth GC, Hiona A, Pugh TD, Someya S, Panzer K, Wohlgemuth SE, Hofer T, Seo AY, Sullivan R, Jobling WA, Morrow JD, Van Remmen H, Sedivy JM, Yamasoba T, Tanokura M, Weindruch R, Leeuwenburgh C, Prolla TA. Mitochondrial DNA mutations, oxidative stress, and apoptosis in mammalian aging. Science. 2005;309:481–484. doi: 10.1126/science.1112125. [DOI] [PubMed] [Google Scholar]
- 14.Trifunovic A, Wredenberg A, Falkenberg M, Spelbrink JN, Rovio AT, Bruder CE, Bohlooly YM, Gidlof S, Oldfors A, Wibom R, Tornell J, Jacobs HT, Larsson NG. Premature ageing in mice expressing defective mitochondrial DNA polymerase. Nature. 2004;429:417–423. doi: 10.1038/nature02517. [DOI] [PubMed] [Google Scholar]
- 15.Jarrett SG, Lin H, Godley BF, Boulton ME. Mitochondrial DNA damage and its potential role in retinal degeneration. Prog Retin Eye Res. 2008;27:596–607. doi: 10.1016/j.preteyeres.2008.09.001. [DOI] [PubMed] [Google Scholar]
- 16.de la Monte S, Luong T, Neely T, Robinson D, Wands J. Mitochondrial DNA damage as a mechanism of cell loss in Alzheimer’s disease. Lab Invest. 2000;80:1323–1335. doi: 10.1038/labinvest.3780140. [DOI] [PubMed] [Google Scholar]
- 17.Yang J, Weissman L, Bohr V, Mattson M. Mitochondrial DNA damage and repair in neurodegenerative disorders. DNA Repair. 2008;7:1110–1120. doi: 10.1016/j.dnarep.2008.03.012. [DOI] [PMC free article] [PubMed] [Google Scholar]
- 18.Durham S, Krishnan K, Betts J, Birch-Machin M. Mitochondrial DNA damage in non-melanoma skin cancer. Br J Cancer. 2003;88:90–95. doi: 10.1038/sj.bjc.6600773. [DOI] [PMC free article] [PubMed] [Google Scholar]
- 19.Parella P, Xiao Y, Fliss M, Sanchez-Cespedes M, Mazzarelli P, Rinaldi M, Nicol T, Gabrielson E, Cuomo C, Cohen D, Pandit S, Spencer M, Rabitti C, Fazio V, Sidransky D. Detection of mitochondrial DNA mutations in primary breast cancer and fine-needle aspirates. Cancer Res. 2001;61:7623–7626. [PubMed] [Google Scholar]
- 20.Sanchez-Cespedes M, Parella P, Nomoto S, Cohen D, Xiao Y, Esteller M, Jeronimo C, Jordan R, Nicol T, Koch W, Schoenberg M, Mazzarelli P, Fazio V, Sidransky D. Identification of a mononucleotide repeat as a major target for mitochondrial DNA alterations in human tumors. Cancer Res. 2001;61:7015–7019. [PubMed] [Google Scholar]
- 21.Barbi de Moura M, Santana dos Santos L, Van Houten B. Mitochondrial dysfunction in neurodegenerative diseases and cancer. Environ Mol Mutagen. 2010;51:391–405. doi: 10.1002/em.20575. [DOI] [PubMed] [Google Scholar]
- 22.Ballinger SW, Patterson C, Yan CN, Doan R, Burow DL, Young CG, Yakes FM, Van Houten B, Ballinger CA, Freeman BA, Runge MS. Hydrogen peroxide- and peroxynitrite-induced mitochondrial DNA damage and dysfunction in vascular endothelial and smooth muscle cells. Circ Res. 2000;86:960–966. doi: 10.1161/01.res.86.9.960. [DOI] [PubMed] [Google Scholar]
- 23.Ballinger SW, Van Houten B, Jin GF, Conklin CA, Godley BF. Hydrogen peroxide causes significant mitochondrial DNA damage in human RPE cells. Exp Eye Res. 1999;68:765–772. doi: 10.1006/exer.1998.0661. [DOI] [PubMed] [Google Scholar]
- 24.Lee H, Yin P, Chi C, Wei Y. Increase in mitochondrial mass in human fibroblasts under oxidative stress and during replicative cell senescence. J Biomed Sci. 2002;9:517–526. doi: 10.1007/BF02254978. [DOI] [PubMed] [Google Scholar]
- 25.Chen Q, Ames B. Senescence-like growth arrest induced by hydrogen peroxide in human diploid fibroblast F65 cells. Proc Natl Acad Sci. 1994;91:4130–4134. doi: 10.1073/pnas.91.10.4130. [DOI] [PMC free article] [PubMed] [Google Scholar]
- 26.Chen Q, Bartholomew J, Campisi J, Acosta M, Reagan J, Ames B. Molecular analysis of H2O2-induced senescent-like growth arrest in normal human fibroblasts: p53 and Rb control G1 arrest but not cell replication. Biochem J. 1998;332:43–50. doi: 10.1042/bj3320043. [DOI] [PMC free article] [PubMed] [Google Scholar]
- 27.Chen Q, Fischer A, Reagan J, Y LJ, Ames B. Oxidative DNA damage and senescence of human diploid fibroblast cells. Proc Natl Acad Sci. 1995;92:4337–4341. doi: 10.1073/pnas.92.10.4337. [DOI] [PMC free article] [PubMed] [Google Scholar]
- 28.Barnouin K, Dubuisson ML, Child ES, Fernandez de Mattos S, Glassford J, Medema RH, Mann DJ, Lam EW. H2O2 induces a transient multi-phase cell cycle arrest in mouse fibroblasts through modulating cyclin D and p21Cip1 expression. J Biol Chem. 2002;277:13761–13770. doi: 10.1074/jbc.M111123200. [DOI] [PubMed] [Google Scholar]
- 29.Bladier C, Wolvetang EJ, Hutchinson P, de Haan JB, Kola I. Response of a primary human fibroblast cell line to H2O2 : senescence-like growth arrest or apoptosis? Cell Growth Differ. 1997;8:589–598. [PubMed] [Google Scholar]
- 30.Teramoto S, Tomita T, Matsui H, Ohga E, Matsuse T, Ouchi Y. Hydrogen peroxide-induced apoptosis and necrosis in human lung fibroblasts: protective roles of glutathione. Jpn J Pharmacol. 1999;79:33–40. doi: 10.1254/jjp.79.33. [DOI] [PubMed] [Google Scholar]
- 31.Zhang H, Kong X, Kang J, Su J, Li Y, Zhong J, Sun L. Oxidative stress induces parallel autophagy and mitochondrial dysfunction in human glioma U251 cells. Toxicol Sci. 2009;110:376–388. doi: 10.1093/toxsci/kfp101. [DOI] [PubMed] [Google Scholar]
- 32.Lu M, Gong X. Upstream reactive oxidative species (ROS) signals in exogenous oxidative stress-induced mitochondrial dysfunction. Cell Biol Int. 2009;33:658–664. doi: 10.1016/j.cellbi.2009.03.009. [DOI] [PubMed] [Google Scholar]
- 33.Miguel F, Augusto A, Gurgueira S. Effect of acute vs chronic H2O2-induced oxidative stress on antioxidant enzyme activities. Free Radic Res. 2009;43:340–347. doi: 10.1080/10715760902751894. [DOI] [PubMed] [Google Scholar]
- 34.Nulton-Persson A, Szweda L. Modulation of mitochondrial function by hydrogen peroxide. J Biol Chem. 2001;276:23357–23361. doi: 10.1074/jbc.M100320200. [DOI] [PubMed] [Google Scholar]
- 35.Santos JH, Meyer JN, Mandavilli BS, Van Houten B. Quantitative PCR-based measurement of nuclear and mitochondrial DNA damage and repair in mammalian cells. Methods Mol Biol. 2006;314:183–199. doi: 10.1385/1-59259-973-7:183. [DOI] [PubMed] [Google Scholar]
- 36.Qian W, Van Houten B. Alterations in bioenergetics due to changes in mitochondrial DNA copy number. Methods. 2010;51:452–457. doi: 10.1016/j.ymeth.2010.03.006. [DOI] [PubMed] [Google Scholar]
- 37.Graves JA, Rothermund K, Wang T, Qian W, Van Houten B, Prochownik EV. Point mutations in c-Myc uncouple neoplastic transformation from multiple other phenotypes in rat fibroblasts. PLoS One. 2010;5:e13717. doi: 10.1371/journal.pone.0013717. [DOI] [PMC free article] [PubMed] [Google Scholar]
- 38.Tann AW, Boldogh I, Meiss G, Qian W, Van Houten B, Mitra S, Szczesny B. Apoptosis induced by persistent single-strand breaks in mitochondrial genome: critical role of EXOG (5′-EXO/endonuclease) in their repair. J Biol Chem. 2011;286:31975–31983. doi: 10.1074/jbc.M110.215715. [DOI] [PMC free article] [PubMed] [Google Scholar]
- 39.Rosner M, Siegel N, Fuchs C, Slabina N, Dolznig H, Hengstschlager M. Efficient siRNA-mediated prolonged gene silencing in human amniotic fluid stem cells. Nat Protoc. 2010;5:1081–1095. doi: 10.1038/nprot.2010.74. [DOI] [PubMed] [Google Scholar]
- 40.Lindl T, Lewandowski B, Schreyogg S, Staudte A. An evaluation of the in vitro cytotoxicities of 50 chemicals by using an electrical current exclusion method versus the neutral red uptake and MTT assays. Altern Lab Anim. 2005;33:591–601. doi: 10.1177/026119290503300614. [DOI] [PubMed] [Google Scholar]
- 41.Akilov OE, Wu MX, Ustyugova IV, Falo LD, Jr, Geskin LJ. Resistance of Sezary cells to TNF-alpha-induced apoptosis is mediated in part by a loss of TNFR1 and a high level of the IER3 expression. Exp Dermatol. 2012;21:287–292. doi: 10.1111/j.1600-0625.2012.01452.x. [DOI] [PMC free article] [PubMed] [Google Scholar]
- 42.Oka S, Ohno M, Tsuchimoto D, Sakumi K, Furuichi M, Nakabeppu Y. Two distinct pathways of cell death triggered by oxidative damage to nuclear and mitochondrial DNAs. EMBO J. 2008;27:421–432. doi: 10.1038/sj.emboj.7601975. [DOI] [PMC free article] [PubMed] [Google Scholar]
- 43.Acevedo-Torres K, Fonseca-Williams S, Ayala-Torres S, Torres-Ramos CA. Requirement of the Saccharomyces cerevisiae APN1 gene for the repair of mitochondrial DNA alkylation damage. Environ Mol Mutagen. 2009;50:317–327. doi: 10.1002/em.20462. [DOI] [PMC free article] [PubMed] [Google Scholar]
- 44.Wright G, Terada K, Yano M, Sergeev I, Mori M. Oxidative stress inhibits the mitochondrial import of preproteins and leads to their degradation. Exp Cell Res. 2001;263:107–117. doi: 10.1006/excr.2000.5096. [DOI] [PubMed] [Google Scholar]
- 45.Wright G, Reichenbecher V, Green T, Wright GL, Wang S. Paraquat inhibits the processing of human manganese-dependent superoxide dismutase by SF-9 insect cell mitochondria. Exp Cell Res. 1997;234:78–84. doi: 10.1006/excr.1997.3579. [DOI] [PubMed] [Google Scholar]
- 46.Lu T, Pan Y, Kao SY, Li C, Kohane I, Chan J, Yankner BA. Gene regulation and DNA damage in the ageing human brain. Nature. 2004;429:883–891. doi: 10.1038/nature02661. [DOI] [PubMed] [Google Scholar]
- 47.Strauss BS. Translesion DNA synthesis: polymerase response to altered nucleotides. Cancer Surv. 1985;4:493–516. [PubMed] [Google Scholar]
- 48.Belousova EA, Rechkunova NI, Lavrik OI. Thermostable DNA polymerases can perform translesion synthesis using 8-oxoguanine and tetrahydrofuran-containing DNA templates. Biochim Biophys Acta. 2006;1764:97–104. doi: 10.1016/j.bbapap.2005.11.001. [DOI] [PubMed] [Google Scholar]
- 49.Matsumoto Y, Kim K, Bogenhagen DF. Proliferating cell nuclear antigen-dependent abasic site repair in Xenopus laevis oocytes: an alternative pathway of base excision DNA repair. Mol Cell Biol. 1994;14:6187–6197. doi: 10.1128/mcb.14.9.6187. [DOI] [PMC free article] [PubMed] [Google Scholar]
- 50.Graziewicz MA, Bienstock RJ, Copeland WC. The DNA polymerase gamma Y955C disease variant associated with PEO and parkinsonism mediates the incorporation and translesion synthesis opposite 7,8-dihydro-8-oxo-2′-deoxyguanosine. Hum Mol Genet. 2007;16:2729–2739. doi: 10.1093/hmg/ddm227. [DOI] [PMC free article] [PubMed] [Google Scholar]
Associated Data
This section collects any data citations, data availability statements, or supplementary materials included in this article.