

Abstract
Carbohydrate-functionalized gold nanoparticles were employed to differentiate plant-legume lectins using a statistical analysis method of linear discriminant analysis (LDA). Various carbohydrates were conjugated on gold nanoparticles, and the resulting glyconanoparticles were treated with lectins. Changes in the localized surface plasmon resonance of the glyconanoparticles upon lectin binding were recorded and the data were subjected to LDA. Results showed that the glyconanoparticles successfully differentiated all lectins.
Keywords: Au nanoparticles, Localized Surface Plasmon Resonance, Linear Discriminant Analysis, Lectins, Carbohydrates
Introduction
Lectins are glycan-binding proteins that are found ubiquitously in nature.1-3 These sugar-binding proteins play a pivotal role in biological processes, including cell signaling, cell–cell communication, and pathogen–host recognition.4-7 The host cell receptors that bind to viruses and bacteria are often glycan recognizing complexes such as lectins, and the interactions between lectins on the host cell surface and carbohydrate epitopes on the microbe cell can initiate pathogenic infection.8, 9 Therefore, recognizing the various lectin types that assist in these processes is of vital importance not only for diagnosis but also for developing effective therapeutics. For instance, lectins can serve as biomarkers in cancer tissues to aid early detection of cancers.10 Most lectin differentiation methods use carbohydrates as the sensing element, where the lectin identification relies on the strength of the interactions between a carbohydrate ligand and its binding lectin. A frontier in profiling carbohydrate-lectin interactions is the high throughput screening platform of glycan microarrays or lectin microarrays.11,12 Recent development in lectin differentiation uses glycoconjugates whereby glycans are conjugated on nanoparticles.13, 14 The nanoparticle acts as a multivalent scaffold greatly enhancing the otherwise relative weak affinity of glycans to lectins. When nanomaterials such as quantum dots, fluorescently-doped silica nanoparticles, magnetic nanoparticles and gold nanoparticles (AuNP) are used, specific glycan-lectin interactions result in readable signals such as fluorescence, light scattering, magnetic, or localized surface plasmon resonance (LSPR), which can be subsequently analyzed to differentiate lectins.15-18
Pattern-based detection is an emerging technique that employs a differential sensing strategy to distinguish one analyte from another. It evaluates a collection of signals arising from the analyte interacting with many different sensing elements.19-22 Unlike a single sensing element that requires high affinity between the interacting pair, the pattern recognition-based platform relies on multiple responses that may not necessarily have high affinity values. As long as the multiple sensing elements produce a series of signals whose response pattern varies from one analyte to another, the analyte can be differentiated after subjecting the data to chemometric analysis.20-25 The technique is therefore highly valuable for systems that involve weak interactions between recognition pairs such as glycans and lectins. Among the pattern recognition analysis tools, linear discriminant analysis (LDA) is a simple yet robust technique for analyte classification.26-28 LDA was first discovered by Fisher in 1936 for taxonomic classification,29 and through the years it has been successfully employed in a wide range of applications including sensing, material classification, and identification of disease cells.30, 31
Herein we employ the pattern recognition technique to differentiate lectins using LDA. Our method involves using AuNPs functionalized with different carbohydrate ligands (GlycoAuNPs).32 AuNPs exhibit unique LSPR, and the resonance wavelength is highly sensitive to boundary changes such as molecular recognition events at the nanoparticle surface.33,34 Therefore, when GlycoAuNP is treated with a lectin, a red shift in the λmax of the LSPR absorption occurs.32,35 The red shift varies depending on the carbohydrate on the GlycoAuNP. By using GlycoAuNPs having different carbohydrate ligands, a series of LSPR changes will be obtained. These Δλmax values, when subjecting to LDA analysis, enable the differentiation and identification of the lectin.
Experimental Procedures
Materials and Methods
4-O-β-d-Galactopyranosyl-d-glucopyranose (Lac), d-arabinose (Ara), 4-O-β-d-glucopyranosyl-d-glucopyranose (Cello2), β-d-fructofuranosyl-α-d-glucopyranoside (Suc), d-mannose (Man), d-glucose (Glc), d-galactose (Gal) were purchased from TCI America. 4-O-α-d-Mannopyranosyl-d-mannopyranose (Man2), 3-O-β-d-glucopyranosyl-d-glucopyranose (Glc2), 3-O-α-d-galactopyranosyl-d-galactopyranose (Gal2) were purchased from V Labs Inc. (Covington, LA). N-Acetyl-d-glucosamine (GlcNAc) was purchased from AK Scientific Inc. (Union City, CA). Concanavalin A (Con A - jack bean protein), soybean agglutinin (SBA) from Glycine max, GSII from Griffonia simplicifolica and peanut Agglutinin (PNA) from Arachis hypogaea, HAuCl4·3H2O, phosphate buffer saline (PBS) tablets, HEPES, bovine serum albumin (BSA), and Tween® 20 were purchased from Sigma-Aldrich. Water used was from a Milli-Q water purification system. UV-vis spectra were recorded using a Perkin-Elmer Lambda 45 spectrophotometer. FTIR spectra were obtained using Perkin-Elmer 2000 Fourier transform spectrometer. Dynamic light scattering (DLS) measurements were taken using Horiba LB-550 nanoparticle size analyzer (Horiba Scientific Ltd., Kyoto, Japan). Photocoupling reactions were carried out using a 450-W medium pressure, quartz mercury vapor lamp (Ace Glass Inc., Vineland, NJ). Linear discriminant analysis was performed using the statistical software XLSTAT® (Addinsoft, New York, NY).
Preparation of GlycoAuNPs
Gold nanoparticles were synthesized using the citrate reduction method as previously reported.32 All glassware was washed in aqua regia (3:1 conc. HCl/conc. HNO3) and rinsed thoroughly with D.I. water. An aqueous solution of HAuCl4·3H2O (0.2 mM) was heated to boiling, and an aqueous solution of sodium citrate (1% w/v, 1.8 mL) was added. The solution was then cooled to room temperature while vigorously stirring. A solution of PFPA-disulfide (11,11′-disulfanediylbis(undecane-11,1-diyl)bis(4-azido-2,3,5,6-tetrafluorobenzoate), synthesized following a previously reported procedure,32) in acetone (1.7 mM, 5 mL) was added and the resulting solution was stirred for 10 h. The solution was centrifuged at 12,000 rpm for 10 min, and the precipitate was re-dissolved in acetone (100 mL). The washing, centrifugation, and re-dispersion were repeated 3 times each. The final product, PFPA-functionalized AuNP (PFPA-AuNP), was stored in acetone (100 mL) at room temperature.
GlycoAuNPs were prepared using the photocoupling method developed in our laboratory.32 A solution of PFPA-AuNP in acetone (~ 1 mg/mL, 1.0 mL) was mixed with an aqueous solution of carbohydrate (2.9 mM, 100 μL) in an aluminum foil-covered short beaker while the opening was covered with a 280-nm long-path optical filter (Schott Glass Technologies Inc., Duryea, PA). The solution was exposed to the Hg lamp for 7 min while stirring. The resulting solution was then centrifuged at 10,000 rpm for 8 min and the precipitate was redispersed in Milli-Q water (1.5 mL). Excess reagents were removed by subjecting the solution to dialysis in water overnight. The resulting GlycoAuNPs, abbreviated as ManAuNP, GlcAuNP, GalAuNP, SucAuNP, LacAuNP, AraAuNP, Cello2AuNP, Man2AuNP, Glc2AuNP, Gal2AuNP and GlcNAcAuNP, respectively, were stored at 4 °C.
Lectin sensing using GlycoAuNPs
GlycoAuNP (~ 1 mg/mL, 1.0 mL) was incubated for 1 h in a pH 7.4 PBS buffer (0.5 mL) containing 3% BSA and 0.2% Tween® 20. The excess BSA was removed by repeated centrifugation (10,000 rpm, 6 min) and re-dispersion in PBS buffer (1.5 mL). To the BSA-treated GlycoAuNP, lectin Con A, SBA, GSII or PNA (10 μg/mL, 1 mL) was introduced and the resulting solution was incubated at room temperature for 1 h. Con A was prepared in pH 7.4 HEPES buffer containing 0.1 mM Ca2+ and Mg2+, while SBA, GSII and PNA were prepared in pH 7.4 PBS buffer.
The GlycoAuNP solutions before and after treating with lectins were measured by UV-vis spectroscopy and λmax values were recorded (see typical spectra in Figure 1). Subtracting the λmax value of GlycoAuNP from that after it was treated with lectin gave the LSPR shift, Δλmax, which was used to generate the training matrices. Training matrix TM I was prepared using Con A, SBA, GSII and PNA interacting with ManAuNP, GlcAuNP, GalAuNP, Man2AuNP, Glc2AuNP, Gal2AuNP and GlcNAcAuNP, respectively. Each experiment was repeated 5 times and Δλmax values calculated (Table 1). Training matrix TM II was created using Con A, SBA and PNA interacting with LacAuNP, SucAuNP, AraAuNP and Cello2AuNP, respectively. Each experiment was repeated 3 times and Δλmax values calculated (Table 4).
Figure 1.

UV-vis spectra of (a) GalAuNP before (solid line) and after (dotted line) interacting with SBA, (b) AraAuNP before (solid line) and after (dotted line) interacting with SBA.
Table 1.
Training matrix TM I: LSPR shifts (Δλmax, nm) obtained from treating lectins with GlycoAuNPs.
| Lectin\GlycoAuNP | Man AuNP |
Glc AuNP |
Gal AuNP |
Man2 AuNP |
Glc2 AuNP |
Gal2 AuNP |
GlcNAc AuNP |
|---|---|---|---|---|---|---|---|
| Con A | 74.9 | 13.7 | 1.7 | 69.3 | 19.3 | 1.5 | 9.4 |
| Con A | 73.4 | 13.4 | 2.1 | 77.4 | 20.1 | 2.2 | 8.1 |
| Con A | 69.8 | 14.7 | 2.4 | 81.4 | 16.4 | 5.3 | 17.8 |
| Con A | 69.1 | 14.9 | 1.2 | 67.6 | 23.0 | 1.1 | 19.8 |
| Con A | 55.8 | 19.3 | 1.6 | 79.8 | 22.7 | 5.4 | 16.4 |
| SBA | 2.3 | 15.4 | 68.2 | 5.4 | 3.3 | 50.6 | 1.4 |
| SBA | 2.5 | 8.8 | 47.2 | 4.8 | 2.9 | 62.3 | 3.6 |
| SBA | 3.9 | 8.4 | 48.2 | 3.2 | 3.8 | 50.9 | 2.2 |
| SBA | 3.1 | 14.2 | 56.1 | 2.9 | 3.1 | 51.9 | 3.4 |
| SBA | 4.7 | 13.7 | 63.3 | 4.2 | 5.4 | 65.8 | 0.9 |
| GSII | 3.1 | 11.2 | 4.2 | 5.2 | 4.0 | 7.4 | 48.2 |
| GSII | 4.0 | 12.0 | 1.8 | 6.5 | 4.1 | 4.7 | 49.2 |
| GSII | 7.4 | 8.2 | 1.1 | 5.9 | 5.5 | 8.2 | 53.4 |
| GSII | 2.9 | 4.7 | 4.0 | 4.9 | 5.2 | 7.9 | 44.0 |
| GSII | 8.6 | 6.4 | 4.9 | 6.0 | 4.2 | 3.2 | 51.2 |
| PNA | 1.7 | 18.2 | 49.2 | 2.1 | 24.3 | 42.5 | 0.8 |
| PNA | 3.2 | 24.7 | 51.3 | 2.5 | 26.1 | 59.2 | 2.6 |
| PNA | 2.8 | 24.9 | 39.2 | 2.7 | 25.0 | 57.3 | 1.6 |
| PNA | 1.8 | 19.4 | 38.2 | 1.7 | 24.6 | 57.4 | 1.4 |
| PNA | 3.0 | 13.8 | 48.1 | 3.0 | 25.5 | 54.6 | 0.1 |
Table 4.
Training matrix TM II: LSPR shifts (Δλmax, nm) obtained from treating lectin with GlycoAuNP.
| Lectin\GlycoAuNP | LacAuNP | SucAuNP | AraAuNP | Cello2AuNP |
|---|---|---|---|---|
| SBA | 1.5 | 0.0 | 5.1 | 0.0 |
| SBA | 3.7 | 1.1 | 5.9 | 0.8 |
| SBA | 1.1 | 1.4 | 4.5 | 2.1 |
| PNA | 2 | 4.9 | 1.8 | 2.2 |
| PNA | 2.4 | 1.4 | 1.6 | 1.8 |
| PNA | 3.7 | 2.4 | 2.1 | 1.3 |
| Con A | 6.2 | 4.8 | 1.9 | 1.1 |
| Con A | 5.1 | 2.4 | 0.8 | 1.8 |
| Con A | 7.9 | 2.8 | 1.1 | 0.1 |
Linear Discriminant Analysis
The training matrices were analyzed by LDA using forward stepwise discrimination.36 A commercially available software XLSTAT® was used for the analysis. The tolerance level was kept at 0.001 and the significance level was kept at 0.05. In the LDA analysis, the discriminant scores (F1 and F2) were calculated from the explanatory variables (Δλmax) and were plotted in a 2D score plot where each lectin has a unique F1 and F2 coordinates. Large spatial separation of the lectin classes provides proof of satisfactory classification.
To test the vigor of the LDA in identifying unknown samples, a series of blind experiments were conducted. The first experiment was carried out using TM I. Four lectin samples (U1-U4) were blindly prepared (10 μg/mL), and each sample was allowed to interact with ManAuNP, GlcAuNP, GalAuNP, Man2AuNP, Glc2AuNP, Gal2AuNP and GlcNAcAuNP, respectively, under the same conditions as the samples in TM I. The Δλmax values were then recorded (Table 2). Classification of the blind tests was carried out by calculating the posterior probabilities for each blind test. The identification of the lectin to a particular lectin class was determined where the probability of belonging was the highest.
Table 2.
LSPR shifts (Δλmax, nm) recorded for blindly prepared lectin (U1-U4) interacting with GlycoAuNPs.
| Unknown Lectin \GlycoAuNP |
Man AuNP |
Glc AuNP |
Gal AuNP |
Man2 AuNP |
Glc2 AuNP |
Gal2 AuNP |
GlcNAc AuNP |
|---|---|---|---|---|---|---|---|
| U1 | 52.2 | 20.1 | 5.8 | 61.3 | 29.9 | 3.3 | 16.8 |
| U2 | 6.7 | 15.6 | 43.6 | 9.6 | 8.1 | 43.5 | 5.4 |
| U3 | 16.3 | 19.2 | 15.2 | 10.1 | 9 | 13.2 | 38 |
| U4 | 7.7 | 27.6 | 41 | 9.9 | 27.9 | 43.3 | 6.6 |
The second blind test was carried out using TM II. Seven lectin samples (T1-T6) were blindly prepared (10 μg-mL) and Δλmax values were recorded after each sample was allowed to interact with LacAuNPs, SucAuNPs, AraAuNPs and Cello2AuNPs, respectively, under the same conditions as the sample in TMII (Table 5). The posterior probability calculation determines the classification of the lectins in blind tests T1-T6 (Table 6).
Table 5.
LSPR shifts (Δλmax, nm) recorded from the blindly prepared lectin (T1-T6) interacting with GlycoAuNPs.
| Unknown Lectin/GlycoAuNP |
Lac AuNP |
Suc AuNP |
Ara AuNP |
Cello2 AuNP |
|---|---|---|---|---|
| T1 | 1.6 | 0.5 | 4.5 | 2.1 |
| T2 | 1.1 | 0.5 | 5.0 | 1.8 |
| T3 | 5.5 | 3.0 | 1.1 | 2.0 |
| T4 | 5.7 | 2.5 | 1.0 | 1.8 |
| T5 | 2.5 | 2.1 | 1.9 | 2.0 |
| T6 | 1.1 | 0.5 | 4.5 | 2.1 |
Table 6.
Factor scores and predicted identity of unknown samples from the blind tests using TM II.
| Unknown | F1 | F2 | Predicted | Actual |
|---|---|---|---|---|
| T1 | 7.6962 | 0.1923 | SBA | SBA |
| T2 | 9.3633 | −0.0267 | SBA | SBA |
| T3 | −6.0457 | 0.5649 | Con A | Con A |
| T4 | −6.2347 | 0.6765 | Con A | Con A |
| T5 | −0.9589 | −1.0710 | PNA | PNA |
| T6 | 8.0990 | −0.1930 | SBA | SBA |
Results and Discussion
GlycoAuNPs were prepared using the photocoupling chemistry developed in our laboratory.32,35,37,38 Briefly, AuNP synthesized by citrate reduction was functionalized with a perfluorophenyl azide (PFPA), PFPA-disulfide, to give PFPA-AuNP (Scheme 1). Carbohydrates were then conjugated on AuNP by a light-activated insertion reaction of the PFPA. A total of eleven carbohydrates were used to give eleven different GlycoAuNPs: GlcAuNP, ManAuNP, GalAuNP, AraAuNP, GlcNAcAuNP Man2AuNP, Glc2AuNP, SucAuNP, Cello2AuNP, LacAuNP, and Gal2AuNP (Scheme 1). When the GlycoAuNP was treated with a lectin, a red shift in the LSPR absorption band was observed. Typical spectra showing the changes in LSPR absorptions are shown in Figure 1. As expected, the interaction of GlycoAuNP and its specific binding lectin (e.g., GalAuNP and SBA) produced a larger Δλmax shift (Figure 1a) than that of the low-affinity pair (e.g., AraAuNPs and SBA) which gave a smaller Δλmax shift (Figure 1b).
A training matrix, TM I, was constructed from seven GlycoAuNPs and four lectins. LSPR shifts are obtained by subtracting the λmax value of each GlycoAuNP from the value after it was treated with the lectin. The binding affinity of each GlycoAuNP-lectin pair varies, thus different LSPR shift values, ranging from 0.1 to 81.4 nm, were obtained (Table 1).
The numerical values of the λmax shifts were used in the subsequent statistical analysis for the discrimination of different lectins. LDA employs a linear combination of the explanatory variables to create an n dimensional space where the dependent variables can be discriminated from one another. Here, LDA analyzes a training matrix created by a collection of explanatory and dependent variables, where the dependent variables (lectins) are classified according to the factor scores generated by the explanatory variables (LSPR shift). Each analyzed lectin is given a factor score (F1 and F2), which becomes coordinates for the observation on the factor plot. The maximal separation of the lectin classes in the two-dimensional space (F1 and F2) in the factor plot attests to a high level of discrimination. LDA analysis of the training matrix (TM I) was performed, and results are presented as the canonical factor plot in Figure 2. As can be seen, the lectins Con A, PNA SBA and GSII are clearly classified into groups on the factor plot within a 95% confidence ellipse.
Figure 2.
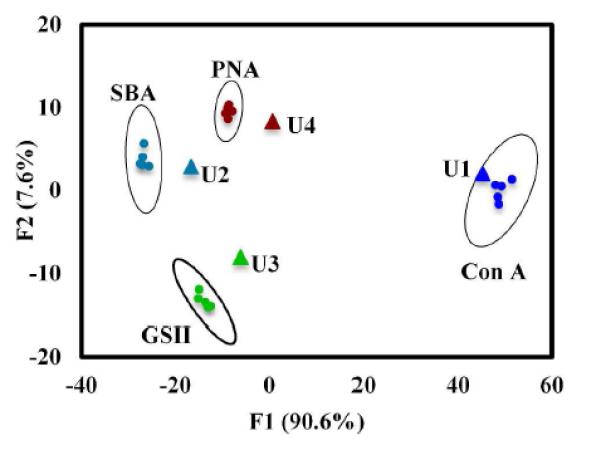
Factor plot of Con A, PNA, SBA and GSII classified from interactions with ManAuNP, GlcAuNP, GalAuNP, Man2AuNP, Glc2AuNP, Gal2AuNP and GlcNAcAuNP. Dots represent the members in the training matrix (TM I), and the triangles are the unknown samples (U1-U4) in the blind tests.
To test the ability of the training matrix to identify unknown lectins, four blindly prepared lectins (U1-U4) were prepared as test samples. Each sample was treated with all seven GlycoAuNPs, and the λmax shifts were recorded (Table 2). Prosterior probability was then calculated using the Bayes formula to ascertain the group membership of the blind tests. Results show that all four blind test samples were correctly classified to their appropriate lectin groups with a classification accuracy of 100% (Table 3 and Figure 2).
Table 3.
Factor scores and predicted identity of unknown samples using TM I.
| Unknown | F1 | F2 | Predicted | Actual |
|---|---|---|---|---|
| U1 | 45.258 | 2.058 | Con A | Con A |
| U2 | −16.616 | 2.865 | SBA | SBA |
| U3 | −6.103 | −8.007 | GSII | GSII |
| U4 | 0.750 | 8.390 | PNA | PNA |
To further test the vigor of this technique, weak binding pairs were chosen such that the glycan-lectin interactions would generate smaller signal changes (Figure 1b). In this case, a training matrix, TM II, was constructed and consisted of four GlycoAuNPs and three lectins (Table 4). The LSPR shifts, ranging from 0.0 to 7.9 nm, were mostly smaller than those in TM I (Table 4). The data were then subjected to LDA analysis, and the factor score plot obtained is shown in Figure 3. Despite the weak affinity of the interacting pairs, each lectin can still be clearly classified on the factor plot within a 95% confidence ellipse.
Figure 3.
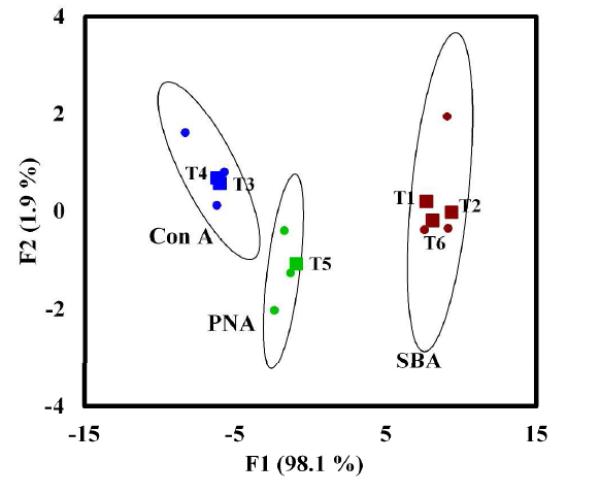
Factor plot of Con A, PNA and SBA classified from interactions with SucAuNP, LacAuNP, AraAuNP and Cello2AuNP. Dots represent the lectins in the training matrix (TM II), and the triangles are the unknown samples (T1-T6) from the blind tests.
This training matrix TM II was further used to identify unknown lectins. Seven blind samples (T1-T6) were created and treated with each of the four GlycoAuNPs. The LSPR shifts were subsequently recorded (Table 5). LDA analysis and prosterior probability calculation showed that all seven unknowns were correctly identified without any misclassification to their appropriate lectin classes (Table 6 and Figure 3). Even for the weakly interacting lectin-GlycoAuNP pairs, with the aid of LDA, all unknown lectins were accurately identified.
Conclusion
In summary, pattern based recognition strategy has been successfully applied to differentiate lectins. The sensing system consists of glyconanoparticles having strong, weak and no affinity towards lectins. LDA analysis of the LSPR shifts upon treating GlycoAuNPs with lectins generated score plots that can clearly classify different lectins. More significantly, even the training matrix consisting of small LSPR shifts (0 – 8 nm) from the weak and non-interacting pairs could be analyzed by LDA to accurately identify the blindly prepared unknown samples. The results also demonstrate that relatively small training matrices can produce accurate and reliable results. Our method to synthesize GlycoAuNPs is general, and can be used to prepare large GlycoAuNP libraries as well as other glyconanomaterials including magnetic nanoparticles, quantum dots, silica nanoparticles.38-40 Thus the strategy developed here represents a robust and a versatile platform that can be applied to other systems for sensing and differentiating a wide range of analytes.
Scheme 1.

Synthesis of GlycoAuNP, and carbohydrates used in this study.
ACKNOWLEDGMENT
This work was supported by NIH (R01GM080295 and 2R15GM066279), and a startup fund from University of Massachusetts Lowell.
Footnotes
Notes
The authors declare no competing financial interest.
REFERENCES
- 1.Lis H, Sharon N. Chem. Rev. 1998;98:637–674. doi: 10.1021/cr940413g. [DOI] [PubMed] [Google Scholar]
- 2.Weis WI, Drickamer K. Annu. Rev. Biochem. 1996;65:441–473. doi: 10.1146/annurev.bi.65.070196.002301. [DOI] [PubMed] [Google Scholar]
- 3.Lee YC, Lee RT. Acc. Chem. Res. 1995;28:321–7. [Google Scholar]
- 4.Takeuchi O, Akira S. Cell. 2010;140:805–820. doi: 10.1016/j.cell.2010.01.022. [DOI] [PubMed] [Google Scholar]
- 5.Weis WI, Taylor ME, Drickamer K. Immunol. Rev. 1998;163:19–34. doi: 10.1111/j.1600-065x.1998.tb01185.x. [DOI] [PubMed] [Google Scholar]
- 6.Stahl PD, Alan R, Ezekowitz B. Curr. Opin. Immunol. 1998;10:50–55. doi: 10.1016/s0952-7915(98)80031-9. [DOI] [PubMed] [Google Scholar]
- 7.Swierzko AS, Kilpatrick DC, Cedzynski M. Mol. Immunol. 2013;55:16–21. doi: 10.1016/j.molimm.2012.09.005. [DOI] [PubMed] [Google Scholar]
- 8.Dam TK, Brewer CF. Glycobiology. 2010;20:270–279. doi: 10.1093/glycob/cwp186. [DOI] [PubMed] [Google Scholar]
- 9.Bishop JR, Gagneux P. Glycobiology. 2007;17:23R–34R. doi: 10.1093/glycob/cwm005. [DOI] [PubMed] [Google Scholar]
- 10.Liu Z, Zhang Q, Peng H, Zhang W. Appl. Biochem. Biotechnol. 2012;168:629–637. doi: 10.1007/s12010-012-9805-6. [DOI] [PubMed] [Google Scholar]
- 11.Park S, Gildersleeve JC, Blixt O, Shin I. Chem. Soc. Rev. 2013;42:4310–4326. doi: 10.1039/c2cs35401b. [DOI] [PMC free article] [PubMed] [Google Scholar]
- 12.Hirabayashi J, Yamada M, Kuno A, Tateno H. Chem. Soc. Rev. 2013;42:4443–4458. doi: 10.1039/c3cs35419a. [DOI] [PubMed] [Google Scholar]
- 13.Wang X, Matei E, Deng L, Koharudin L, Gronenborn AM, Ramstrom O, Yan M. Biosens. Bioelectron. 2013;47C:258–264. doi: 10.1016/j.bios.2013.03.014. [DOI] [PMC free article] [PubMed] [Google Scholar]
- 14.Tong Q, Wang X, Wang H, Kubo T, Yan M. Anal. Chem. 2012;84:3049–3052. doi: 10.1021/ac203455b. [DOI] [PMC free article] [PubMed] [Google Scholar]
- 15.Reynolds M, Marradi M, Imberty A, Penades S, Perez S. Chem. Eur. J. 2012;18:4264–4273. doi: 10.1002/chem.201102034. [DOI] [PubMed] [Google Scholar]
- 16.Valero E, Tambalo S, Marzola P, Ortega-Munoz M, Lopez-Jaramillo FJ, Santoyo-Gonzalez F, Lopez J. d. D., Delgado JJ, Calvino JJ, Cuesta R, Dominguez-Vera JM, Galvez N. J. Am. Chem. Soc. 2011;133:4889–4895. doi: 10.1021/ja110014p. [DOI] [PubMed] [Google Scholar]
- 17.Wang X, Ramstrom O, Yan M. Chem. Commun. 2011;47:4261–4263. doi: 10.1039/c0cc05299j. [DOI] [PMC free article] [PubMed] [Google Scholar]
- 18.Han E, Ding L, Lian H, Ju H. Chem. Commun. 2010;46:5446–5448. doi: 10.1039/c001331e. [DOI] [PubMed] [Google Scholar]
- 19.Raman B, Stopfer M, Semancik S. ACS Chem. Neurosci. 2011;2:487–499. doi: 10.1021/cn200027r. [DOI] [PMC free article] [PubMed] [Google Scholar]
- 20.Margulies D, Hamilton AD. Curr. Opin. Chem. Biol. 2010;14:705–712. doi: 10.1016/j.cbpa.2010.07.017. [DOI] [PubMed] [Google Scholar]
- 21.Umali AP, Anslyn EV. Curr. Opin. Chem. Biol. 2010;14:685–692. doi: 10.1016/j.cbpa.2010.07.022. [DOI] [PMC free article] [PubMed] [Google Scholar]
- 22.Anzenbacher P, Jr, Liu Y.-l., Kozelkova ME. Curr. Opin. Chem. Biol. 2010;14:693–704. doi: 10.1016/j.cbpa.2010.08.011. [DOI] [PubMed] [Google Scholar]
- 23.Anslyn EV, Rotello VM. Curr. Opin. Chem. Biol. 2010;14:683–684. doi: 10.1016/j.cbpa.2010.08.024. [DOI] [PubMed] [Google Scholar]
- 24.Miranda OR, Creran B, Rotello VM. Curr. Opin. Chem. Biol. 2010;14:728–736. doi: 10.1016/j.cbpa.2010.07.021. [DOI] [PMC free article] [PubMed] [Google Scholar]
- 25.Albert KJ, Lewis NS, Schauer CL, Sotzing GA, Stitzel SE, Vaid TP, Walt DR. Chem. Rev. 2000;100:2595–2626. doi: 10.1021/cr980102w. [DOI] [PubMed] [Google Scholar]
- 26.Filzmoser P, Serneels S, Maronna R, Van EPJ. Robust multivariate methods in chemometrics. Vol. 3. Elsevier B.V.; 2009. pp. 681–722. [Google Scholar]
- 27.Oliveri P, Casolino MC, Forina M. Adv. Food Nutr. Res. 2010;61:57–117. doi: 10.1016/B978-0-12-374468-5.00002-7. [DOI] [PubMed] [Google Scholar]
- 28.Marini F. Curr. Anal. Chem. 2010;6:72–79. [Google Scholar]
- 29.Fisher RA. Annals of Human Genetics. 1936;7:179–188. [Google Scholar]
- 30.Zhu C, Liu L, Yang Q, Lv F, Wang S. Chem. Rev. 2012;112:4687–4735. doi: 10.1021/cr200263w. [DOI] [PubMed] [Google Scholar]
- 31.Smyth H, Cozzolino D. Chem. Rev. 2012;113:1429–1440. doi: 10.1021/cr300076c. [DOI] [PubMed] [Google Scholar]
- 32.Wang X, Ramstrom O, Yan M. J. Mater. Chem. 2009;19:8944–8949. doi: 10.1039/B917900C. [DOI] [PMC free article] [PubMed] [Google Scholar]
- 33.Daniel M-C, Astruc D. Chem. Rev. 2003;104:293–346. doi: 10.1021/cr030698+. [DOI] [PubMed] [Google Scholar]
- 34.Hu M, Chen J, Li Z-Y, Au L, Hartland GV, Li X, Marquez M, Xia Y. Chem. Soc. Rev. 2006;35:1084–1094. doi: 10.1039/b517615h. [DOI] [PubMed] [Google Scholar]
- 35.Wang X, Ramstr□m O, Yan M. Anal. Chem. 2010;82:9082–9089. doi: 10.1021/ac102114z. [DOI] [PMC free article] [PubMed] [Google Scholar]
- 36.Zhang T, Edwards NY, Bonizzoni M, Anslyn EV. J. Am. Chem. Soc. 2009;131:11976–11984. doi: 10.1021/ja9041675. [DOI] [PubMed] [Google Scholar]
- 37.Wang X, Matei E, Deng L, Ramstrom O, Gronenborn AM, Yan M. Chem. Commun. 2011;47:8620–8622. doi: 10.1039/c1cc12981c. [DOI] [PMC free article] [PubMed] [Google Scholar]
- 38.Wang X, Ramström O, Yan M. Adv. Mater. 2010;22:1946–1953. doi: 10.1002/adma.200903908. [DOI] [PMC free article] [PubMed] [Google Scholar]
- 39.Liu L-H, Dietsch H, Schurtenberger P, Yan M. Bioconjugate Chem. 2009;20:1349–1355. doi: 10.1021/bc900110x. [DOI] [PMC free article] [PubMed] [Google Scholar]
- 40.Jayawardena HSN, Jayawardana KW, Chen X, Yan M. Chem. Commun. 2013;49:3034–3036. doi: 10.1039/c3cc40491a. [DOI] [PMC free article] [PubMed] [Google Scholar]