Abstract
The transition path is the tiny fraction of an equilibrium molecular trajectory when a transition occurs by crossing the free-energy barrier between two states. It is a single-molecule property that contains all the mechanistic information on how a process occurs. As a step toward observing transition paths in protein folding we determined the average transition-path time for a fast- and a slow-folding protein from a photon-by-photon analysis of fluorescence trajectories in single-molecule Förster-resonance-energy-transfer experiments. While the folding rate coefficients differ by a factor of 10,000, the transition-path times differ by less than a factor of 5, showing that a fast-and a slow-folding protein take almost the same time to fold when folding actually happens. A very simple model based on energy landscape theory can explain this result.
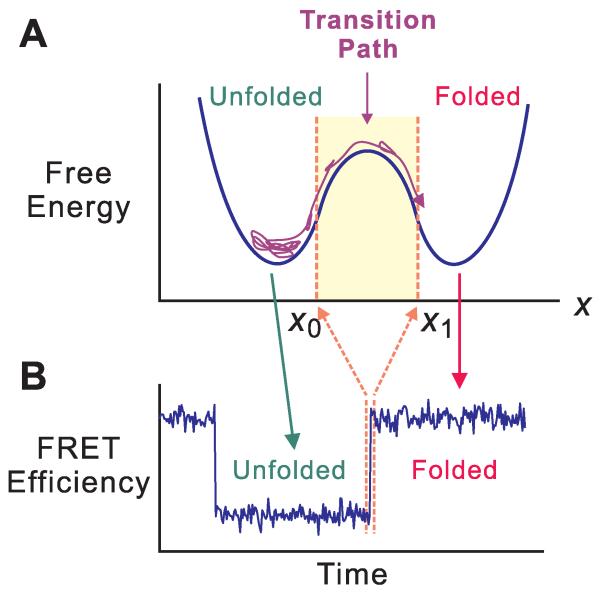
Theory predicts that folding mechanisms are heterogeneous, so that an individual unfolded molecule can self-assemble to form its biologically-active, folded structure via many different sequences of conformational changes (1). The distribution of these folding pathways can now be caluclated from atomistic molecular dynamics simulations (2-6). Information on pathway distributions from experiments must come from measurements on single molecules, since only average properties are obtained in experiments on the large ensemble of molecules in bulk experiments. Fig. 1 shows a schematic of a single-molecule, equilibrium protein folding/unfolding trajectory monitored by Förster resonance energy transfer (FRET) spectroscopy and its relation to the free energy barrier crossing between the folded and unfolded states. The most interesting part of the trajectory is contained in what appears to be an instantaneous jump between the two states, called the transition path, which contains all of the information on the mechanism of folding and unfolding. The first step toward observing transition paths in protein folding, which we report here, is the determination of its average duration (transition-path time) for a fast-folding, all-β protein (39-residue FBP WW domain) shown to be two-state in ensemble studies (7, 8), as well as a markedly-reduced upper bound compared to our previous study for the 56-residue, α/β protein GB1 (9). In contrast to a rate coefficient, which measures the frequency of a transition, the transition-path time is the duration of a successful barrier-crossing event (Fig. 1).
Fig. 1.
Schematic of a folding transition path for a two-state protein. (A) The kinetics of protein folding is described by energy landscape theory as diffusion on a one-dimensional free energy surface with an order parameter (x) as a reaction coordinate (1, 15, 25, 26). The unfolded molecule spends the vast majority of time visiting a large number of conformations in the free energy well of the unfolded state. A transition path is the part of the trajectory that crosses the reaction coordinate x at x0 and reaches x1 on the other side of the barrier without re-crossing x0 (12). The length of this trajectory is the transition-path time. (B) FRET efficiency trajectory. In the typical experiment the donor and acceptor FRET fluorophores are attached to cysteine residues which are closer on average in the folded state (higher FRET efficiency) than in the unfolded state (lower FRET efficiency). The duration of the jump in the FRET efficiency trajectory is the transition-path time. The FRET efficiency monitors reconfiguration of the polypeptide backbone to form the native fold, but is most probably blind to annealing of side chains. Consequently, the transition path measured by FRET is expected to be shorter than the transition path monitored by side chain contacts, for example in a molecular dynamics simulation (6).
The strategy employed in this study is to illuminate dye-labeled protein molecules at very high intensities to increase the number of detected photons per transition path, to discard the majority of photons from the less interesting segments of the trajectories between transitions, and to analyze the transition region with a maximum likelihood method using simple models for the transition path.
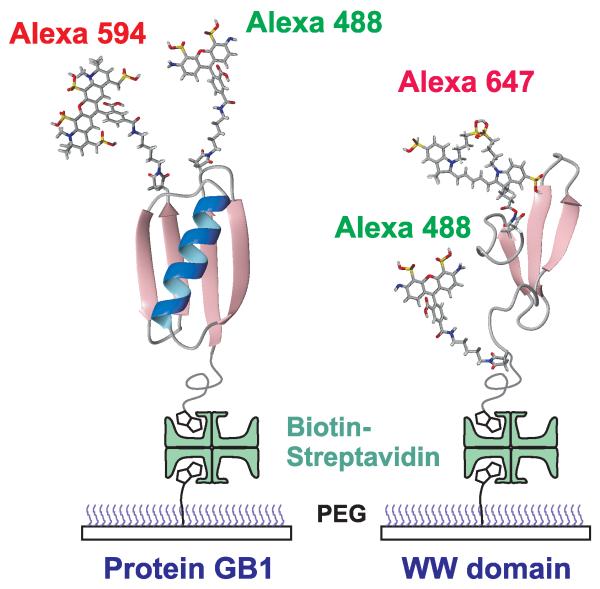
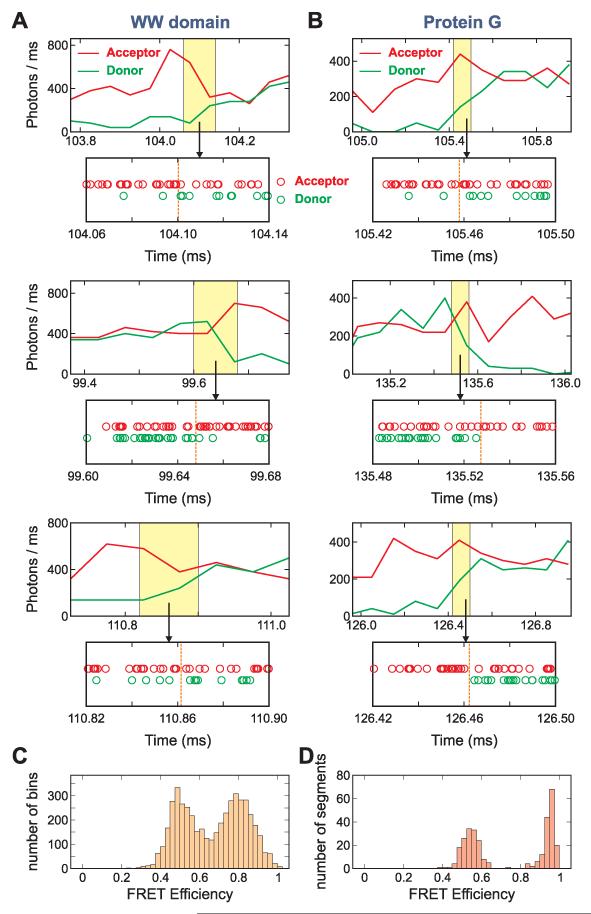
Photon trajectories were measured for immobilized WW domain and protein GB1 molecules with donor and acceptor fluorophores attached to cysteines incorporated in the proteins (Fig. 2). In these trajectories, two properties of each photon were recorded - the color, either donor green or acceptor red, and the absolute time of arrival to within ~ 0.5 ns. As shown in Figs. 3A and 3B, transitions between states are clearly resolved in the binned fluorescence and photon trajectories, and the FRET efficiency distributions (Figs. 3C and 3D) are bimodal, indicating the presence of two states. The photon trajectories were extracted from the region near the transitions and analyzed using the Gopich-Szabo maximum likelihood method (10).
Fig. 2.
Schematic of immobilized folded proteins showing donor (green-emitting) and acceptor (red-emitting) fluorophores. The proteins are attached to a polyethyleneglycol-coated glass surface via a biotin-streptavidin-biotin linkage (11).
Fig. 3.
Representative fluorescence and photon trajectories, and FRET efficiency histograms of WW domain and protein GB1. (A and B) For the fluorescence trajectories - donor (green) and acceptor (red) - photons were collected in 50 μs bins for the WW domain and in 100 μs bins for protein GB1. Measurements were made at 293 K at high illumination intensity in 3 M GdmCl/50% glycerol for the WW domain (A) (20 kW/cm2, ~ 650 photons/ms) and in 4 M urea for protein GB1 (B) (10 kW/cm2, ~ 350 photons/ms). Strings of arrival times of donor and acceptor photons (photon trajectories) in the transition region (the 80 μs yellow shaded regions) are displayed below the binned fluorescence trajectories. Dashed vertical lines in the photon trajectories indicate the most probable transition interval found by the Viterbi algorithm (11). The absolute times refer to the start of data collection, which began at ~ 100 ms before the laser was turned on. (C and D) FRET efficiency histograms. The mean FRET efficiencies for the WW domain were calculated for each of 50 μs bins for the trajectories with the mean photon count rate > 400 ms−1 (C) and for folded and unfolded segments of protein GB1 containing ~ 2500 photons (D).
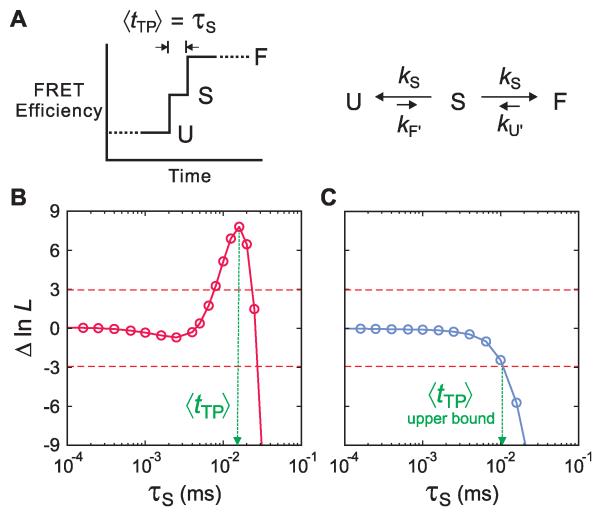
For a given model, the Gopich-Szabo method calculates the parameters of a kinetic model that can most accurately reproduce the photon trajectories (Fig 3). We adopt a one-step model for the transition path, which may be viewed as the simplest discrete representation of how the FRET efficiency changes along the path. This picture can be represented in a kinetic model for a two-state system with a finite transition path by introducing a third virtual state, S, for which the FRET efficiency is midway between the folded and unfolded states (ES = (EF + EU)/2). In this model the lifetime of S (τS) corresponds to the average transition-path time, 〈tTP〉 (Fig. 4A). S has the property of a transition state, since the rate coefficients from S to F and S to U (kS) are the same and therefore the p-fold = ½.
Fig. 4.
Determination of average transition-path times in a kinetic model. (A) Schematic of a FRET efficiency trajectory using a one-step model to describe the transition path from unfolded (U) to folded (F) states for a protein exhibiting two-state kinetics and thermodynamics. The average transition-path time, 〈tTP〉, is equal to the lifetime of a virtual intermediate state S (τS = (2kS)−1 ). (B and C) The difference of the log likelihood, ΔlnL = lnL(τS) − lnL(0), between the two-state model with a finite transition-path time and a two-state model with an instantaneous transition-path time is plotted as a function of τS for the WW domain in 3 M GdmCl/50% glycerol (B) and protein GB1 in 4 M urea (C). The horizontal dashed line at ΔlnL = +3 represents the 95% confidence limit for the significance of the peak in B and the intersection of the likelihood function with the horizontal dashed line at ΔlnL = −3 in C yields the 95% confidence limit for the upper bound of τS.
The likelihood function for the jth photon trajectory is (10):
| (1) |
Here, K is the rate matrix (Eq. S6 (11)) containing the 3 rate coefficients (kF’, kU’, kS), N is the number of photons in the jth trajectory, ci is the color of the ith photon (donor or acceptor), and τi is a time interval between the ith and (i-1)th photons as shown in Fig. S4B (11). The photon color matrix F depends on the color of a photon as F(acceptor) = E and F(donor) = I − E, where E is a diagonal matrix with elements that are FRET efficiencies of the 3 states (F, S and U). n is a diagonal matrix with elements that are photon count rates of the three states. vini and vfin are vectors that describe the state (folded or unfolded) at the beginning and the end of the trajectory. Practically, log-likelihood functions were calculated and the total log likelihood function of all trajectories were calculated by summing the log-likelihood functions () of individual trajectories that contain a transition between folded and unfolded states. In the likelihood function L, τS is the only variable parameter (11).
The difference of the log-likelihood functions, ΔlnL, = lnL(τ) − lnL(0), as a function of τS is plotted in Fig. 4B for the WW domain. This function was calculated from 527 transitions between the folded and unfolded states. In this plot, the likelihood at τS = 0, is the value for a two-state model where every transition between folded and unfolded states is instantaneous, i.e. it occurs faster than the shortest photon interval. Therefore, the plot displays how much better (or worse) a two-state model with a finite transition-path time describes the photon trajectories than a two-state model with an instantaneous transition. There is a highly significant peak in the likelihood function in Fig. 4B at 16 (±3) μs. (The error is the standard deviation obtained from the curvature of the peak.) Simulations of photon trajectories show that if ΔlnL at the peak is higher than a certain confidence level, the value of τS at the peak corresponds to the assumed τS and does not arise from statistical fluctuations (Fig. S6 (11)). We use a confidence level that satisfies a condition L(τS)/(L(τS) + L(0)) = 0.95, which assures 95% confidence in the significance of the maximum and corresponds to Δln L ≈ 3 (the dashed horizontal lines in Fig. 4). The value of 16 μs at Δln L = 7.8 is therefore a well-determined quantity, and corresponds in our model (Fig. 4A) to the average transition-path time, 〈tTP〉. Fig S5 (11) shows that 〈tTP〉 is the same for folding and unfolding transitions, which is consistent with the requirement of microscopic reversibility that 〈tTP〉 for a barrier crossing be the same in both directions (12).
To extrapolate the value of 〈tTP〉 to the viscosity in the absence of glycerol, we determined the rate coefficients at different viscosities (see Table S1 (11)). Using a linear free energy relation to account for the change in stability due to both the glycerol and GdmCl, we find that the rate coefficients for folding and unfolding depend inversely on the first power of the viscosity (11), so 〈tTP〉 should scale the same way (see Eqs. 2 and 3 below). Since the viscosity of 3 M GdmCl/50% glycerol solution is found to be 10 times higher than that of 2 M GdmCl (11), our best estimate of 〈tTP〉 in the absence of a viscogen at 293 K is ~ 2 μs.
We have employed the simplest possible model for determining 〈tTP〉. However, more realistic models that depict a more gradual change in the FRET efficiency along a transition path, with 2 and 3 steps in the FRET efficiency in the transition path between states instead of just one (Fig. 4A), yield very similar values for 〈tTP〉 (see Fig. S9 (11)). We also found that the value of 〈tTP〉 is not sensitive to the choice of the FRET efficiency for S as long as the value is between the two FRET efficiencies of the folded and unfolded states (0.6 ≤ ES ≤ 0.7, Fig. S7 (11)).
For proteins with very low free energy barriers, it may be possible to estimate 〈tTP〉 from ensemble measurements. Gruebele and coworkers have studied the kinetics of the ultrafast-folding, 35-residue FiP35 WW domain, which has a very similar structure to our WW domain (FBP), but a non-homologous amino-acid sequence (13). Prior to the ~ 10 μs folding/unfolding relaxation at the melting temperature of ~ 350 K, a ~ 1.5 μs relaxation was observed, which was called a “molecular phase” and attributed to a change in the small population of molecules at the top of a low free energy barrier in response to the temperature jump (importantly, no molecular phase has been observed for FBP WW domain, presumably because it is a slower folder due to a higher barrier, and there is therefore no detectable amplitude from the change in the barrier top population (7)). In this interpretation, the ~ 1.5 μs relaxation corresponds to the lifetime, τS, of our kinetic model for the transition path (Fig. 4).
Shaw and coworkers have simulated equilibrium trajectories of the FiP35 WW domain using all-atom molecular dynamics calculations (4). They found 〈tTP〉 to be 0.5 (±0.1) μs 360 K using the TIP3P explicit water model (6). After rescaling for the difference in viscosity compared to real water, the simulated 〈tTP〉 becomes ~1.5 μs (14). Although the sequences for the 2 WW domains are different, the finding of similar values for 〈tTP〉 from the simulations and both ensemble and single molecule experiments provides support for the accuracy of the simulations, Gruebele’s interpretation of the molecular phase, and our interpretation of the single-molecule photon trajectories.
The folding time of protein GB1 in 4 M urea is ~ 1 s. This time is far too long to observe folding transitions in trajectories simulated by atomistic equilibrium molecular dynamics, making even an upper bound for the transition-path time an interesting quantity. In previous work, we were able to determine an upper bound of ~ 200 μs, based on an analysis of individual trajectories. The photon count rate in those experiments was only 50 ms−1, and the average time before photo-bleaching was ~ 100 ms. In the current experiments the much higher count rate of 350 ms−1 from the increased illumination intensity, together with the collective analysis using the maximum likelihood method, has allowed us to determine a much more accurate upper bound.
The penalty for the higher photon count rate is that the lifetime of the trajectories is shortened to ~ 10 ms by the more intense illumination, and transitions, albeit clearly resolved (Fig. 3B), are only observed in a very small fraction of the trajectories. Measurement at 4 M urea (with no added glycerol) of trajectories for ~ 47,000 molecules yielded just 114 transitions.
These 114 transitions were analyzed using the same model as for the WW domain. No peak is observed in the Δln L vs τS plot (Fig. 4C), so 〈tTP〉 is too short to measure. Nevertheless the analysis permits a determination of an upper bound for 〈tTP〉. By analogy to the significance of the peak for the WW domain, we can set a confidence level for the answer to the question: how long can 〈tTP〉 be before it becomes inconsistent with the data? The 95% confidence level that τS in a two-state model with a finite transition path is less consistent with the photon trajectories than a two-state model with an instantaneous transition path is given by its value at Δln L ≈ −3. In other words, 〈tTP〉 cannot be longer than τS at Δln L = −3, and is therefore an upper bound on 〈tTP〉. As shown in Fig. 4C, this upper bound is ~ 10 μs.
The major result of our experiments is that while the folding rate coefficients for the WW domain and protein GB1 differ by 4 orders of magnitude, 104 s−1 and 1 s−1, the transition-path times differ by less than 5-fold (~ 2 μs and <10 μs), showing that a fast- and a slow-folding protein take almost the same time to fold when folding actually happens.
Interestingly, a very simple model by A. Szabo, based on describing the kinetics of folding for a two-state system as diffusion over a barrier on a one-dimensional free energy surface as in the energy landscape theory of Wolynes, Onuchic and coworkers (1, 15), can explain this result. According to Kramers theory for such a barrier crossing (Fig. 1A), the folding time (τF = 1/kF) is given by:
| (2) |
where D* is the diffusion coefficient at the barrier top, ω2 is the curvature of the unfolded well (near x0 in Fig. 1A), -(ω*)2 is the curvature at the barrier top, β = 1/kBT, and ΔGB* is the height of the folding free-energy barrier (16-20). For ω = ω* 〈tTP〉 is approximately given by (9, 12):
| (3) |
The model predicts that 〈tTP〉 is insensitive to the barrier height and that fast and slow-folding proteins will have similar transition-path times as long as there are only small differences in the curvatures and the diffusion coefficients (i.e. small difference in τ0). The diffusion coefficient depends on the roughness of the underlying energy landscape and could therefore differ substantially among proteins (21-23). The best current estimate for τ0 of fast-folding proteins is ~ 1 μs (24), which predicts a ratio of 〈tTP〉 for protein GB1 and the WW domain of 1.4, compared to the experimental ratio of < 5, assuming the same τ0 for the two proteins. This ratio varies from 1.3 to 1.8 for τ0 between 0.1 μs to 10 μs.
Our determination of an average transition-path time is a first step towards the goal of obtaining information on the distribution of folding pathways from measurements of inter-dye distance versus time trajectories during transition paths. However, the result of this first step by itself has turned out to be extremely interesting. Folding involves a complex and intricate rearrangement of a polypeptide chain to form a unique structure, yet the time for this non-trivial self-assembly process is almost the same for two proteins with different topologies and vastly different folding rates.
Supplementary Material
Acknowedgements
We thank Irina Gopich, Attila Szabo and Gerhard Hummer for numerous helpful discussions, and Annie Aniana for technical assistance in the expression and purification of proteins. This work was supported by the Intramural Research Program of the NIDDK, NIH.
References
- 1.Bryngelson JD, Onuchic JN, Socci ND, Wolynes PG. Proteins-Struct. Funct. Gen. 1995;21:167. doi: 10.1002/prot.340210302. [DOI] [PubMed] [Google Scholar]
- 2.Noe F, Schutte C, Vanden-Eijnden E, Reich L, Weikl TR. Proc. Natl. Acad. Sci. USA. 2009;106:19011. doi: 10.1073/pnas.0905466106. [DOI] [PMC free article] [PubMed] [Google Scholar]
- 3.Bowman GR, Pande VS. Proc. Natl. Acad. Sci. USA. 2010;107:10890. doi: 10.1073/pnas.1003962107. [DOI] [PMC free article] [PubMed] [Google Scholar]
- 4.Shaw DE, et al. Science. 2010;330:341. doi: 10.1126/science.1187409. [DOI] [PubMed] [Google Scholar]
- 5.Piana S, Lindorff-Larsen K, Shaw DE. Biophys. J. 2011;100:L47. doi: 10.1016/j.bpj.2011.03.051. [DOI] [PMC free article] [PubMed] [Google Scholar]
- 6.Lindorff-Larsen K, Piana S, Dror RO, Shaw DE. Science. 334:517. doi: 10.1126/science.1208351. [DOI] [PubMed] [Google Scholar]
- 7.Nguyen H, Jager M, Moretto A, Gruebele M, Kelly JW. Proc. Natl. Acad. Sci. USA. 2003;100:3948. doi: 10.1073/pnas.0538054100. [DOI] [PMC free article] [PubMed] [Google Scholar]
- 8.Petrovich M, Jonsson AL, Ferguson N, Daggett V, Fersht AR. J. Mol. Biol. 2006;360:865. doi: 10.1016/j.jmb.2006.05.050. [DOI] [PubMed] [Google Scholar]
- 9.Chung HS, Louis JM, Eaton WA. Proc. Natl. Acad. Sci. USA. 2009;106:11837. doi: 10.1073/pnas.0901178106. [DOI] [PMC free article] [PubMed] [Google Scholar]
- 10.Gopich IV, Szabo A. J. Phys. Chem. B. 2009;113:10965. doi: 10.1021/jp903671p. [DOI] [PMC free article] [PubMed] [Google Scholar]
- 11.SI, Information on materials and methods is available as supporting online material on Science Online.
- 12.Hummer G. J. Chem. Phys. 2004;120:516. doi: 10.1063/1.1630572. [DOI] [PubMed] [Google Scholar]
- 13.Liu F, Nakaema M, Gruebele M. J. Chem. Phys. 2009;131:195101. doi: 10.1063/1.3262489. [DOI] [PubMed] [Google Scholar]
- 14.Yeh IC, Hummer G. J. Phys. Chem. B. 2004;108:15873. [Google Scholar]
- 15.Socci ND, Onuchic JN, Wolynes PG. J. Chem. Phys. 1996;104:5860. [Google Scholar]
- 16.In the case of protein GB1 there is the possibility of a sparsely populated intermediate between the folded and unfolded states (17-20). In this study we have implicitly defined the transition-path time for both the WW domain and protein GB1 in terms of just the two deep minima of the folded and unfolded states.
- 17.Park SH, Shastry MCR, Roder H. Nat. Struct. Biol. 1999;6:943. doi: 10.1038/13311. [DOI] [PubMed] [Google Scholar]
- 18.McCallister EL, Alm E, Baker D. Nat. Struct. Biol. 2000;7:669. doi: 10.1038/77971. [DOI] [PubMed] [Google Scholar]
- 19.Morrone A, et al. Biophys. J. 2011;101:2053. doi: 10.1016/j.bpj.2011.09.013. [DOI] [PMC free article] [PubMed] [Google Scholar]
- 20.Krantz BA, Mayne L, Rumbley J, Englander SW, Sosnick TR. J. Mol. Biol. 2002;324:359. doi: 10.1016/s0022-2836(02)01029-x. [DOI] [PubMed] [Google Scholar]
- 21.Clarke and coworkers (22) have found, for example, domains with similar structures and stability that have folding rates which differ by ~3,000-fold. The slower-folding domains show very little dependence on solvent viscosity, suggesting a large internal friction and therefore a much smaller D* (22, 23).
- 22.Wensley BG, et al. Nature. 2010;463:685. doi: 10.1038/nature08743. [DOI] [PMC free article] [PubMed] [Google Scholar]
- 23.Cellmer T, Henry ER, Hofrichter J, Eaton WA. Proc. Natl. Acad. Sci. USA. 2008;105:18320. doi: 10.1073/pnas.0806154105. [DOI] [PMC free article] [PubMed] [Google Scholar]
- 24.Kubelka J, Hofrichter J, Eaton WA. Curr. Opin. Struct. Biol. 2004;14:76. doi: 10.1016/j.sbi.2004.01.013. [DOI] [PubMed] [Google Scholar]
- 25.Best RB, Hummer G. Proc. Natl. Acad. Sci. U.S.A. 2005;102:6732. doi: 10.1073/pnas.0408098102. [DOI] [PMC free article] [PubMed] [Google Scholar]
- 26.Kubelka J, Henry ER, Cellmer T, Hofrichter J, Eaton WA. Proc. Natl. Acad. Sci. USA. 2008;105:18655. doi: 10.1073/pnas.0808600105. [DOI] [PMC free article] [PubMed] [Google Scholar]
Associated Data
This section collects any data citations, data availability statements, or supplementary materials included in this article.


