Abstract
To obtain insight into the mechanisms that contribute to the pathogenesis of Plasmodium infections, we developed an improved rodent model that mimics human malaria closely by inducing cerebral malaria (CM) through sporozoite infection. We used this model to carry out a detailed study on isolated T cells recruited from the brains of mice during the development of CM. We compared several aspects of the immune response related to the experimental model of Plasmodium berghei ANKA infection induced by sporozoites in C57BL/6 mice and those related to a blood-stage infection. Our data show that in both models, oligoclonal TCRVβ4+, TCRVβ6+, TCRVβ8.1+, and TCRVβ11+ major histocompatibility complex class I-restricted CD8 T cells were present in the brains of CM+ mice. These CD8+ T cells display an activated phenotype, do not undergo apoptosis, secrete gamma interferon or tumor necrosis factor alpha, and are associated with the development of the neurological syndrome.
Cerebral malaria (CM) continues to contribute to the deaths of more than two million people every year in areas of endemic infection (World Health Organization, 1998, http://www.who.int/inf-fs/en/fact094.html). Although the physiopathology of Plasmodium infection has been extensively investigated, we still know relatively little about the precise mechanisms that contribute to its pathogenesis, in particular during CM. Two main factors have been implicated: (i) the sequestration of Plasmodium falciparum-parasitized red blood cells (8, 27, 35, 37) and leukocytes (33, 36, 38) within brain vessels and (ii) the involvement of T cells activated by Plasmodium antigens (29, 41). These two main mechanisms act together under the control of mediators of the inflammatory responses released during the infection such as tumor necrosis factor alpha (TNF-α) and gamma interferon (IFN-γ) (13, 14, 15, 21, 22, 24, 25). The up regulation of adhesion molecules such as CD36, intercellular cell adhesion molecule 1 (ICAM-1), and thrombospondin, which lead to the adherence of infected erythrocytes and leukocytes to endothelial cells of the brain microvessels, is a common feature of the physiological events that occur during CM (4, 7, 15, 39).
Host CD4+ and CD8+ T cells are involved in the development of fatal murine CM, as demonstrated by depletion of these cells with anti-CD4 or anti-CD8 monoclonal antibodies (MAb) and by using mice that are genetically deficient in the expression of either CD4 or CD8 (2, 5, 12, 17, 18, 30, 42). This suggests that the immunopathological process that occurs during CM involves both CD4+ and CD8+ T-cell subsets. However, the way in which CD4+ and CD8+ cells contribute to the development of pathogenicity during fatal CM remains to be elucidated.
The purpose of this study, therefore, was to develop an alternative model for CM, using sporozoites of P. berghei ANKA strain clone 1. 49L to initiate the infection in order to compare the pathogenic T-cell responses that occur during sporozoite- and blood-stage-induced infection in mice with CM. Such responses were followed up by examining the peripheral blood, lymph nodes, spleen, and brain at the time when neurological symptoms were apparent.
We demonstrated that the development of CM in sporozoite- or blood-stage parasite-induced infection is in both cases associated with the preferential recruitment of CD8+ T-cell subsets within the brain. These subsets were further compared by identifying their phenotype, their TCRVβ chain repertoire, the intracellular cytokine pattern, and the major histocompatibility complex (MHC) class I molecules involved in the restriction of the response. Their functional association with the development of CM was demonstrated in vivo by using different strains of mice with a CD8 deficiency and by specific T-cell depletion with MAb.
MATERIALS AND METHODS
Mice.
C57BL/6J specific-pathogen-free mice, 8 to 10 weeks old, were purchased from Elevage JANVIER (Le Genest St-Isle, France). CD8−/− (25), β2m−/− (26), H-2Kb−/−, H-2Db−/− and H-2KDb−/− (27) C57BL/6 mice were maintained in animal facilities at the Institut Pasteur, Paris, under specific-pathogen-free conditions.
Parasites, inoculation and CM clinical features.
Red blood cells infected with P. berghei ANKA clone 1.49L were provided by D. Walliker (Institute of Genetics, Edinburgh, United Kingdom) and maintained in C57BL/6J mice. This clone was selected for its capacity to induce CM (40). The parasite was conserved as stabilates of 107 parasitized C57BL/6J red blood cells (PRBC) stored under liquid nitrogen in Alsever's solution containing 10% glycerol. For blood-stage infections, mice were injected intraperitoneally with 106 PRBC. For sporozoite-induced infection, parasites were obtained from infected salivary glands of Anopheles stephensi mosquitoes 16 to 21 days after the ingestion of an infected blood meal. After aseptic dissection, salivary glands were homogenized in a glass grinder and diluted in sterile phosphate-buffered saline. Mice were infected by intravenous injection of 1 × 10³, 5 × 10³, 1 × 10⁴, 5 × 10⁴, and 1 × 10⁵ sporozoites.
CM+ mice first displayed clinical signs between 6 and 8 days postinfection. These signs include ataxia, paralysis (mono-, hemi-, para-, or tetraplegia), deviation of the head, convulsions, and coma followed by death. In the C57BL/6 strain, the neurological signs developed at a low level of parasitaemia (less than 15%).
Parasitaemia in the different groups of infected mice was determined on Giemsa-stained thin blood smears every days and is expressed as the percentage of infected red blood cells (PRBC).
Isolation of lymphoid cells.
Peripheral blood was collected on heparin by retro-orbital puncture. Lymphocytes (peripheral blood lymphocytes [PBL]) were then isolated on a Ficoll gradient (Pharmacia, Saclay, France). Lymphoid cells from the spleens and lymph nodes (LN) of uninfected control and infected C57BL/6 mice developing CM were isolated after these organs were homogenized in saline buffer containing 3% feetal calf serum (FCS). The brain lymphoid cells were obtained after tissue homogenization in RPMI 1640 medium and centrifugation at 500 × g for 20 min in 35% (vol/vol) Percoll (Pharmacia).
The brains of CM+ C57BL/6 mice were stained with phycoerythrin-conjugated anti-CD8 MAb and pooled. CD8+ T cells were purified from the pooled brains by use of a MoFlo cell sorter (Cytomation, Fort Collins, Colo., and Pharmingen, San Diego, Calif.). Dead cells were excluded using propidium iodide (PI) at a final concentration of 1 μg/ml (Sigma, Saint Quentin Fallavier, France).
Antibodies and FACS analysis.
Anti-mouse CD3ɛ (145-2C11) fluorescein isothiocyanate-conjugated MAb, biotinylated anti-CD25 (PC61), anti-Vβ4 (KT4), anti-Vβ6 (RR4-7), anti-Vβ8.1 + 8.2 (KJ16), and anti-Vβ11 (RR-3-15) subpopulations were prepared in our laboratory. Phycoerythrin-conjugated anti-CD4 (H129.19) was obtained from Boehringer Mannheim (Meylan, France). Anti-CD8α Quantum Red (53-6.7) was obtained from Sigma. Biotinylated MAb directed against activation markers such as CD69 (H1.2F3), CD44 (IM7), CD62L (MEL-14), and adhesion molecules LFA-1 (M17/4) and ICAM-1 (3E2), allophycocyanin-conjugated anti-cytokine antibodies, anti-IFN-γ (XMG1.2), anti-TNF-α (MP6-XT22), anti-interleukin-4 (IL-4) (11B11) and anti-IL-10 (JES5-16E3) were purchased from BD-Pharmingen.
Fluorescence-activated cell sorter (FACS) analysis was carried out using a FACScan cytofluorometer (Becton Dickinson, Grenoble, France), and data were processed with CellQuest software. Lymphocytes were carefully gated by light scattering (forward scattering and side scattering). Ten thousand events were acquired and recorded per sample. The percentage of positive fluorescent cells was determined by integrating profiles on the basis of the numbers of viable lymphocytes.
Intracellular staining of cytokines.
Lymphocytes isolated from the brain were incubated at 37°C for 90 min with phorbol myristate acetate (50 ng/ml), ionomycin (500 ng/ml), and brefeldin A (10 ng/ml) (Sigma) in RPMI 1640 medium containing 10% FCS under in a 5% CO2 atmosphere. The negative control consisted of splenocytes from naive C57BL/6 mice, which were treated in the same manner as the lymphocytes. After incubation with the anti-mouse CD8 phycoerythrin-conjugated MAb, cells were washed in saline buffer containing 3% FCS and fixed with 4% paraformaldehyde in saline buffer at room temperature for 1 h in the dark. The cells were then permeabilized using the Perm/Wash buffer. They were then incubated for 1 h with the APC-conjugated anti-cytokine antibodies: anti-IFN-γ (XMG1.2), anti-TNF-α (MP6-XT22), anti-IL-4 (11B11), and anti-IL-10 (JES5-16E3) that had been diluted in saline buffer containing 3% FCS. Finally, the intracellular cytokines were stained.
CD4 and CD8 T-lymphocyte apoptosis versus necrosis assessment.
Apoptotic cells were detected by analyzing the expression of phosphatidylserine on the outer leaflet of the membrane by cytofluorometry using annexin-V Fluo (Roche, Meylan, France) and PI (Sigma) PI was used to distinguish apoptotic cells (annexin V+ PI−) from necrotic cells (annexin V+ PI+).
CDR3 spectratyping analysis of the CD8 T-cell repertoire.
Total RNA was extracted from sorted CD8+ T cells by use of the Tri Reagent kit (Molecular Research Center, Cincinnati, Ohio). One microlitre of 20-mg/ml glycogen (Roche) was used to ensure the optimal precipitation of RNA and pellet visualization. Single-stranded cDNA was synthesized with the avian myeloblastosis virus reverse transcriptase (Roche) synthesis kit. CDR3 spectratyping was done using the immunoscope method as described previously (28). The primer sequences used were as described previously (26), except for BV8.3 (TGCTGGCAACCTTCAAATAGGA) and BV13 (AGGCCTAAAGGAACTAACTCCAC). Twenty-one PCR tubes were set up per sample. Aliquots (2 μl) of the PCR products were then used in a runoff primer extension reaction in a 10-μl final volume containing 0.2 U of Taq polymerase, 0.2 mM each deoxynucleoside triphosphate, 3 mM MgCl2, and 0.1 μM fluorophore-labeled BC5-Fam primer (Fam-CTTGGGTGGAGTCACATTTCTC). Extension was carried out in five cycles. Finally, 10 μl of 20 mM formamide-EDTA was added. After 10 min of denaturation at 80°C, samples were loaded onto a 6% acrylamide sequencing gel on an automatic sequencer (Applied Biosystems model 373). The GS-350 (Applied Biosystems) nucleotide length marker was coloaded in some wells. Products were separated on the basis of their nucleotide length, forming a profile of peaks for each primer combination, separated by 3 nucleotides as expected for in-frame transcripts. The raw data were analyzed with the Immunoscope software using the ISEApeaks software package utilities (6, 6a).
Depletion studies. (i)CD8+ T-cell depletion.
Mice were injected intraperitoneally with 100 μg of purified immunoglobulin G anti-mouse CD8 β chain (H35.17.2) every 4 days starting 9 days before infection. Depletion was confirmed by PBL staining with a Quantum Red-labeled anti-CD8α MAb (53-6.7) followed by FACS analysis.
(ii) TCRVβ+-cell depletion.
TCRVβ4, TCRVβ6, TCRVβ11, and TCRVβ8.1,2-positive T cells were depleted in vivo by intraperitoneal injection of 50 μg of anti-TCRVβ4 (KT4), anti-TCRVβ6 (RR4-7), anti-TCRVβ11 (RR-3-15), and 100 μg of anti TCRVβ8.1,2 (KJ16), respectively. Depletions were initiated 3 days before infection and were repeated every 3 days thereafter until the death of the animals; they were confirmed 24 h after the first injection of antibodies by FACS using the same MAb and F23.2 (Vβ8.2) as were used for Vβ8-positive T cells.
Statistical analysis.
Parasitemia is expressed as mean ± standard deviation for different mice in several experiments. Results were compared with Statview 4.5 software. Survival curves were compared after Kaplan-Meyer analysis with the Logrank (Mantel-Cox) test. Student's t test and the analysis of variance test were considered significant for P < 0.05.
RESULTS
Comparison of the clinical and parasitological status of CM induced by sporozoite or blood-stage P. berghei ANKA in C57BL/6 mice.
The manifestations of CM characterized by a neurological syndrome, including clinical signs such as ataxia, paralysis, deviation of the head, convulsions, and coma followed by death, were compared in C57BL/6 mice infected with different doses of sporozoites (1 × 10³, 5 × 10³, 1 × 10⁴, 5 × 10⁴, and 1 × 10⁵) of P. berghei ANKA clone 1.49L and mice infected with blood stages (106 PRBC) from the same parasite clone. The percentage of mice that developed CM was dependent on the number of sporozoites used to initiate infection (Fig. 1A). Unexpectedly, the clinical signs did not appear significantly later in mice infected with sporozoites than in PRBC-infected CM+ mice (P = 0.0671, χ2 = 8.7, and degrees of freedom = 4). The neurological signs appeared at roughly the same time in sporozoite- and PRBC-infected mice, 6 to 9 days after infection (P = 0.1642, χ2 = 7.858, and degrees of freedom = 5).
FIG. 1.
Comparison of CM in sporozoite- and PRBC-infected mice. (A) Survival curves for groups of five mice infected with different doses of sporozoites (SPZ) (1 × 10³, 5 × 10³, 1 × 10⁴, 5 × 10⁴, and 105) and a group of eight mice infected with 106 PRBC. (B) Parasitemia was estimated during the course of infection (days 3, 5, and 6) for all mice in the different groups by using Giemsa-stained, thick blood smears. (C) Student's t test was used to compare the levels of parasitemia on the day of CM manifestation for 14 CM+ and 6 CM− mice infected with 50,000 sporozoites (SPZ) and for 13 CM+ and 4 CM− mice infected with 106 PRBC.
In addition, no significant differences in the levels of blood parasites were observed in the different groups of mice infected with sporozoites between days 3 and 6 postinfection. However, PRBC-infected mice displayed a higher level of parasitemia (P = 0.028 to <0.0001) (Fig. 1B). Finally, on the day on which CM symptoms first appeared, parasitemia was significantly higher (P < 0.0001) in mice infected with 1 × 10⁶ PRBC (16.54% ± 7.85%) than in mice infected with 5 × 10⁴ sporozoites (4.50% ± 1.34%) (Fig. 1C). The percent parasitemia did not significantly differ between CM+ and CM− mice when infected with sporozoites (P = 0.18) or when infected with PRBC (P = 0.33).
Analysis of T-cell responses in sporozoite- and blood-stage-induced CM.
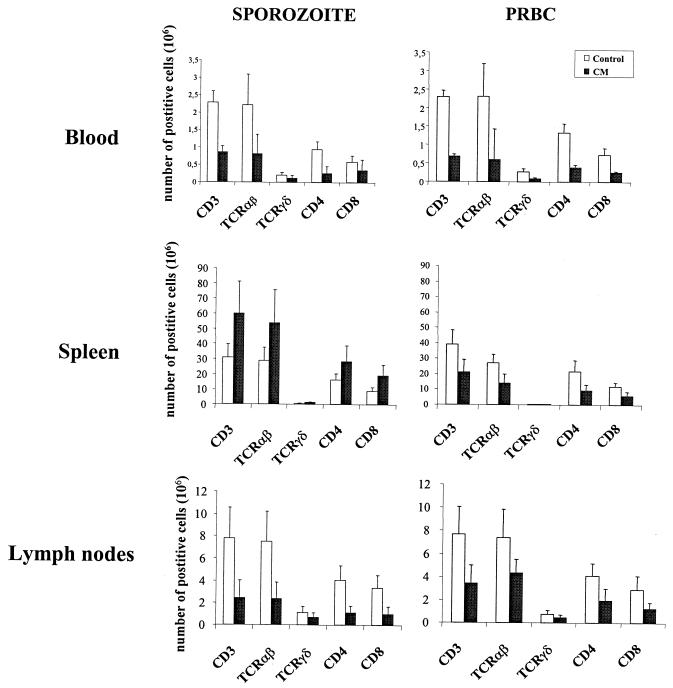
We used cytofluorometry to analyze the T-cell distribution and phenotypes in PBL, spleen, and LN isolated on day 7 from mice infected with 1 × 10⁶ PRBC or 5 × 10⁴ sporozoites and exhibiting clinical signs of CM. The total number of T lymphocytes was smaller in PBL, spleen, and LN from PRBC-infected mice (p = 0.0001, 0.0077, and 0.0097, respectively) and in PBL and LN from the sporozoite-infected group (P = 0.0014 and 0.0001, respectively) than in the uninfected control mice (Fig. 2). The decrease in the T-cell number during CM affected both the αβ and γδ lineages and the CD4+ and CD8+ subpopulations. In contrast, sporozoite infection induced a significant increase in the total number of both CD4+ and CD8+ αβT cells (1.76 × 10⁶ and 2.14 × 10⁶, respectively) in the spleen (P = 0.0013).
FIG. 2.
T-cell counts during CM in PBL, spleen, and LN. Total numbers of TCRαβ+, TCRγδ+, CD4+, and CD8+ among CD3+ cells are expressed per milliliter of blood for PBL and as the total number of cells for spleen and pooled peripheral LN taken when mice exhibited clinical signs of CM. Results for four CM+ PRBC-infected mice and eight CM+ sporozoite-infected mice are shown. For the two types of infection, eight uninfected mice were used as a control. Bar charts show the mean numbers of cells and standard deviation for two separate experiments.
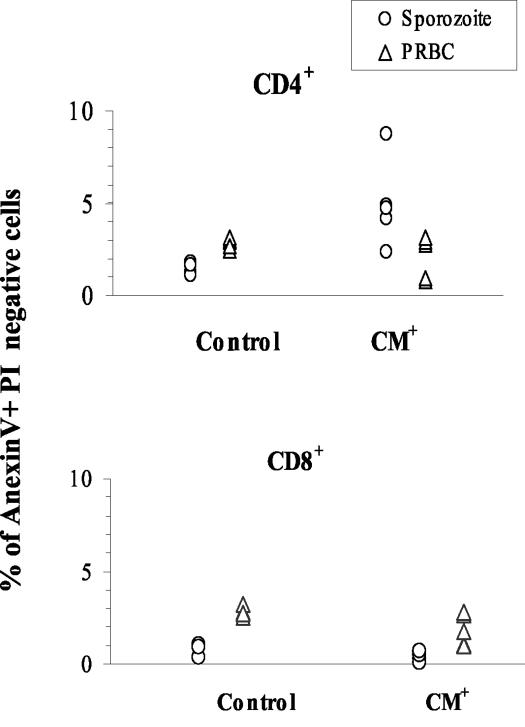
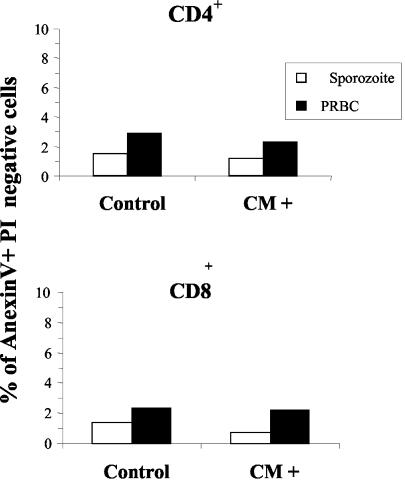
To further our understanding of the mechanisms leading to the disappearance of T cells in infected mice, we monitored T cells for the presence of an apoptosis signature in CM+ mice. More CD4+ T cells (4.4% ± 1.9%) from the PBL of CM+ mice infected with sporozoites were annexin V+ and PI− than were those from uninfected controls, indicating that very few CD4+ T cells from sporozoite-infected mice (P = 0.018) undergo apoptosis (Fig. 3). The CD8+ cell subset was not affected (Fig. 3). Apoptosis does not appear to be a major cause of T-cell disappearance in mice developing CM.
FIG. 3.
Apoptosis occurs in peripheral CD4+ but not in CD8+ T-cell subpopulations. The percentage of early apoptotic cells (annexin V+ PI−) was determined among CD4+ and CD8+ T-cell subpopulations in the blood of uninfected controls (n = 5) and in mice infected with either sporozoites or PRBC and exhibiting clinical signs of CM (n = 5).
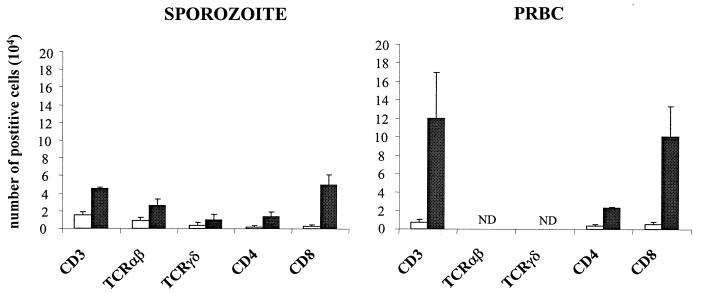
The phenotype of T cells retained within the brain of mice infected with PRBC or sporozoites and manifesting acute signs of CM was determined by FACS. CM was associated with a high level of infiltration of CD4+ and CD8+ αβ T-cell subsets (Fig. 4). However, a comparison of the numbers of the two lymphocyte subpopulations showed that CD8+ T cells were predominant in the brains of both sporozoite-infected (CD8/CD4 ratio, 3.6) and PRBC-infected (CD8/CD4 ratio, 5.5) CM+ mice (Fig. 4).
FIG. 4.
Selective accumulation of CD8+ T cells in the brain during CM. The analysis was done twice with T lymphocytes isolated from the pooled brains of nine control uninfected mice, three CM+ PRBC-infected mice, and five CM+ sporozoite-infected mice. □, control; ▪, CM.
Comparison of the CD8 T cells retained in the brain of sporozoites infected CM mice with those induced by blood stages.
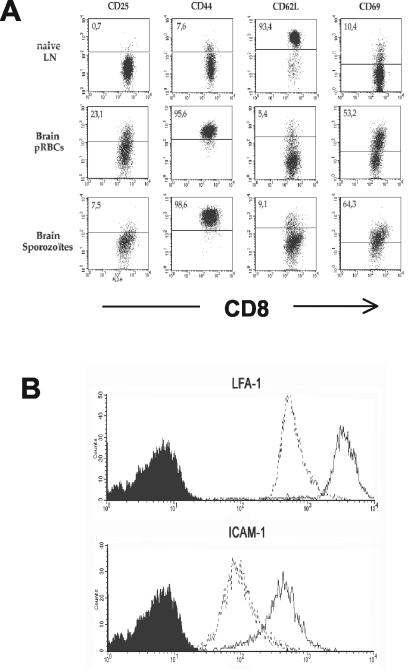
We compared the expression of CD25, CD44, CD62L, and CD69 markers on naive CD8+ T cells from the lymph nodes of uninfected mice, used as a control instead of brain lymphocytes which are too rare in normal mice, with that of these markers on CD8+ cells from the brains of CM+ mice. In the control mice, CD8+ T lymphocytes were found to be CD25− CD44low CD62-Lhigh CD69−. This phenotype characterizes naive T cells. CD8+ T lymphocytes isolated from the brains of CM+ mice from both PRBC- and sporozoite-infected groups exhibited an activated phenotype, i.e., CD44high CD62-Llow CD69+ (Fig. 5A). However, the expression levels of the activation makers and the frequency of positive cells differ between the two models of CM. For example, only 7.5% of CD8+ cells were CD25+ in sporozoite-infected CM+ mice compared to 23.1% in PRBC-infected CM+ mice. In addition, CD8+ T cells found within the brains of CM+ mice expressed higher levels of LFA-1 and ICAM-1 than did CD8+ T cells from the PBL of uninfected mice (Fig. 5B). This suggests that these cells are actively recruited to the site of inflammation.
FIG. 5.
Phenotype of CD8+ T lymphocytes isolated from the brains of CM+ mice. (A) Activation markers. Lymphoid cells isolated from brains of CM+ mice were doubly stained with anti-CD8 followed by anti-activation marker antibodies: CD25, CD44, CD62L, and CD69. Shown is a dot plot analysis indicating the activation markers expressed on naive cells from the LN of uninfected C57BL/6 mice (first row), CM+ mice infected with PRBC (second row), and CM+ mice infected with sporozoites (third row). (B) Adhesion molecules. The level of expression of the adhesion molecules on pooled lymphoid cells isolated from the brains of PRBC-infected CM+ mice after double staining with CD8 and ICAM-1 or LFA-1 (solid lines) was compared with that on naive T CD8+ cells isolated from the blood (dotted lines).
CD4+ and CD8+ T-cell populations isolated from control, sporozoite-infected, and PRBC-infected CM+ mice were stained with annexin-V and PI to allow us to discriminate between apoptotic cells and necrotic cells. The number of apoptotic CD4+ and CD8+ T cells within the brains of mice infected with sporozoites or PRBC and developing CM was not greater than in the brains of control mice (Fig. 6).
FIG. 6.
T cells in the brains of CM+ mice are not apoptotic. The percentage of early apoptotic cells (annexin V+ PI−) in pools of lymphoid cells isolated from the brains of five uninfected control mice and five CM+ mice infected with either sporozoites or PRBC is shown.
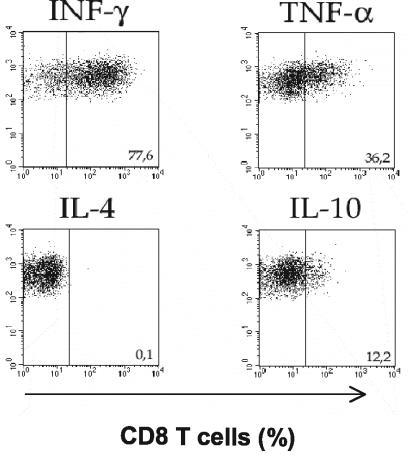
Since cytokines are thought to play an important role in the events contributing to the development of CM, we investigated whether parasite-primed CD8+ cells found in the brains of mice dying from CM secreted IFN-γ and TNF-α. Flow cytometry was used to detect intracellular cytokines produced by CD8+ T cells isolated from the brains of PRBC-infected CM+ mice. We found that 77.6% of CD8+ T cells isolated from the brains of CM+ mice produced IFN-γ, 36.2% produced TNF-α, and 12.2% produced IL-10 (Fig. 7). None of the CD8+ T cells in brains of CM+ mice were IL-4 positive (Fig. 7).
FIG. 7.
Cytokine spectrum of CD8+ T cells from CM+ mice. Lymphoid cells isolated from the brains of five CM+ mice were subjected to FACS analysis after intracellular staining for IFN-γ, TNF-α, IL-4, and IL-10. Cytokine production was analyzed on gated CD8-positive cells.
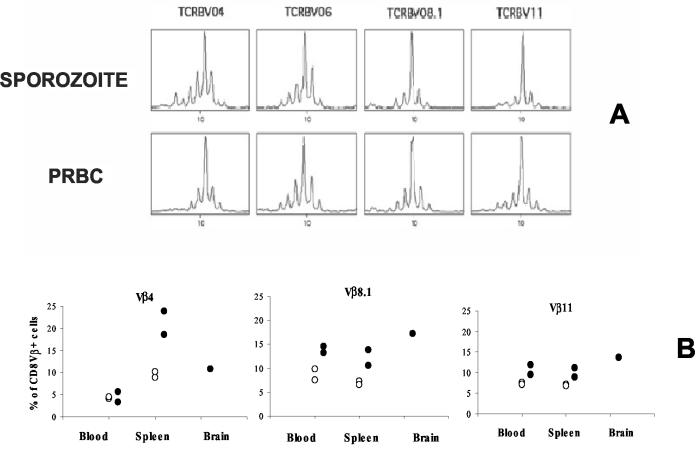
To determine whether the CD8+ T-cell clones present in the brains of sporozoite- and PRBC-infected CM+ mice are similar or different, we used the exhaustive CDR3 length spectratyping approach and immunoscope analysis to compare the repertoire of TCRVβ chains used by these clones. Vβ-Cβ repertoires were studied with cDNA prepared from CD8+ cells isolated from the brains of CM+ mice. The CDR3 profile for each Vβ-Cβ combination indicated that the repertoire was altered, with the presence of a predominant oligoclonal expansion in Vβ4, Vβ6, Vβ8.1, and Vβ11 profiles (Fig. 8A). Since the number of cells isolated from the brains of normal mice was very small, we used flow cytometry to compare the percentage of brain CD8+ T cells from CM+ mice bearing Vβ4, Vβ8.1, or Vβ11 with the percentage of PBL from the same animal bearing these markers. We found that 11% of CD8+ T cells from the brains of CM+ mice were Vβ4+, 17% were Vβ8.1+, and 14% were Vβ11+, compared to 4, 8, and 7%, respectively, of PBLs (Fig. 8B). These results demonstrate that CD8+ T cells within the brains of CM+ mice are subject to oligoclonal selection.
FIG. 8.
CD8+ T-cell repertoire during experimental CM. (A) Sorted CD8+ T lymphocytes isolated from the brains of five mice infected with sporozoites or PRBC were subjected to immunoscope analysis to determine the Vβ-Cβ repertoire. In this figure, only the profiles showing oligoclonal expansion are presented (Vβ4, Vβ6, Vβ8.1, and Vβ11); the other profiles had a Gaussian bell shape. (B) The percentage of TCR Vβ-positive cells was estimated by cytofluorometry of a pool of CD8 T cells isolated from the lymphoid compartments of five control or infected mice. ○, control; •, CM.
Involvement of CD8+ T cells in CM induced by P. berghei ANKA sporozoites or blood stages.
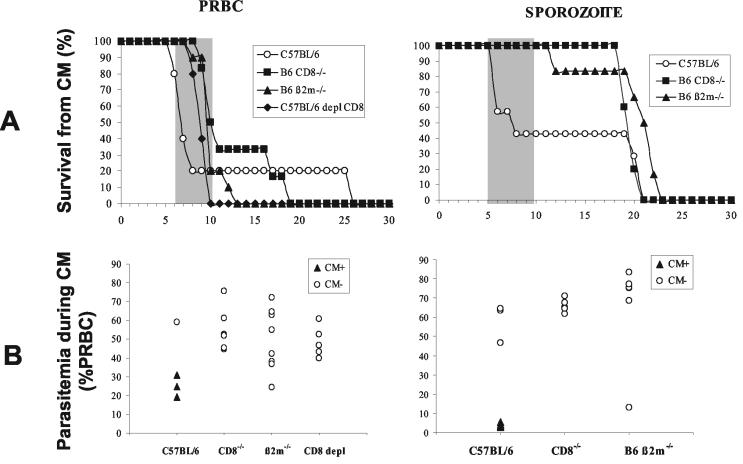
To characterize further the role of CD8+ T cells in the immune response leading to the development of CM following infection with P. berghei ANKA, wild-type, β2M−/−, CD8−/−, or CD8 antibody-depleted C57BL/6 mice were inoculated with PRBC and sporozoites. Mortality and parasitemia were monitored on a daily basis after infection (Fig. 9). With the exception of the wild-type C57BL/6 control group, none of the mice infected with sporozoites or PRBC developed CM. It is important to mention that CD8-deficient and CD8-depleted mice died earlier from hyperparasitemia (day 10 postinfection) following infection with PRBC than did mice infected with sporozoites (day 20 onwards). These data confirm the importance of CD8+ T cells in the mechanisms leading to the neurological disease induced by P. berghei ANKA clone 1.49L in susceptible strains of mice and also the role that they play in the control of parasite growth in blood-stage-infected mice.
FIG. 9.
CM susceptibility of CD8-deficient mice. (A) Mortality due to CM in CD8−/− (n = 5 for PRBC and n = 5 for sporozoite infection), β2m−/− (n = 10 for PRBC and n = 6 for sporozoites), and CD8 MAb-depleted (CD8 depl) (n = 5 for PRBC) mice after infection with 106 PRBC or 50,000 sporozoites of P. berghei ANKA is shown. Survival curves for C57BL/6 mice (n = 5 for PRBC and n = 7 for sporozoites) are included as a reference for CM susceptibility. The shaded portion represents the time window of mortality from CM. (B) Parasitemia was determined on the day of death, whether it was early or late, for all the mice.
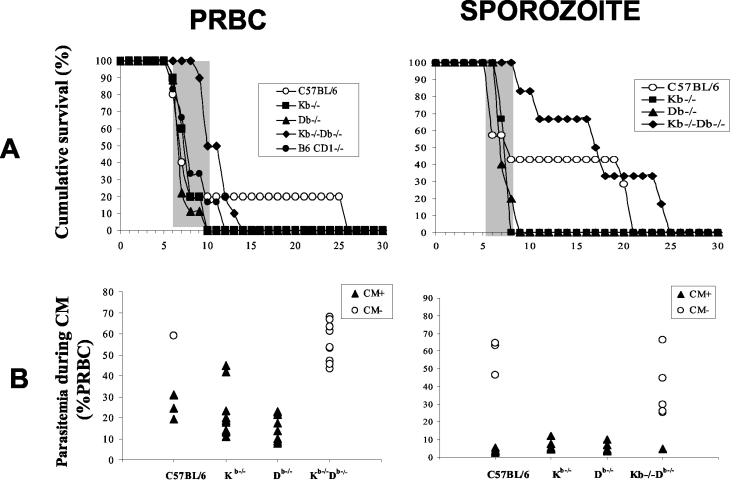
To determine whether CD8+ T cells restricted by MHC class Ia molecules participate in the mechanisms leading to the neuropathology, B6.H-2Kb−/−Db−/−, B6 CD1d−/−, and C57BL/6 control mice were infected with sporozoites or PRBC. Our results showed that mice depleted of CD8+ T cells restricted by H-2Kb and H-2Db molecules were resistant to CM whereas deletion of the CD1d molecules had no effect on the pathogenesis (Fig. 10). To test whether the CD8+ T cells involved in the neuropathology associated with P. berghei ANKA infection in susceptible C57BL/6 mice are restricted by either H-2Kb or H-2Db molecules, the outcome of CM was compared in B6.H-2Kb−/−, B6.H-2Db−/−, and control C57BL/6 mice (Fig. 10). No significant differences in the occurrence of CM were observed in the three groups. The level of parasitemia was the same in the three lines of mice tested for the two developmental stages of parasites injected, suggesting that pathological CD8+ T cells are restricted by H-2Kb or H-2Db but not CD1d molecules. These results clearly show that MHC class Ia molecules are required for the control of the immune responses leading to the neuropathogenesis induced during P. berghei ANKA infection and that nonclassical class I molecules play no significant role.
FIG. 10.
Susceptibility of H-2Kb, H-2Db, H-2KbDb, and CD1 knockout mice to CM. (A) Mortality due to CM in Kb−/− (n = 10 for PRBC and n = 6 for sporozoites), Db−/− (n = 9 for PRBC and n = 5 for sporozoites), CD1d−/− (n = 10 for PRBC), and Kb−/−Db−/− (n = 10 for PRBC and n = 6 for sporozoites) mice after infection with 106 PRBC or 50,000 sporozoites of P. berghei ANKA is shown. Survival curves for C57BL/6 mice (n = 5 for PRBC and n = 6 for sporozoites) are included as a reference for CM susceptibility. The shaded portion represents the time window of mortality from CM. (B) Parasitemia was determined on the day of death for all the mice.
Effect of the in vivo depletion of TCRVβ4+, TCRVβ6+, TCRVβ8.1+, TCRVβ8.2+, and TCRVβ11+ cells on CM.
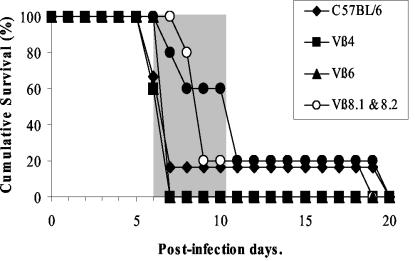
Several depletion experiments were designed to ascertain whether the Vβ CD8+ T-cell subsets present within the brains of CM+ mice are involved in the disease. Mice were depleted by injections of MAbs directed against the different Vβ segments. The efficiency of the depletion was confirmed by the absence of targeted TCRVβ+ cells in PBL before infection, and its effect on the neurological syndrome was monitored by observing the appearance of clinical signs of the neuropathology and death consecutive to infection (Fig. 11). The occurrence of CM was not affected in mice in which Vβ4, Vβ6, or Vβ11 T cells were depleted. In the group of mice treated with antibodies directed against Vβ8.1 and Vβ8.2 or with a mixture of antibodies recognizing TCRVβ4, TCRVβ6, TCRVβ8.1, TCRVβ8.2, and TCRVβ11, the onset of the neurological syndrome was delayed by 2 days compared to that in C57BL/6 mice.
FIG. 11.
In vivo depletion of T cells bearing TCRVβ8.1 and TCRVβ8.2 segments. Survival of mice depleted for Vβ4 (n = 5), Vβ6 (n = 5), Vβ8.1 and Vβ8.2 (n = 5), and Vβ11 (n = 5) or for all of these Vβ subpopulations (n = 5) after infection with 106 PRBC of P. berghei ANKA is shown. The C57BL/6 survival curve (n = 6) is included as a CM reference. The shaded part represents the time window of mortality from CM.
DISCUSSION
We and other groups have reported that pathogenic processes involved in CM are dependant on both CD4 and CD8 lymphocytes (2, 3, 5, 12, 17, 29, 42), proinflammatory cytokines such as TNF-α and IFN-γ (9), and chemokines (30). However, the exact role played by these cells in the induction of the disease is currently unknown. Furthermore, experimental CM in rodent models is mostly based on intravenous or intraperitoneal delivery of parasitized erythrocytes; the immune responses associated with CM in P. berghei ANKA sporozoite-induced infection have not been characterized and evaluated.
To further analyze the extent to which the intrahepatic phase of malaria parasites is involved in the pathogenic response leading to CM, we developed an improved model of murine CM by using sporozoites to induce disease. We used this model to carry out a comparative study of several aspects of the immune response to P. berghei ANKA infection induced by sporozoites in C57BL/6 mice and the immune response to a blood stage infection. Our data show that in both models, CD8+ T cells are particularly important in the development of CM.
C57BL/6 mice infected with sporozoites do exhibit clinical signs of CM between 6 and 9 days postinoculation as do the PRBC-infected mice. The onset and outcome of CM in sporozoite-infected mice was dependent on the number of parasites injected. For example, a minimum of 5 × 10⁴ sporozoites is required if assessed by 100% early mortality with neurological signs. A comparison of the blood parasite load during CM syndrome clearly showed that blood from mice infected with PRBC contained significantly more parasites than did blood from mice infected with sporozoites. These findings strongly suggest that the induction of CM does not necessarily depend on high parasite loads in the blood but, instead, depends on the number of parasites in the inoculum. It is also noteworthy that the different doses of sporozoites used were not correlated with the levels of parasitemia.
To analyze differences in the pathological process induced by the different types of infections, T lymphocytes were compared in CM+ mice. Lymphopenia was observed in all CM+ mice. This decrease in T-cell numbers affected both CD4+ and CD8+ cell populations, and, surprisingly, we observed that it was not correlated with the presence of a larger number of annexin-positive T cells in PBL and peripheral LN and spleen cells (13, 16, 19). We used flow cytometry to study and to quantify T-lymphocyte populations isolated from the brains of CM+ mice, and we compared their phenotype with those of cells from uninfected mice. The number of T cells in the brains of CM+ mice increased significantly. The infiltrate in the two models of infection was composed mainly of a CD8+ αβ T-cell subpopulation. Only a small number of CD4+ T cells were present in the brain, and some of them were apoptotic. Whether these residual CD4+ T cells in the brain are functional requires further investigations.
CD8+ T cells isolated from the brains of CM+ mice exhibited an activated phenotype, as demonstrated by the expression of the CD69 and CD25 surface markers in both types of infection. However, the proportion of the CD8 subsets expressing CD25 was higher in mice infected with PRBC. Several hypotheses can be drawn from these observations: (i) there are two types of CD8+ T-cell population within the brain, CD25+ and CD25−; (ii) after migrating into the brain, CD8+ T cells may lose their CD25 marker; and (iii) both activated and nonactivated CD8+ T cells could migrate into the brain during the inflammatory process that characterizes CM. The finding that the expression of CD44 was up regulated and that of CD26L was down regulated also confirms the activated phenotype of the brain CD8+ cells (10, 23, 34). Their ability to migrate into the brain as the disease proceeds was confirmed by the high expression levels of adhesion molecules such as LFA-1 and ICAM-1. LFA-1 molecules also play a role in CM, as demonstrated by the fact that mice treated with a MAb against LFA-1 did not develop the neuropathogenesis (1, 32). Anti LFA-1 antibodies may act by interfering with the migration of pathological CD8+ T cells in the brain.
Sporozoite-infected mice, which have a low level of parasitemia and small numbers of CD8+ T cells in the brain, develop the disease at the same time as do blood-stage-infected mice. We hypothesize that the priming of pathological T-cell clones is more efficient in sporozoite-induced infection than in blood-stage-induced infection. Preerythrocytic stages of the malaria parasite may also play a role by modulating the T-cell responses induced by the blood-stage parasite, which is associated with the pathogenic process notably through the stimulation of MHC class I-restricted T lymphocytes or through cytokines (31). We showed that MHC class I-dependent effector CD8+ T cells are directly involved because several lines of CD8+ T-cell-deficient mice, obtained by inactivating genes encoding either the CD8 molecules or molecules implicated in antigen presentation such as β2-microglobulin or MHC class I molecules themselves, are resistant to CM induced by sporozoites or blood-stage parasites. The mechanisms by which the CD8+ T cells that accumulate within the brain participate in the disease have not yet been clearly defined, proving that CM is a multiple and complex pathogenic process. Nevertheless, these cells may constitute a source of proinflammatory cytokines such as IFN-γ and TNF-α, which play an essential role in the pathogenesis associated with CM.
The exhaustive comparison of CDR3 length spectratyping from CD8+ cells isolated from the brains of sporozoite- or PRBC-infected CM+ animals showed the oligoclonal expansion of subpopulations of cells bearing Vβ4, Vβ8.1, Vβ11, and, to a lesser extent, Vβ6 T-cell receptor (TCR) chains. This suggests a restricted selection of CD8+ cell subsets that migrated into the brains of CM+ mice.
Finally, the results obtained following the in vivo depletion of Vβ6, Vβ8.1, and Vβ11 cell subpopulations suggest that TCRVβ8.1+ subpopulations are directly involved in CM since the manifestation of the disease in the mice depleted with an antibody directed against TCRVβ8.1+ is significantly delayed. This observation is reminiscent of those made with B10.D2 mice (3, 6a, 11) and with CXD2 recombinant inbred mice (6, 11), showing that an increase in the number of CD8+ Vβ8.1+ T cells is correlated with the development of CM and that deletion of these cells is correlated with protection against the disease linked to CM.
In summary, we have shown, using a murine model of CM initiated by P. berghei ANKA sporozoites, that activated CD8 T cells are present in the brains of mice developing CM, as in the classical experimental model using blood-stage parasites. These CD8 T cells are associated with the development of the neurological syndrome. Nevertheless, the exact mechanism by which CD8 T cells are involved in the pathology remains to be elucidated.
Acknowledgments
A.C. and S.B. were recipients of a fellowship from the French Ministery of Research. S.B. is a recipient of a fellowship from the Fondation pour la Recherche Médicale. S.P. and P.A.C. were recipients of Visiting Scientist fellowship from the FCT, Portugal. This work was supported by PRFMMIP from the French Ministery of Research, INCO-DC IC18CT980363, and FCT/POCTI/36369/MGI/2000. This work was conducted in the frame of the CNRS Laboratoire Européen Associé “Génétique et Développement de la Tolérance Naturelle.”
We thank Marie-Christine Wagner, Christelle Sellier, and Sao Alpercia for technical assistance and Anne Louise for T-cell sorting. We thank G. Milon and D. Rueff-Juy for critical reading of the manuscript.
Editor: W. A. Petri, Jr.
REFERENCES
- 1.Amani, V., M. I. Boubou, S. Pied, M. Marussig, D. Walliker, D. Mazier, and L. Renia. 1998. Cloned lines of Plasmodium berghei ANKA differ in their abilities to induce experimental cerebral malaria. Infect. Immun. 66:4093-4099. [DOI] [PMC free article] [PubMed] [Google Scholar]
- 2.Belnoue, E., M. Kayibanda, A. M. Vigario, J.C. Deschemin, N. Rooijen, M. Viguier, G. Snounou, and L. Rénia. 2003. On the pathogenic role of brain sequestered αβ CD8 T cells in experimental cerebral malaria. J. Immunol. 169:6369-6375. [DOI] [PubMed] [Google Scholar]
- 3.Boubou, M. I., A. Collette, D. Voegtle, D. Mazier, P. A. Cazenave, and S. Pied. 1999. T cell response in malaria pathogenesis: selective increase in T cells carrying the TCR V(beta)8 during experimental cerebral malaria. Int. Immunol. 11:1553-1562. [DOI] [PubMed] [Google Scholar]
- 4.Brown, H., T. T. Hien, N. Day, N. T. Mai, L. V. Chuong, T. T. Chau, P. P. Loc, N. H. Phu, D. Bethell, J. Farrar, K. Gatter, N. White, and G. Turner. 1999. Evidence of blood-brain barrier dysfunction in human cerebral malaria. Neuropathol. Appl. Neurobiol. 25:331-340. [DOI] [PubMed] [Google Scholar]
- 5.Chang, W. L., S. P. Jones, D. J. Lefer, T. Welbourne, G. Sun, L. Yin, H. Suzuki, J. Huang, D. N. Granger, and H. C. van der Heyde. 2001. CD8+-T-cell depletion ameliorates circulatory shock in Plasmodium berghei-infected mice. Infect. Immun. 69:7341-7348. [DOI] [PMC free article] [PubMed] [Google Scholar]
- 6.Collette, A., and A. Six. 2002. ISEApeaks: an Excel platform for GeneScan and Immunoscope data retrieval, management and analysis. Bioinformatics 18:329-331. [DOI] [PubMed] [Google Scholar]
- 6a.Collette, A., S. Bagot, P. A. Cazenave, A. Six, and S. Pied. A profound alteration of blood TCRB repertoire allows prediction of cerebral malaria. J. Immunol., in press. [DOI] [PubMed]
- 7.Dailey, M. O. 1998. Expression of T lymphocytes adhesion molecules: regulation during antigen-induced T cell activation and differentiation. Crit. Rev. Immunol. 18:153-184. [DOI] [PubMed] [Google Scholar]
- 8.Dudgeon, L. S., and C. Clarcke. 1917. A contribution to the microscopical histology of malaria. Lancet 1917:153-155. [Google Scholar]
- 9.Falanga, P. B., and E. C. Butcher. 1991. Late treatment with anti-LFA-1 (CD11a) antibody prevents cerebral malaria in a mouse model. Eur. J. Immunol. 21:2259-2263. [DOI] [PubMed] [Google Scholar]
- 10.Fung-Leung, W. P., M. W. Schilham, A. Rahemtulla, T. M. Kundig, M. Vollenweider, J. Potter, W. van Ewijk, and T. W. Mak. 1991. CD8 is needed for development of cytotoxic T cells but not helper T cells. Cell 65:443-449. [DOI] [PubMed] [Google Scholar]
- 11.Gorgette, O., A. Existe, M. I. Boubou, S. Bagot, J. L. Guenet, D. Mazier, P. A. Cazenave, and S. Pied. 2002. Deletion of T cells bearing the V beta 8.1 T-cell receptor following mouse mammary tumor virus 7 integration confers resistance to murine cerebral malaria. Infect. Immun. 70:3701-3704. [DOI] [PMC free article] [PubMed] [Google Scholar]
- 12.Grau, G. E., P. F. Piguet, H. D. Engers, J. A. Louis, P. Vassalli, and P. H. Lambert. 1986. L3T4+ T lymphocytes play a major role in the pathogenesis of murine cerebral malaria. J. Immunol. 137:2348-2354. [PubMed] [Google Scholar]
- 13.Grau, G. E., T. E. Taylor, M. E. Molyneux, J. J. Wirima, P. Vassalli, M. Hommel, and P. H. Lambert. 1989. Tumor necrosis factor and disease severity in children with falciparum malaria. N. Engl. J. Med. 320:1586-1591. [DOI] [PubMed] [Google Scholar]
- 14.Grau, G. E., P. F. Piguet, P. Vassalli, and P. H. Lambert. 1989. Tumor-necrosis factor and other cytokines in cerebral malaria: experimental and clinical data. Immunol. Rev. 112:49-70. [DOI] [PubMed] [Google Scholar]
- 15.Grau, G. E., G. Bieler, P. Pointaire, S. De Kossodo, F. Tacchini-Cotier, P. Vassalli, P. F. Piguet, and P. H. Lambert. 1990. Significance of cytokine production and adhesion molecules in malarial immunopathology. Immunol. Lett. 25:189-194. [DOI] [PubMed] [Google Scholar]
- 16.Grau, G. E., P. Pointare, P. F. Piguet, C. Vesin, H. Rosen, I. Stamenkovic, F. Takei, and P. Vassalli. 1991. Late administration of monoclonal antibody to leukocyte function-antigen 1 abrogates incipient murine cerebral malaria. Eur. J. Immunol. 21:2265-2267. [DOI] [PubMed] [Google Scholar]
- 17.Hermsen, C., T. van de Wiel, E. Mommers, R. Sauerwein, and W. Eling. 1997. Depletion of CD4+ or CD8+ T-cells prevents Plasmodium berghei induced cerebral malaria in end-stage disease. Parasitology 114:7-12. [DOI] [PubMed] [Google Scholar]
- 18.Hermsen, C. C., E. Mommers, T. van de Wiel, R. W. Sauerwein, and W. M. Eling. 1998. Convulsions due to increased permeability of the blood-brain barrier in experimental cerebral malaria can be prevented by splenectomy or anti-T cell treatment. J. Infect. Dis. 178:1225-1229. [DOI] [PubMed] [Google Scholar]
- 19.Hill, A. V., C. E. Allsopp, D. Kwiatkowski, N. M. Anstey, P. Twumasi, P. A. Rowe, S. Bennett, D. Brewster, A. J. McMichael, and B. M. Greenwood. 1991. Common West African HLA antigens are associated with protection from severe malaria. Nature 352:595-600. [DOI] [PubMed] [Google Scholar]
- 20.Ho, M., H. K. Webster, S. Looareesuwan, W. Supanaranond, R. E. Phillips, P. Chanthavanich, and D. A. Warrell. 1986. Antigen-specific immunosuppression in human malaria due to Plasmodium falciparum. J. Infect. Dis. 153:763-771. [DOI] [PubMed] [Google Scholar]
- 21.Kern, P., C. J. Hemmer, H. Gallati, S. Neifer, P. Kremsner, M. Dietrich, and F. Porzsolt. 1992. Soluble tumor necrosis factor receptors correlate with parasitemia and disease severity in human malaria. J. Infect. Dis. 166:930-934. [DOI] [PubMed] [Google Scholar]
- 22.Kern, P., C. J. Hemmer, J. Van Damme, H. J. Gruss, and M. Dietrich. 1989. Elevated tumor necrosis factor alpha and interleukin-6 serum levels as markers for complicated Plasmodium falciparum malaria. Am. J. Med. 87:139-143. [DOI] [PubMed] [Google Scholar]
- 23.Koller, B. H., P. Marrack, J. W. Kappler, and O. Smithies. 1990. Normal development of mice deficient in beta 2M, MHC class I proteins, and CD8+ T cells. Science 248:1227-1230. [DOI] [PubMed] [Google Scholar]
- 24.Kwiatkowski, D., J. G. Cannon, K. R. Manogue, A. Cerami, C. A. Dinarello, and B. M. Greenwood. 1989. Tumor necrosis factor production in Falciparum malaria and its association with schizont rupture. Clin. Exp. Immunol. 77:361-366. [PMC free article] [PubMed] [Google Scholar]
- 25.Kwiatkowski, D., A. V. Hill, I. Sambou, P. Twumasi, J. Castracane, K. R. Manogue, A. Cerami, D. R. Brewster, and B. M. Greenwood. 1990. TNF concentration in fatal cerebral, non-fatal cerebral, and uncomplicated Plasmodium falciparum malaria. Lancet 336:1201-1204. [DOI] [PubMed] [Google Scholar]
- 26.Le Bon, A., B. Lucas, F. Vasseur, C. Penit, and M. Papiernik. 1996. In vitro T cell response to viral superantigen. Selective migration rather than profliferation. J. Immunol. 156:4602-4608. [PubMed] [Google Scholar]
- 27.MacPherson, G. G., M. J. Warrell, N. J. White, S. Looareesuwan, and D. A. Warrell. 1985. Human cerebral malaria. A quantitative ultrastructural analysis of parasitized erythrocyte sequestration. Am. J. Pathol. 119:385-401. [PMC free article] [PubMed] [Google Scholar]
- 28.Malherbe, L., C. Filippi, V. Julia, G. Foucras, M. Moro, H. Appel, K. Wucherpfennig, J. C. Guery, and N. Glaichenhaus. 2000. Selective activation and expansion of high-affinity CD4+ T cells in resistant mice upon infection with Leishmania major. Immunity 13:771-782. [DOI] [PubMed] [Google Scholar]
- 29.Medana, I. M., G. Chaudhri, T. Chan-Ling, and N. H. Hunt. 2001. Central nervous system in cerebral malaria: ‘innocent bystander’ or active participant in the induction of immunopathology? Immunol. Cell Biol. 79:101-120. [DOI] [PubMed] [Google Scholar]
- 30.Nitcheu, J., O. Bonduelle, C. Combadiere, M. Tefit, D. Seilhean, D. Mazier, and B. Combadiere. 2003. Perforin-dependent brain-infiltrating cytotoxic CD8+ T lymphocytes mediate experimental cerebral malaria pathogenesis. J. Immunol. 170:2221-2228. [DOI] [PubMed] [Google Scholar]
- 31.Pannetier, C., M. Cochet, S. Darche, A. Casrouge, M. Zoller, and P. Kourilsky. 1993. The sizes of the CDR3 hypervariable regions of the murine T-cell receptor beta chains vary as a function of the recombined germ-line segments. Proc. Natl. Acad. Sci. USA 90:4319-4323. [DOI] [PMC free article] [PubMed] [Google Scholar]
- 32.Pannetier, C., J. Even, and P. Kourilsky. 1995. T-cell repertoire diversity and clonal expansions in normal and clinical samples. Immunol. Today 16:176-181. [DOI] [PubMed] [Google Scholar]
- 33.Patnaik, J. K., B. S. Das, S. K. Mishra, S. Mohanty, S. K. Satpathy, and D. Mohanty. 1994. Vascular clogging, mononuclear cell margination, and enhanced vascular permeability in the pathogenesis of human cerebral malaria. Am. J. Trop. Med. Hyg. 51:642-647. [PubMed] [Google Scholar]
- 34.Perarnau, B., M. F. Saron, B. R. San Martin, N. Bervas, H. Ong, M. J. Soloski, A. G. Smith, J. M. Ure, J. E. Gairin, and F. A. Lemonnier. 1999. Single H2Kb, H2Db and double H2KbDb knockout mice: peripheral CD8+ T cell repertoire and anti-lymphocytic choriomeningitis virus cytolytic responses. Eur. J. Immunol. 29:1243-1252. [DOI] [PubMed] [Google Scholar]
- 35.Pongponratn, E., M. Riganti, B. Punpoowong, and M. Aikawa. 1991. Microvascular sequestration of parasitized erythrocytes in human falciparum malaria: a pathological study. Am. J. Trop. Med. Hyg. 44:168-175. [DOI] [PubMed] [Google Scholar]
- 36.Porta, J., A. Carota, G. P. Pizzolato, E. Wildi, M. C. Widmer, C. Margairaz, and G. E. Grau. 1993. Immunopathological changes in human cerebral malaria. Clin. Neuropathol. 12:142-146. [PubMed] [Google Scholar]
- 37.Silamut, K., N. H. Phu, C. Whitty, G. D. Turner, K. Louwrier, N. T. Mai, J. A. Simpson, T. T. Hien, and N. J. White. 1999. A quantitative analysis of the microvascular sequestration of malaria parasites in the human brain. Am. J. Pathol. 155:395-410. [DOI] [PMC free article] [PubMed] [Google Scholar]
- 38.Toro, G., and G. Roman. 1978. Cerebral malaria. A disseminated vasculomyelinopathy. Arch. Neurol. 35:271-275. [DOI] [PubMed] [Google Scholar]
- 39.Turner, G. D., H. Morrison, M. Jones, T. M. Davis, S. Looareesuwan, I. D. Buley, K. C. Gatter, C. I. Newbold, S. Pukritayakamee, B. Nagachinta, et al. 1994. An immunohistochemical study of the pathology of fatal malaria. Evidence for widespread endothelial activation and a potential role for intercellular adhesion molecule-1 in cerebral sequestration. Am. J. Pathol. 145:1057-1069. [PMC free article] [PubMed] [Google Scholar]
- 40.Weidanz, W. P. 1982. Malaria and alterations in immune reactivity. Br. Med. Bull. 38:167-172. [DOI] [PubMed] [Google Scholar]
- 41.Wyler, D. J. 1976. Peripheral lymphocyte subpopulations in human falciparum malaria. Clin. Exp. Immunol. 23:471-476. [PMC free article] [PubMed] [Google Scholar]
- 42.Yanez, D. M., D. D. Manning, A. J. Cooley, W. P. Weidanz, and H. C. van der Heyde. 1996. Participation of lymphocyte subpopulations in the pathogenesis of experimental murine cerebral malaria. J. Immunol. 157:1620-1624. [PubMed] [Google Scholar]


