

Abstract
Left ventricular (LV) infarct size affects prognosis after acute myocardial infarction (AMI). Delayed enhancement cardiac magnetic resonance (DE-CMR) provides accurate infarct quantification but is unavailable or contraindicated in many patients. This study tested whether simple electrocardiography (ECG) parameters can stratify LV infarct size. One hundred fifty-two patients with AMI underwent DE-CMR and serial 12-lead ECG. Electrocardiograms were quantitatively analyzed for multiple aspects of Q-wave morphology, including duration, amplitude, and geometric area (QWAr) summed across all leads except aVR. Patients with pathologic Q waves had larger infarcts measured by DE-CMR or enzymes (both p <0.001), even after controlling for infarct distribution by CMR or x-ray angiography. Comparison between early (4 ± 0.4 days after AMI) and follow-up (29 ± 6 days) ECG demonstrated temporal reductions in Q-wave amplitude (1.8 ± 1.4 vs 1.6 ± 1.6 mV; p = 0.03) but not QWAr (41 ± 38 vs 39 ± 43 mV•ms; p = 0.29). At both times, QWAr augmented stepwise with DE-CMR quantified infarct size (p <0.001). QWAr increased markedly at 10% LV infarct threshold, with differences more than threefold on early ECG (59 ± 39 vs 18 ± 20 mV•ms; p <0.001) and nearly fivefold (59 ± 46 vs 13 ± 16 mV•ms; p <0.001) on follow-up. Diagnostic performance compared with a 10% infarction cutoff was good on early (area under the curve = 0.84) and follow-up (area under the curve = 0.87) ECG. Optimization of sensitivity (95% to 98%) enabled QWAr to exclude affected patients with 90% to 94% negative predictive value at each time point. In conclusion, LV infarct size is accompanied by stepwise increments in Q-wave morphology, with QWAr increased three- to fivefold at a threshold of 10% LV infarction. Stratification based on QWAr provides excellent negative predictive value for exclusion of large (≥10%) LV infarct burden.
Left ventricular (LV) infarct size is an established determinant of adverse clinical outcomes after acute myocardial infarction (AMI).1–4 Myocyte necrosis provides a proarrhythmic substrate and has been shown to predict risk for ventricular tachyarrhythmias independent of contractile dysfunction.3,5 Accordingly, stratification of LV infarct size is of prognostic importance for post-AMI patients. Delayed enhancement cardiac magnetic resonance (DE-CMR) is well validated as a noninvasive reference standard for LV infarct quantification.6,7 DE-CMR has been used clinically to measure infarct size and transmurality. However, population-based use of DE-CMR as a primary means of stratifying infarct burden would entail substantial costs and be infeasible in many patients. Electrocardiography (ECG), a routine component of post-AMI care, is inexpensive and readily obtainable in nearly all patients. Although it is known that small infarcts can occur without pathologic Q waves on electrocardiogram,8–10 it is possible that a size threshold exists above which Q-wave morphology can be used to stratify infarct burden. ECG might therefore be useful as a primary screening test to exclude infarcts below a given threshold, with more sophisticated testing reserved to quantify infarct size in patients with specific Q-wave abnormalities in the QRS complex. To date, studies comparing DE-CMR with ECG-based infarct quantification have used scoring systems that encompass several aspects of the QRS waveform,11–14 without addressing whether Q-wave morphology alone can serve as a marker of global infarct burden. The aims of this study were twofold: (1) to evaluate whether Q-wave morphology, as assessed on early and follow-up post-AMI ECG, parallels global infarct size on DE-CMR, and (2) to determine whether a quantitative cutoff exists whereby Q-wave indexes can be used to stratify patients above and below a given threshold for global LV infarct size.
Methods
The population comprised patients with first ST elevation AMI enrolled in a prospective registry of post-AMI remodeling (ClincalTrials.gov no. NCT00539045) from September 2006 to October 2012. In accordance with established criteria, AMI was defined by chest pain with ST segment elevation in ≥2 contiguous ECG leads and elevated cardiac enzymes (more than ninety-ninth percentile).15 Patients were excluded for previous AMI or contraindication to CMR. Comprehensive clinical data were collected, including cardiac risk factors, coronary artery disease history, and treatment regimen. Coronary angiograms were reviewed for infarct related artery and lesion-based (Alberta Provincial Project for Outcome Assessment in Coronary Heart Disease [APPROACH]) myocardial jeopardy score.16 Electrocardiograms were acquired at 2 time points (1) <1 week (target 3 to 5 days) after AMI, and (2) 2 to 6 weeks after AMI. In all patients, CMR was performed on the same day as follow-up (2- to 6-week) ECG. The study was conducted in accordance with the Weill Cornell Institutional Review Board.
Electrocardiograms were acquired using a standard 12-lead surface electrode recording system (MAC 5000/550, General Electric, Waukesha, Wisconsin). Recordings were performed at a sampling rate of 500 Hz. Data were stored digitally using a dedicated (GE Muse, General Electric) archival system. Electrocardiograms were quantitatively analyzed using a dedicated processing software (Magellan, GE Healthcare, Wauwatosa, Wisconsin). A band-pass filter of 0.05 to 150 Hz was applied before measurement, consistent with American Heart Association/American College of Cardiology recommendations.17 Multiple aspects of Q-wave morphology were measured in each surface lead, including duration, maximal amplitude, and geometric area subtended within each respective Q wave. Q waves were defined as the first negative deflection of the QRS complex. If a QS complex pattern was seen, the entire QS wave was defined as a Q wave. To minimize the impact of ECG noise artifact, Q-wave area (QWAr) was only recorded when ≥160 μV•ms. Respective Q-wave parameters (amplitude, duration, and area) were similarly measured for all other QRS waveform deflections as recorded within all ECG leads.
Each Q-wave parameter was summed across individual surface leads to calculate total amplitude, duration, and area, which were calculated as unadjusted parameters and with adjustment for absolute QRS data (i.e., total QWAr/total QRS area). Q waves as recorded in lead aVR were excluded from all analyses. Established consensus criteria were used to define binary presence or absence of pathologic Q waves (V2 to V3: duration ≥0.02 second | I, II, aVL, aVF, V4 to V6: duration ≥0.03 second, amplitude ≥0.1 mV).15
CMR was performed using 1.5-Tesla scanners (General Electric, Waukesha, Wisconsin). Exams consisted of 2 components: (1) cine-CMR for function or morphology, and (2) DE-CMR for infarct quantification. Cine-CMR was performed using a steady-state free precession sequence (typical parameters: repetition time 3.5 milliseconds, echo time 1.6 milliseconds, flip angle 60°, inplane spatial resolution 1.9 × 1.4 mm). After cine-CMR, gadolinium was intravenously administered (0.2 mmol/kg) and DE-CMR performed 10 to 30 minutes thereafter using a segmented inversion recovery sequence. Cine-CMR and DE-CMR images were obtained in matching short- and long-axis planes. Short-axis images were acquired throughout the LV (6-mm slice thickness, 4-mm gap) from the level of the mitral valve annulus through the apex. Long-axis images were acquired in standard 2-, 3-, and 4-chamber orientations.
Global LV infarct size (%LV myocardium) was quantified on DE-CMR using the full width at half maximum method, for which high reproducibility has been reported.18,19 Regional infarct location and transmurality was scored using an established 17-segment model or 5-point-per-segment scoring system (0 = no hyper-enhancement; 1 = 1% to 25%; 2 = 26% to 50%; = 3 51% to 75%; 4 = 76% to 100%).20 LV structure and function were quantified using cine-CMR. LV mass was quantified at end-diastole, with inclusion of papillary muscles and trabeculae within myocardial contours. LV ejection fraction and cavity volumes were based on end-diastolic and end-systolic endocardial contours of contiguous short-axis images. Regional LV wall motion was scored using a 17-segment model. Segmental function was graded as 0 = normal contraction, 1= mild hypokinesia, 2 = moderate hypokinesia, 3 = severe hypokinesia, 4 = akinesia, and 5 = dyskinesia.
Comparisons of continuous variables were made using Student’s t test (expressed as mean ± standard deviation) for 2 group comparisons and analysis of variance for multiple group comparisons. Categorical variables were compared using chi-square or Fisher’s exact tests when <5 outcomes were expected per cell; paired categorical variables were compared using McNemar’s test. Linear regression was used to evaluate multivariable associations between Q-wave parameters and DE-CMR. Receiver operating characteristic analysis was used to evaluate diagnostic performance of Q-wave parameters for detection of DE-CMR quantified global LV infarct size. Area under the curve (AUC) comparisons were performed based on z-transformation in accordance with established methods.21 Two-sided p <0.05 was considered indicative of statistical significance. Calculations were performed using SPSS 14.0 (SPSS, Chicago, Illinois).
Results
The population comprised 152 patients who had both early (4 ± 0.4 days) and follow-up (29 ± 6 days post-AMI) ECG performed after AMI. In all patients, follow-up ECG was performed on the same day as CMR.
Table 1 details baseline characteristics of the study population, with stratification based on presence or absence of follow-up ECG-evidenced pathologic Q waves (defined based on established criteria).15 As expected, affected patients had larger global infarct burden, whether measured by cardiac enzymes or DE-CMR evidenced hyperenhancement (both p <0.001). Consistent with this, pathologic Q waves were associated with hemodynamic instability as assessed based on need for pharmacologic and/or mechanical support (p = 0.04).
Table 1.
Population characteristics*
| Parameter | Overall (n = 152) | Q-Wave + (n = 104) | Q-Wave − (n = 48) | p Value |
|---|---|---|---|---|
| Age (yr) | 56 ± 12 | 55 ± 12 | 58 ± 13 | 0.24 |
| Men | 126 (83%) | 91 (88%) | 35 (73%) | 0.03 |
| Hypertension | 59 (39%) | 38 (37%) | 21 (44%) | 0.40 |
| Diabetes mellitus | 34 (22%) | 23 (22%) | 11 (23%) | 0.91 |
| Hypercholesterolemia | 72 (47%) | 45 (43%) | 27 (56%) | 0.14 |
| Tobacco use | 46 (30%) | 25 (24%) | 21 (44%) | 0.01 |
| Family history of coronary disease | 39 (26%) | 28 (27%) | 11 (23%) | 0.60 |
| Previous coronary revascularization | 8 (5%) | 4 (4%) | 4 (8%) | 0.26 |
| Revascularization strategy | ||||
| 1° PCI | 115 (76%) | 78 (75%) | 37 (77%) | 0.78 |
| Primary thrombolysis | 37 (24%) | 26 (25%) | 11 (23%) | 0.78 |
| Thrombolysis with emergent PCI | 22 (15%) | 17 (16%) | 5 (10%) | 0.33 |
| Pharmacologic/mechanical support | 31 (20%) | 26 (25%) | 5 (10%) | 0.04 |
| Cardiovascular medications | ||||
| β blocker | 144 (95%) | 101 (97%) | 43 (90%) | 0.05 |
| ACE inhibitor/angiotensin receptor blocker | 91 (60%) | 66 (64%) | 25 (52%) | 0.18 |
| HMG-CoA reductase inhibitor | 146 (96%) | 99 (95%) | 47 (98%) | 0.67 |
| Thienopyridine | 147 (97%) | 101 (97%) | 46 (96%) | 0.65 |
| Aspirin | 152 (100%) | 104 (100%) | 48 (100%) | - |
| IIb/IIIa antagonists | 122 (82%) | 89 (86%) | 33 (72%) | 0.03 |
| Infarct size and distribution | ||||
| DE-CMR | ||||
| LV hyperenhancement (g) | 15 ± 12 | 19 ± 12 | 6 ± 6 | <0.001 |
| Hyperenhancement (% myocardium) | 12 ± 9 | 16 ± 8 | 5 ± 4 | <0.001 |
| Anterior wall involvement | 80 (53%) | 67 (64%) | 13 (27%) | <0.001 |
| Lateral wall involvement | 51 (34%) | 34 (33%) | 17 (35%) | 0.74 |
| Inferior wall involvement | 86 (57%) | 56 (54%) | 30 (63%) | 0.32 |
| Angiography | ||||
| Jeopardy score | 26 ± 11 | 29 ± 10 | 21 ± 11 | <0.001 |
| Infarct-related artery | ||||
| Left anterior descending | 84 (55%) | 67 (64%) | 17 (35%) | 0.001 |
| Left circumflex | 14 (9%) | 4 (4%) | 10 (21%) | 0.002 |
| Right coronary | 54 (36%) | 33 (32%) | 21 (44%) | 0.15 |
| Cardiovascular enzymes | ||||
| Creatine phosphokinase† | 2,284 ± 1,964 | 2,906 ± 2,043 | 968 ± 811 | <0.001 |
| LV function/geometry | ||||
| Ejection fraction (%) | 54 ± 11 | 51 ± 10 | 62 ± 8 | <0.001 |
| Wall motion score | 0.7 ± 0.5 | 0.9 ± 0.5 | 0.3 ± 0.3 | <0.001 |
| End-diastolic volume (ml/m2) | 76 ± 16 | 78 ± 16 | 69 ± 13 | 0.001 |
| End-systolic volume (ml/m2) | 36 ± 15 | 40 ± 15 | 27 ± 10 | <0.001 |
| Myocardial mass (g/m2) | 65 ± 13 | 67 ± 13 | 61 ± 11 | 0.003 |
Boldface indicates p values <0.05.
ACE = angiotensin converting enzyme; HMG-CoA = 3-hydroxy-3-methylglutaryl-coenzyme A; PCI = percutaneous coronary intervention.
Stratified based on consensus criteria for pathological QWDur (≥20 ms V2 to V3, ≥30 ms I, II, aVL, aVF, V4 to V6) and QWAmp (≥0.1 mV I, II, aVL, aVF, V4 to V6).16
Data available for 88% of population (n = 134).
Regarding infarct distribution, pathologic Q waves were more common with anterior wall infarction, whether assessed directly by DE-CMR or angiographically based on left anterior descending culprit vessel involvement (both p ≤0.001). In multivariate analysis, pathologic Q waves were independently associated with DE-CMR quantified global infarct size (odds ratio [OR] = 1.3 per %LV myocardium, 95% confidence interval [CI] = 1.2 to 1.4; p <0.001) after controlling for anterior wall involvement (OR = 1.5, 95% CI = 0.6 to 4.0; p = 0.38) (model chi-square = 65.6; p <0.001). Conventional assessment of infarct size and distribution demonstrated a similar relation, as evidenced by an independent association between Q waves and peak serum creatinine phosphokinase (OR = 1.1 per 100 u/L, 95% CI = 1.1 to 1.2; p <0.001) after controlling for left anterior descending infarction on angiography (OR = 1.7, 95% CI = 0.7 to 4.3; p = 0.23; model chisquare = 52.4; p <0.001).
Prevalence of pathologic Q waves, as scored based on presence or absence in any ECG lead, was similar between time points (72% vs 68%, p = 0.36). However, aggregate number of Q waves was slightly higher on early post-AMI ECG (1.4 ± 1.4) compared with follow-up (1.2 ± 1.2; p <0.01). Figure 1 compares Q-wave morphology between early and follow-up ECG. Consistent with decrements in absolute number of pathologic Q waves, total Q-wave amplitude (QWAmp; summed across ECG leads) was lower at follow-up (1.6 ± 1.6 vs 1.8 ± 1.4 mV; p = 0.03). However, there was only a trend toward lower total Q-wave duration (QWDur; 190 ± 109 vs 202 ± 105; p = 0.06), and total QWAr was similar between time points (39 ± 43 vs 41 ± 38 mV•ms; p = 0.29).
Figure 1.
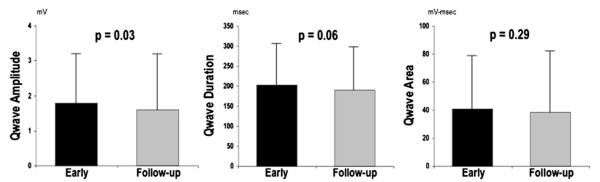
Q-wave evolution. QWAmp, QWDur, and QWAr as measured on early ECG (black bars) compared with follow-up ECG (gray bars). Data presented as mean ± SD.
As shown in Table 2, QWAr, an aggregate parameter accounting for both duration and amplitude, correlated with global infarct size on early and follow-up ECG. Similarly, global LV infarct size correlated with increases in both total QWAmp and QWDur. However, multivariate analysis demonstrated differences between time points: Early post-AMI, total QWAmp independently correlated with infarct size, whereas total QWDur did not. Conversely, QWDur on follow-up ECG independently correlated with infarct size, with nonsignificance for QWAmp.
Table 2.
Q-wave-based correlations with DE-CMR quantified infarct size
| Early After AMI | |||||
|---|---|---|---|---|---|
|
| |||||
| Q-wave Indices | Correlation (r) | p Value | Multivariate | ||
| QWAr | 0.49 | <0.001 | |||
| Adjusted QWAr | 0.52 | <0.001 | |||
| Model r = 0.52 |
|||||
| Partial r | β | p | |||
|
|
|||||
| QWDur | 0.46 | <0.001 | 0.11 | 0.15 | 0.17 |
| QWAmp | 0.51 | <0.001 | 0.28 | 0.39 | 0.001 |
| Model r = 0.56 |
|||||
| Partial r | β | p | |||
|
|
|||||
| Adjusted QWDur (Qw-dur/QRS-dur) | 0.43 | <0.001 | −0.07 | −0.10 | 0.42 |
| Adjusted QWAmp (Qw-amp/QRS-amp) | 0.55 | <0.001 | 0.39 | 0.64 | <0.001 |
|
| |||||
| Follow-Up After AMI | |||||
|
| |||||
| Q-wave indices | Correlation (r) | p | Multivariate | ||
|
| |||||
| QWAr | 0.44 | <0.001 | |||
| Adjusted QWAr | 0.51 | <0.001 | |||
| Model r = 0.52 |
|||||
| Partial r | β | p | |||
|
|
|||||
| QWDur | 0.51 | <0.001 | 0.30 | 0.45 | <0.001 |
| QWAmp | 0.44 | <0.001 | 0.06 | 0.08 | 0.49 |
| Model r = 0.51 |
|||||
| Partial r | β | p | |||
|
|
|||||
| Adjusted QWDur (Qw-dur/QRS-dur) | 0.50 | <0.001 | 0.16 | 0.28 | 0.049 |
| Adjusted QWAmp (Qw-amp/QRS-amp) | 0.49 | <0.001 | 0.15 | 0.25 | 0.08 |
QWAr increased stepwise in relation to global LV infarct size, whether quantified based on DE-CMR (Figure 2) or measured indirectly based on cardiac enzymes. Results were similar at each ECG time point (all p <0.001 for trend). Of note, QWAr increased markedly when patients were stratified using a DE-CMR infarct threshold of 10% LV myocardium, as evidenced by more than a threefold difference on early ECG (59 ± 39 vs 18 ± 20 mV•ms, p <0.001) and nearly a fivefold difference (59 ± 46 vs 13 ± 16 mV•ms, p <0.001) on follow-up. Stratification based on enzymatic infarct size demonstrated QWAr to similarly discriminate patients in the lowest creatinine phosphokinase quartile from the remainder of the population, with respective differences of threefold (50 ± 39 vs 17 ± 20 mV•ms) and 4.5-fold (49 ± 45 vs 11 ± 15 mV•ms) on early and late ECG (both p <0.001).
Figure 2.

QWAr in relation to global LV infarct size. (A) QWAr (mean ± SD), as measured on early ECG (top) and follow-up ECG (bottom), in relation to DE-CMR-evidenced infarct size. Note marked increase in QWAr among patients with infarct size ≥10% LV myocardium (black bars). (B) QWAr in relation to peak creatinine phosphokinase. Note stepwise increase in QWAr across population-based enzymatic quartiles, paralleling DE-CMR findings.
Figure 3 provides receiver operating characteristics curves for QWAr in relation to DE-CMR evidenced infarct size ≥10% LV myocardium. QWAr on both early (AUC = 0.84) and follow-up (AUC = 0.87). ECG demonstrated good diagnostic performance, with nonsignificant differences between time points (p = 0.49). As shown in Table 3, optimization of diagnostic sensitivity (95% to 98%) allowed QWAr to exclude the presence of ≥10% LV infarction in the overwhelming majority of patients, as evidenced by ≥90% negative predictive value at each ECG time point.
Figure 3.
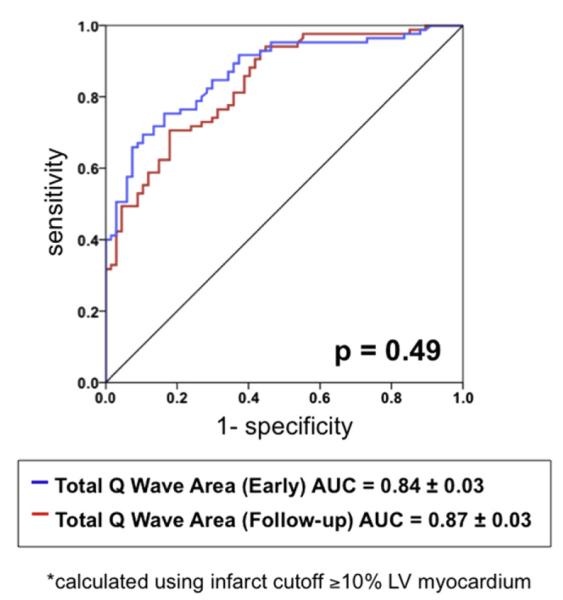
Receiver operator characteristics analysis. Diagnostic performance of QWAr, as measured on early (blue) and follow-up (red) ECG, for detection of infarct size ≥10% LV myocardium. (For interpretation of the references to color in this figure legend, the reader is referred to the web version of this article.)
Table 3.
Diagnostic performance of QWAr for ≥10% LV infarct
| Sensitivity | Specificity | Accuracy | Positive Predictive Value | Negative Predictive Value | |
|---|---|---|---|---|---|
| Early after AMI | |||||
| QWAr | 98% | 45% | 74% | 69% | 94% |
| >8.660 mV•msec* | |||||
| Follow-up | |||||
| QWAr | 95% | 52% | 76% | 72% | 90% |
| <5.385 mV•msec* |
Cutoff optimized for sensitivity/negative predictive value.
Discussion
This study provides new insights concerning the relation between global LV infarct burden and Q-wave morphology. Results demonstrate that LV infarct size is accompanied by stepwise increments in Q-wave morphology, with a marked (three- to fivefold) increase in QWAr at a threshold of 10% LV myocardium (p <0.001). QWAr quantified on both early and follow-up ECG demonstrated similar discriminatory capability for 10% global LV infarction (AUC = 0.84 to 0.87) and excellent negative predictive value (90% to 94%), despite time-dependent temporal changes in individual components of QWDur and QWAmp.
To the best of our knowledge, all previous studies that have compared DE-CMR and ECG data have either categorized Q waves in a binary fashion or incorporated Q-wave data into multifaceted scoring systems.8–14 Consistent with our findings, data in smaller cohorts have demonstrated patients with pathologic Q waves to have larger infarcts on DE-CMR.8–10 However, although these studies measured infarct size on DE-CMR as a continuous variable, Q waves were categorized as present or absent, prohibiting evaluation of linear relations between infarct burden and Q waves. Our study used a different approach in which both ECG and DE-CMR were independently analyzed using quantitative methods, enabling variables from both methods to be measured in a continuous fashion.
Concerning ECG manifestations of LV infarct size, our data highlight the importance of time-dependent changes in Q-wave morphology. Although infarct size independently correlated with total QWAmp (partial r = 0.28, p = 0.001) measured early post-AMI, follow-up ECG demonstrated an independent correlation with QWDur (partial r = 0.30, p <0.001). Time-dependent differences in ECG or DE-CMR multivariate models were paralleled by a significant reduction in QWAmp between early and follow-up ECG. Although exact mechanisms are not established, it is likely that dynamic changes in Q-wave morphology relate to post-AMI remodeling, with resultant alterations in electroanatomical conduction. Infarct shrinkage is known to occur after AMI, as evidenced by studies reporting 14% to 37% reductions in hyperenhancement size between early and follow-up DE-CMR.12,22,23 It is possible that infarct shrinkage may reduce QWAmp, with lesser reductions in QWDur resulting in nonsignificant changes in QWAr (Δ = 2.4 ± 28 mV•ms, p = 0.29) as observed in our study. Regardless of mechanism, our data demonstrate DE-CMR quantified infarct size to manifest near equivalent correlations between QWAr as measured on early (r = 0.49 to 0.52, p <0.001) and follow-up (r = 0.44 to 0.51, p <0.001) ECG, supporting use of this integrated geometric parameter for study of global infarct burden.
The moderate correlation between DE-CMR and QWAr observed in our population is consistent with previous studies that have used ECG scoring systems to estimate infarct size.11–14 However, although such scoring systems incorporate both QWAmp and QWDur, they also encompass multiple other aspects of the ECG waveform, yielding uncertainty as to whether the Q wave alone can be used as a marker of infarct burden. Additionally, previous studies have reported variable magnitude of correlation between DE-CMR and ECG infarct score (r = 0.33 to 0.79).11–14 Our data suggest that one reason for difference in agreement between ECG and DE-CMR may relate to infarct size: QWAr differed three- to fivefold among patients stratified using a threshold of 10% LV myocardium and demonstrated lesser magnitude of difference among patients further stratified above or below this cutoff.
Our finding of a threshold effect of 10% LV infarction on QWAr bears important implications for clinical risk stratification. Previous outcomes studies have demonstrated DE-CMR quantified infarct size to stratify arrhythmic risk, with a threshold based approach shown to stratify risk independent of LV ejection fraction.3 Consistent with this concept, a 10% infarct threshold has been used in an active multicenter study (Defibrillators to Reduce Risk by Magnetic Resonance Imaging Evaluation—DETERMINE ICD), designed to test whether DE-CMR can be used to stratify need for implantable cardioverter defibrillator.24 Although CMR is established as a precise tool for infarct quantification,6,7 broad clinical application would bear substantial economic costs and would be contraindicated in a substantial number of patients. Our results demonstrate that available data from 12-lead surface ECG, routinely obtained after AMI at a fraction of the cost of CMR, can be used to exclude a large majority of patients with high (≤10% infarct) burden. Thus, it is plausible that an integrated strategy of ECG screening (using a high sensitivity/negative predictive value threshold for QWAr) could be useful as a first-line screen for stratification of infarct burden. DE-CMR could then be reserved for at-risk patients with large QWAr, thereby optimizing diagnostic strengths of each method while minimizing cost. It should be noted that applicability of this approach is limited by the requirement of ECG-processing software that is not yet in widespread clinical use. However, established methods for ECG-based infarct size assessment are similarly dependent on the use of ECG-processing software for practical application.25,26 Future studies are warranted to test the prognostic utility of integrated ECG-based risk stratification of LV infarct burden for arrhythmogenic risk assessment.
Footnotes
Disclosures The authors have no conflicts of interest to disclose.
References
- 1.Cheong BY, Muthupillai R, Wilson JM, Sung A, Huber S, Amin S, Elayda MA, Lee VV, Flamm SD. Prognostic significance of delayed-enhancement magnetic resonance imaging: survival of 857 patients with and without left ventricular dysfunction. Circulation. 2009;120:2069–2076. doi: 10.1161/CIRCULATIONAHA.109.852517. [DOI] [PubMed] [Google Scholar]
- 2.Steel K, Broderick R, Gandla V, Larose E, Resnic F, Jerosch-Herold M, Brown KA, Kwong RY. Complementary prognostic values of stress myocardial perfusion and late gadolinium enhancement imaging by cardiac magnetic resonance in patients with known or suspected coronary artery disease. Circulation. 2009;120:1390–1400. doi: 10.1161/CIRCULATIONAHA.108.812503. [DOI] [PMC free article] [PubMed] [Google Scholar]
- 3.Klem I, Weinsaft JW, Bahnson TD, Hegland D, Kim HW, Hayes B, Parker MA, Judd RM, Kim RJ. Assessment of myocardial scarring improves risk stratification in patients evaluated for cardiac defibrillator implantation. J Am Coll Cardiol. 2012;60:408–420. doi: 10.1016/j.jacc.2012.02.070. [DOI] [PMC free article] [PubMed] [Google Scholar]
- 4.Wu E, Ortiz JT, Tejedor P, Lee DC, Bucciarelli-Ducci C, Kansal P, Carr JC, Holly TA, Lloyd-Jones D, Klocke FJ, Bonow RO. Infarct size by contrast enhanced cardiac magnetic resonance is a stronger predictor of outcomes than left ventricular ejection fraction or end-systolic volume index: prospective cohort study. Heart. 2008;94:730–736. doi: 10.1136/hrt.2007.122622. [DOI] [PubMed] [Google Scholar]
- 5.Iles L, Pfluger H, Lefkovits L, Butler MJ, Kistler PM, Kaye DM, Taylor AJ. Myocardial fibrosis predicts appropriate device therapy in patients with implantable cardioverter-defibrillators for primary prevention of sudden cardiac death. J Am Coll Cardiol. 2011;57:821–828. doi: 10.1016/j.jacc.2010.06.062. [DOI] [PubMed] [Google Scholar]
- 6.Kim RJ, Fieno DS, Parrish TB, Harris K, Chen EL, Simonetti O, Bundy J, Finn JP, Klocke FJ, Judd RM. Relationship of MRI delayed contrast enhancement to irreversible injury, infarct age, and contractile function. Circulation. 1999;100:1992–2002. doi: 10.1161/01.cir.100.19.1992. [DOI] [PubMed] [Google Scholar]
- 7.Fieno DS, Kim RJ, Chen EL, Lomasney JW, Klocke FJ, Judd RM. Contrast-enhanced magnetic resonance imaging of myocardium at risk: distinction between reversible and irreversible injury throughout infarct healing. J Am Coll Cardiol. 2000;36:1985–1991. doi: 10.1016/s0735-1097(00)00958-x. [DOI] [PubMed] [Google Scholar]
- 8.Kaandorp TA, Bax JJ, Lamb HJ, Viergever EP, Boersma E, Poldermans D, van der Wall EE, de Roos A. Which parameters on magnetic resonance imaging determine Q waves on the electrocardiogram? Am J Cardiol. 2005;95:925–929. doi: 10.1016/j.amjcard.2004.12.028. [DOI] [PubMed] [Google Scholar]
- 9.Moon JC, De Arenaza DP, Elkington AG, Taneja AK, John AS, Wang D, Janardhanan R, Senior R, Lahiri A, Poole-Wilson PA, Pennell DJ. The pathologic basis of Q-wave and non-Q-wave myocardial infarction: a cardiovascular magnetic resonance study. J Am Coll Cardiol. 2004;44:554–560. doi: 10.1016/j.jacc.2004.03.076. [DOI] [PubMed] [Google Scholar]
- 10.Florian A, Slavich M, Masci PG, Janssens S, Bogaert J. Electrocardiographic Q-wave “remodeling” in reperfused ST-segment elevation myocardial infarction: validation study with CMR. JACC Cardiovasc imaging. 2012;5:1003–1013. doi: 10.1016/j.jcmg.2012.02.018. [DOI] [PubMed] [Google Scholar]
- 11.Carlsen EA, Bang LE, Ahtarovski KA, Engstrom T, Kober L, Kelbaek H, Vejlstrup N, Jorgensen E, Helqvist S, Saunamaki K, Clemmensen P, Holmvang L, Wagner GS, Lonborg J. Comparison of Selvester QRS score with magnetic resonance imaging measured infarct size in patients with ST elevation myocardial infarction. J Electrocardiol. 2012;45:414–419. doi: 10.1016/j.jelectrocard.2012.03.007. [DOI] [PubMed] [Google Scholar]
- 12.Bang LE, Ripa RS, Grande P, Kastrup J, Clemmensen PM, Wagner GS. Comparison of infarct size changes with delayed contrast-enhanced magnetic resonance imaging and electrocardiogram QRS scoring during the 6 months after acutely reperfused myocardial infarction. J Electrocardiol. 2008;41:609–613. doi: 10.1016/j.jelectrocard.2008.06.011. [DOI] [PubMed] [Google Scholar]
- 13.Strauss DG, Selvester RH, Lima JA, Arheden H, Miller JM, Gerstenblith G, Marban E, Weiss RG, Tomaselli GF, Wagner GS, Wu KC. ECG quantification of myocardial scar in cardiomyopathy patients with or without conduction defects: correlation with cardiac magnetic resonance and arrhythmogenesis. Circ Arrhythm Electrophysiol. 2008;1:327–336. doi: 10.1161/CIRCEP.108.798660. [DOI] [PMC free article] [PubMed] [Google Scholar]
- 14.Engblom H, Hedstrom E, Heiberg E, Wagner GS, Pahlm O, Arheden H. Size and transmural extent of first-time reperfused myocardial infarction assessed by cardiac magnetic resonance can be estimated by 12-lead electrocardiogram. Am Heart J. 2005;150:920. doi: 10.1016/j.ahj.2005.07.022. [DOI] [PubMed] [Google Scholar]
- 15.Thygesen K, Alpert JS, Jaffe AS, Simoons ML, Chaitman BR, White HD. Third universal definition of myocardial infarction. Eur Heart J. 2012;33:2551–2567. doi: 10.1093/eurheartj/ehs184. [DOI] [PubMed] [Google Scholar]
- 16.Graham MM, Faris PD, Ghali WA, Galbraith PD, Norris CM, Badry JT, Mitchell LB, Curtis MJ, Knudtson ML. Validation of three myocardial jeopardy scores in a population-based cardiac catheterization cohort. Am Heart J. 2001;142:254–261. doi: 10.1067/mhj.2001.116481. [DOI] [PubMed] [Google Scholar]
- 17.Kligfield P, Gettes LS, Bailey JJ, Childers R, Deal BJ, Hancock EW, van Herpen G, Kors JA, Macfarlane P, Mirvis DM, Pahlm O, Rautaharju P, Wagner GS, Josephson M, Mason JW, Okin P, Surawicz B, Wellens H. Recommendations for the standardization and interpretation of the electrocardiogram: part I: the electrocardiogram and its technology: a scientific statement from the American Heart Association Electrocardiography and Arrhythmias Committee, Council on Clinical Cardiology; the American College of Cardiology Foundation; and the Heart Rhythm Society: endorsed by the International Society for Computerized Electrocardiology. J Am Coll Cardiol. 2007;49:1109–1127. doi: 10.1016/j.jacc.2007.01.024. [DOI] [PubMed] [Google Scholar]
- 18.Amado LC, Gerber BL, Gupta SN, Rettmann DW, Szarf G, Schock R, Nasir K, Kraitchman DL, Lima JA. Accurate and objective infarct sizing by contrast-enhanced magnetic resonance imaging in a canine myocardial infarction model. J Am Coll Cardiol. 2004;44:2383–2389. doi: 10.1016/j.jacc.2004.09.020. [DOI] [PubMed] [Google Scholar]
- 19.Chinitz JA, Chen D, Goyal P, Wilson S, Islam F, Venkatesh P, Hurtado-Ura S, Nguyen T, Wang Y, Cham M, Levine RA, Devereux RB, Weinsaft JW. Mitral apparatus assessment by delayed enhancement CMR—Relative impact of infarct distribution on ischemic mitral regurgitation. JACC Cardiovasc Imaging. 2013;6:220–234. doi: 10.1016/j.jcmg.2012.08.016. [DOI] [PMC free article] [PubMed] [Google Scholar]
- 20.Kim RJ, Wu E, Rafael A, Chen EL, Parker MA, Simonetti O, Klocke FJ, Bonow RO, Judd RM. The use of contrast-enhanced magnetic resonance imaging to identify reversible myocardial dysfunction. N Engl J Med. 2000;343:1445–1453. doi: 10.1056/NEJM200011163432003. [DOI] [PubMed] [Google Scholar]
- 21.Hanley JA, McNeil BJ. The meaning and use of the area under a receiver operating characteristic (ROC) curve. Radiology. 1982;143:29–36. doi: 10.1148/radiology.143.1.7063747. [DOI] [PubMed] [Google Scholar]
- 22.Baks T, van Geuns RJ, Biagini E, Wielopolski P, Mollet NR, Cademartiri F, van der Giessen WJ, Krestin GP, Serruys PW, Duncker DJ, de Feyter PJ. Effects of primary angioplasty for acute myocardial infarction on early and late infarct size and left ventricular wall characteristics. J Am Coll Cardiol. 2006;47:40–44. doi: 10.1016/j.jacc.2005.09.008. [DOI] [PubMed] [Google Scholar]
- 23.Ripa RS, Nilsson JC, Wang Y, Sondergaard L, Jorgensen E, Kastrup J. Short- and long-term changes in myocardial function, morphology, edema, and infarct mass after ST-segment elevation myocardial infarction evaluated by serial magnetic resonance imaging. Am Heart J. 2007;154:929–936. doi: 10.1016/j.ahj.2007.06.038. [DOI] [PubMed] [Google Scholar]
- 24.Kadish AH, Bello D, Finn JP, Bonow RO, Schaechter A, Subacius H, Albert C, Daubert JP, Fonseca CG, Goldberger JJ. Rationale and design for the Defibrillators to Reduce Risk by Magnetic Resonance Imaging Evaluation (DETERMINE) trial. J Cardiovasc Electrophysiol. 2009;20:982–987. doi: 10.1111/j.1540-8167.2009.01503.x. [DOI] [PMC free article] [PubMed] [Google Scholar]
- 25.Loring Z, Chelliah S, Selvester RH, Wagner G, Strauss DG. A detailed guide for quantification of myocardial scar with the Selvester QRS score in the presence of electrocardiogram confounders. J Electrocardiol. 2011;44:544–554. doi: 10.1016/j.jelectrocard.2011.06.008. [DOI] [PMC free article] [PubMed] [Google Scholar]
- 26.Horacek BM, Warren JW, Albano A, Palmeri MA, Rembert JC, Greenfield JC, Jr, Wagner GS. Development of an automated Selvester Scoring System for estimating the size of myocardial infarction from the electrocardiogram. J Electrocardiol. 2006;39:162–168. doi: 10.1016/j.jelectrocard.2005.08.013. [DOI] [PubMed] [Google Scholar]