Abstract
Objective
Estimates of radiation absorbed dose to organs of the nuclear medicine patient are a requirement for administered activity optimization and for stochastic risk assessment. Pediatric patients, and in particular the newborn child, represent that portion of the patient population where such optimization studies are most crucial owing to the enhanced tissue radiosensitivities and longer life expectancies of this patient subpopulation. In cases where whole-body CT imaging is not available, phantom-based calculations of radionuclide S values – absorbed dose to a target tissue per nuclear transformation in a source tissue – are required for dose and risk evaluation. In this study, a comprehensive model of electron and photon dosimetry of the reference newborn child is presented based on a high-resolution hybrid-voxel phantom from the University of Florida patient model series.
Methods
Values of photon specific absorbed fraction (SAF) were assembled for the both the reference male and female newborn using the radiation transport code MCNPX v2.6. Values of electron specific absorbed fraction were assembled in a unique and time-efficient manner whereby the collisional and radiative components of organ dose – for both self and cross dose terms – were computed separately. Dose to the newborn skeletal tissues were assessed via fluence-to-dose response functions reported for the first time in this study.
Results
Values of photon and electron specific absorbed fractions were used to assemble a complete set of S values for some 16 radionuclides commonly associated with molecular imaging of the newborn. These values were then compared to those available in the OLINDA/EXM software. S value ratios for organ self-dose ranged from 0.46 to 1.42, while similar ratios for organ cross-dose varied from a low of 0.04 to a high of 3.49. These large discrepancies are due in large part to the simplistic organ modeling in the stylized newborn model used in the OLINDA/EXM software.
Conclusion
A comprehensive model of internal dosimetry is presented in this study for the newborn nuclear medicine patient based upon the UF hybrid computational phantom. Photon dose-response functions, photon and electron specific absorbed fractions, and tables of radionuclide S values for the newborn child – both male and female – are given in a series of four electronic annexes. These values can be applied to optimization studies of image quality and stochastic risk for this most vulnerable class of pediatric patients.
Keywords: Internal dosimetry, radiation transport, computational phantom, newborn patient, radionuclide S value
1. Introduction
In the majority of cases, the medical benefit of diagnostic molecular imaging far exceeds any residual stochastic risk from radiation doses incurred by the patient (Zanzonico 2010). Nevertheless, dose reduction and, more importantly optimization of image quality and radiation exposure, are particularly important for pediatric nuclear medicine patients (Treves et al 2008; Treves 2007; Gelfand et al 2010; Sgouros et al in press). Children are at higher risk for induction of secondary cancers owing to the enhanced radiosensitivity of their tissues and their longer projected lifespan. In general, the administered activity (AA) for a pediatric patient is determined by scaling an adult value with respect to patient body mass or surface area (Treves 2007). These scaling approaches are typically applied for patients over 1 year of age. The concept of “minimal total dose” is used when determining the AA for newborn patients because, at a certain point, the AA becomes too low to produce images of diagnostic value. Newborns are given special consideration in pediatric imaging due to their small overall size, differences in metabolic patterns (e.g., lower glomerular filtration rates), faster washout of radioactive gases from the lungs, and more rapid blood circulation times. Additionally, newborns experience a wide array of diseases, many not typically seen in older pediatric patients or adults, and molecular imaging procedures are more likely to be used for this age group (Treves et al 2011). Resultantly, particular attention should be paid to both optimal imaging of the newborn patient, as well as the calculation of radionuclide S values using computational phantoms unique to the newborn anatomy and tissue structures.
Organ doses to a reference newborn patient – as defined in Publication 23 (ICRP 1975) of the International Commission on Radiological Protection – are currently provided in the commercial software code OLINDA (Stabin et al 2005). The present version of the code utilizes photon specific absorbed fractions given for the Oak Ridge National Laboratory stylized newborn phantom published by Cristy and Eckerman (Cristy and Eckerman 1987). Electron SAFs for individual organs in the newborn phantom in OLINDA are based upon estimates of electron self-dose for unit density tissue spheres of various sizes (Stabin and Siegel 2003). The International Commission on Radiological Protection (ICRP) in their Publications 53, 62, 80, and 106, has also published extensive data on organ doses from radiopharmaceuticals to its series of reference persons (ICRP 1988,1992,1998, 2008a). The youngest person considered in the ICRP report series, however, is the 1-year-old, and thus no ICRP dose estimates exist for the newborn patient. Values of photon SAF and radiopharmaceutical S values were additionally calculated using a voxel phantom of an 8-week female (4.2 kg and 57 cm in length) from the National Research Centre for Environment and Health in Munich, Germany (Smith et al 2000). In that study, substantial variations in organ dose were noted between the GSF BABY phantom and the ORNL stylized newborn due to corresponding differences in organ shape, depth, and position within the body. Lesser variations between phantom types were noted for comparisons of the resulting effective dose.
In the present study, a comprehensive investigation of photon and electron internal dosimetry of the newborn patient – as defined in ICRP Publication 89 (ICRP 2002) – is presented for use in nuclear medicine dose estimates. The study employed the University of Florida (UF) computational hybrid phantom of the newborn child – both male and female – for simulations of photon and electron radiation transport. These phantoms are based upon image segmentation of a 6-day newborn cadaver, originally used to construct the voxel-based phantom of Nipper et al (2002). In a subsequent study by Lee et al (2007a), this phantom was extended to a hybrid format using combinations of polygon mesh (PM) and non-uniform rational B-spline (NURBS) surfaces. Body dimensions and organ volumes were adjusted to conform to reference data given for the newborn child in ICRP Publication 89 (ICRP 2002). The present study also extends the skeletal modeling work of Pafundi et al (2009; 2010) in formulating fluence-to-dose response functions for the newborn skeleton for three target tissues – active bone marrow, total shallow marrow, and newborn cartilage. Specific absorbed fractions for both internal photon and electron sources are provided in electronic annexes, along with an extensive set of radionuclide S values associated with radiopharmaceuticals typically used in molecular imaging of the newborn child. source and target tissues given in the annexes conform to the nomenclature given in ICRP Publication 110 for the ICRP reference adult voxel phantoms (ICRP 2009).
2. Materials and Methods
2.1 Skeletal Photon Dose Response Functions
Since the microarchitecture of marrow cavities and bone trabeculae within newborn spongiosa cannot be explicitly modeled in the NURBS/PM environment, another technique was used to incorporate these tissue structures within the newborn phantom – the skeletal photon dose response function (DRF). A DRF is an energy-dependent function providing a pre-calculation of absorbed dose to a particular microscopic tissue site per unit of measure to a corresponding macroscopic tissue site. In this case, the dose is computed to radiosensitive skeletal tissues per unit photon fluence in newborn spongiosa and long-bone medullary cavities. In this study, the DRF formulation presented in Johnson et al (2011) was employed along with intra-skeletal electron absorbed fractions assembled for the newborn skeleton by Pafundi et al (2010) for three target tissues – active marrow (AM), total shallow marrow (TM50), and unossified cartilage (CART). These anatomic regions serve as surrogate tissues for the hematopoietic stem cells, osteoprogenitor cells, and chondrocytes, respectively. In the diagnostic photon energy range (<200 keV), photoelectric events are more prevalent in the osseous tissues of the bone trabeculae (e.g., higher Z elements), where electrons liberated in the bone trabeculae irradiate adjacent bont marrow cavities. This enhancement of bone marrow dose over dose estimates based upon the kerma approximation is uniquely handled within the dose response function methodology.
2.2 Photon Specific Absorbed Fractions
2.2.1 Phantom Preparation
Monte Carlo N-Particle eXtended (MCNPX) version 2.6 (Los Alamos National Laboratory, Los Alamos, NM, USA) was the radiation transport code of choice for these simulations. At present, MCNPX v2.6 cannot handle 3D surfaces in NURBS or PM format, and thus the newborn hybrid phantoms had be converted to a voxelized format. Consequently, the NURBS/PM-based phantoms were first exported by the NURBS modeling software Rhinoceros™ (McNeel & Associates, Seattle, WA) as a raw polygon-mesh file. For those tissues originally modeled via NURBS surfaces (e.g., liver), a NURBS to PM conversion of the organ contours was performed. For those tissues originally modeled as PM surfaces (e.g., skeleton), the original vertices of the PM were stored directly. Next, an in-house MATLAB™ (The Mathworks, Inc., Natick, MA, USA) code was then used to convert the raw PM models to voxel models at an isotropic voxel resolution equivalent to the reference skin thickness of the newborn child (0.663 mm) (Lee et al 2010). The skin of the phantoms is not modeled explicitly in NURBS format, and so an in-house MATLAB™ code was employed for this purpose. This code replaces the outermost layer of non-air voxels with skin voxels, while avoiding regions over the eyes. The resulting hybrid-voxel phantoms were then examined using ImageJ (National Institutes of Health, Bethesda, MD, USA), an image processing software package, where any artifacts introduced during voxelization were manually corrected. Finally, another in-house MATLAB™ code was used to place lymph nodes into the phantoms as described by Lee et al. (2009b).
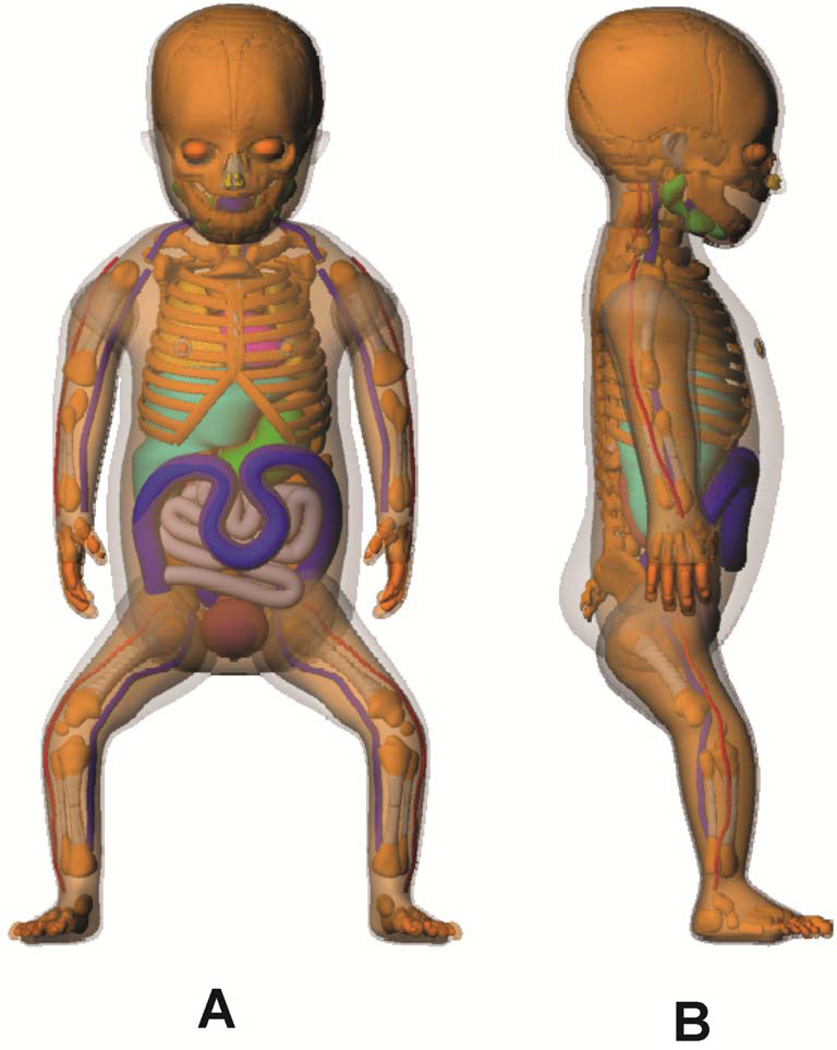
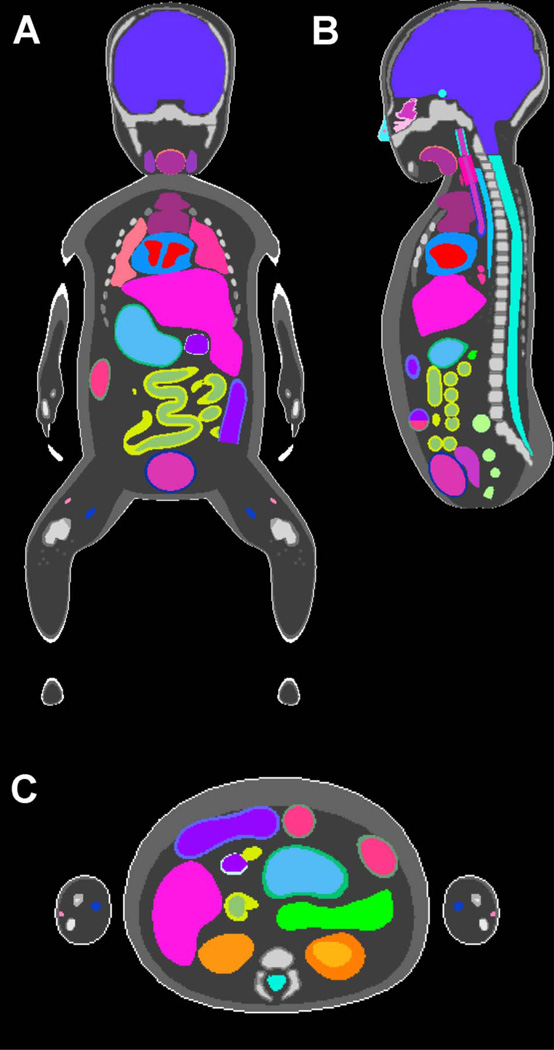
Both the NURBS and voxelized versions of the UF newborn female phantom are shown in Figures 1 and 2, respectively. Density and mass information for the newborn phantoms have been previously detailed in Lee et al (2007a). The pediatric lymph nodes were modeled using a similar method developed for adult lymph nodes (Lee et al 2009a). A total of 16 different lymph node sites were considered including extrathoracic, cervical, upper and lower sites for thoracic, and right and left sites for breast, mesentery, axiliary, cubital, inguinal, and popliteal regions. The reference lymphatic node mass of the newborn phantom, 10 g, was calculated by downscaling the reference mass from the adult value, 210 g, which was derived from the masses of the lymphatic nodes in extrathoracic and thoracic regions (ICRP 1994) and the total number of lymphatic node sites. The average size of a single lymphatic node, 0.24 cm in radius, was downscaled by the width of the phantom from the value of the UF reference adult phantom (Hurtado et al in press). An in-house MATLAB code, Lymphatic Node Generator, was used to create the lymphatic nodes within the voxelized newborn phantoms node-by-node until the total reference mass of the lymphatic nodes were matched. Masses and nodel numbers for the newborn lymphatic nodes, newly created for this study, are given in Table 1. The listed nodal numbers are the targeted nodal numbers, and so the differences between nodal masses for the male and female newborn phantom are due to the random processes utilized in the lymph node generator code (Lee et al 2009b). Final reference masses will be documented in a future publication.
Figure 1.
(A) Front and (B) side 3D views of the UF hybrid-NURBS/PM newborn female phantom.
Figure 2.
(A) Coronal, (B) sagittal, and (C) axial views of the UF hybrid-voxel newborn female phantom.
Table 1.
Masses and numbers of lymphatic nodes in the UF newborn hybrid phantom as indicated by their anatomical location.
| Node Mass (g) |
|||
|---|---|---|---|
| Lymphatic Node Site | Number of Nodes | Male | Female |
| Extrathoracic | 12 | 0.45 | 0.60 |
| Cervical | 10 | 1.36 | 0.90 |
| Upper thoracic | 6 | 0.04 | 0.02 |
| Lower thoracic | 18 | 0.09 | 0.03 |
| Right breast | 8 | 0.60 | 0.60 |
| Left breast | 8 | 0.60 | 0.60 |
| Right mesentery | 38 | 0.26 | 0.23 |
| Left mesentery | 38 | 0.26 | 0.23 |
| Right axiliary | 11 | 0.75 | 0.98 |
| Left axiliary | 11 | 0.75 | 0.98 |
| Right cubital | 8 | 0.45 | 0.38 |
| Left cubital | 8 | 0.45 | 0.38 |
| Right inguinal | 14 | 0.90 | 1.21 |
| Left inguinal | 14 | 0.90 | 1.21 |
| Right popliteal | 9 | 1.05 | 0.90 |
| Left popliteal | 9 | 1.05 | 0.90 |
2.2.2 Transport Methods
Specific absorbed fractions (SAFs) are calculated as the ratio of the fraction of energy emitted by a source organ that is deposited in a target organ, and the mass of the target organ. To gather the required data for MCNPX, source files were first generated using an in-house MATLAB™ code which specify the voxel coordinates of the source organ as well as its corresponding sampling probability. For most source organs, the sampling probability was set to unity (i.e., uniform sampling). Non-unity sampling probabilities were assigned to newborn spongisoa and medullary marrow to accommodate the unique newborn skeletal source tissues of active marrow (AM), trabecular bone surfaces (TBS), cortical bone surfaces (CBS), trabecular bone volume (TBV), and cortical bone volume (CBV). These probabilities were made consistent with their fractional volumes (inclusive of miscellaneous skeletal tissues) as reported in Pafundi et al (2009). Volume-averaged and energy-dependent photon fluence was tracked over all individual spongiosa and medullary cavity sites, after which the skeletal DRFs were applied to calculate SAF values for these skeletal tissues.
SAFs to non-skeletal targets were determined by a combination of tracking energy deposition per unit mass averaged over the target organ of interest and total energy deposition in the target organ of interest. Energy deposition per unit mass used in conjuncton with photon-only transport in MCNPX assumes that all secondary electrons created by the incident photons are locally deposited and any bremsstrahlung radiation from the secondary electrons are banked for later transport (Hendricks et al 2005; Pelowitz 2005). This approximation is valid for photon energies that create relatively low-energy secondary electrons with ranges considered short in relation to target tissue dimensions. For high-energy photons, secondary electron escape becomes a factor, and total energy deposition in conjunction with full photon-electron transport is necessary. Full photon-electron transport requires more computer time than photon-only transport since the former follows secondary electron tracks in their entirety. Consequently, photon-only simulation affords the ability to increase the number of photons started at the same computational cost as photon-electron transport, thereby decreasing the resultant uncertainties. A threshold photon energy of 100 keV was used as the point at which photon-only transport was abandoned in favor of full photon-electron transport. This energy threshold was determined by comparing the SAFs from a liver source to various source tissues as given from both full and photon-only transport at various particle source energies. Differences between results from both simulations at a photon energy of 100 keV were found to be ∼1%.
A total of 89 source organs were modeled for the newborn male and female phantoms at 21 monoenergetic photon energies ranging from 10 keV to 4 MeV. Since the male and female phantoms were almost structurally identical,1 78 source organs were common to both phantoms, and only 11 were gender-specific. Composite sources such as the blood, kidneys, colon, and lymph nodes were calculated based on the relative contribution of their anatomic consituents. The methodology for creating the whole-body blood source will be detailed in a subsequent publication. The source organs selected for simulation are shown in Table 2, and the target organs selected for energy deposition tracking are shown in Table 3. The number of histories (NPS) needed to ensure sufficiently reliable statistics was determined. An NPS function was developed with an initial value of 108 particles for the photon energy of 10 keV and a final value of 107 particles for the photon energy of 4 MeV. The Integrated Tiger Series (ITS)-style “nearest bin” energy indexing algorithm was used for the treatment of secondary electrons, and a secondary electron energy cutoff of 1 keV was applied. All simulations were performed on an PSSC Laboratory (Lake Forest, CA) blade cluster running sixty-four 2 GHz processors with 2 GB of memory per processor.
Table 2.
Source organs simulated in the newborn phantom. Sources and acronyms from ICRP Publication 110 were used (ICRP 2009).
| Acronym | Source Region | Notes |
|---|---|---|
| Adipose | Adipose/residual tissue | |
| Adrenals | RAdrenal + LAdrenal | |
| AI | Alveolar-interstitium | Left (L) + right (R) lungs used as surrogate tissue. |
| AV | Large arteries and veins | |
| Blood | Whole body blood | Weighted average of miscellaneous source regions. Male (M) and female (F) specific source. |
| Brain | Brain | |
| Brchiole-f | Bronchioles fast | L + R lungs used as surrogate tissue. |
| Brchiole-s | Bronchioles slow | Equal to Brchiole-f. |
| Brchiole-b | Bronchioles bound | Equal to Brchiole-f. |
| Brchiole-q | Bronchioles sequestered | Equal to Brchiole-f. |
| Breast | Breast-a + Breast-g | M + F specific source. |
| Bronch | Bronchi only | |
| Bronchi-f | Bronchi fast | Weighted average of bronchi and trachea. |
| Bronchi-s | Bronchi slow | Equal to Bronchi-f. |
| Bronchi-b | Bronchi bound | Equal to Bronchi-f. |
| Bronchi-q | Bronchi sequestered | Equal to Bronchi-f. |
| Bronchial | Bronchial region | L + R lungs, bronchi, and trachea. |
| Cartilage | Cartilage | Weighted average of Cartilage-b and Cartilage-o. |
| Cartilage-b | Bone-associated cartilage | Cartilage part of the developing skeleton only found in the newborn. |
| Cartilage-o | Other cartilage | Cartilage common to most ages. |
| C-bone-S | Cortical bone mineral surface | Equal to C-bone-V. |
| C-bone-V | Cortical bone mineral volume | |
| Colon-cont | Colon contents | Weighted average of LC-cont, RC-cont, and RSig-cont. |
| Colon-wall | Colon wall | Weighted average of LC-wall, RC-wall, and RSig-wall. |
| ET | Extrathoracic region | Weighted average of ET1-sur and ET2-sur. |
| ET1-sur | Surface of anterior nasal passages | |
| ET2-sur | Surface of posterior nasal passages + pharynx |
|
| ET2-seq | Sequestered ET2 region | Equal to ET2-sur. |
| Eye-lens | Lenses of eye | |
| GB-cont | Gall bladder contents | |
| GB-wall | Gall bladder wall | |
| Ht-cont | Blood in heart | |
| Ht-wall | Heart wall | |
| Kidney-C | RKidney cortex + LKidney cortex | |
| Kidney-M | RKidney medulla + LKidney medulla |
|
| Kidney-P | RKidney pelvis + LKidney pelvis | |
| Kidneys | RKidney + LKidney | Weighted average of Kidney-C, Kidney-M, and Kidney-P. |
| LC-cont | Left colon contents | |
| LC-wall | Left colon wall | |
| Liver | Liver | |
| LN-ET | Lymph nodes in ET region | M + F specific source. |
| LN-Th | Lymph nodes in thoracic region | M + F specific source. |
| Lymph | Lymph nodes, except LN-ET + LN- TH |
M + F specific source. |
| LN-Total | All lymph node regions | Weighted average of LN-ET, LN-TH, and other Lymph. M + F specific source. |
| Lungs | RLung + LLung | |
| Marrow | Bone marrow | |
| Muscle | Muscle | |
| Oesophagus-f | Oesophagus fast | Equal to Oesophagus. |
| Oesophagus-s | Oesophagus slow | Equal to Oesophagus. |
| Oesophagus | Oesophagus wall | |
| Ovaries | ROvary + LOvary | |
| Pancreas | Pancreas | |
| P-gland | Pituitary gland | |
| Prostate | Prostate | |
| RC-cont | Right colon contents | |
| RC-wall | Right colon wall | |
| ROB | Rest of body | Miscellaneous tissues used in the blood source. M + F specific source. |
| RSig-cont | Rectosigmoid colon contents | |
| RSig-wall | Rectosigmoid colon wall | |
| S-glands | Salivary glands | Parotid, submaxillary, and sublingual salivary glands. |
| SI-cont | Small intestine contents | |
| SI-wall | Small intestine wall | |
| Skin | Skin | |
| Sp-cord | Spinal cord | |
| Spleen | Spleen | |
| St-cont | Stomach contents | |
| St-wall | Stomach wall | |
| S-tissue | Soft tissue (T-body - mineral bone) | T-body minus mineral bone sources. M + F specific source. |
| T-body | Total body tissues (total body minus contents of walled organs) |
Weighted average of all unique soft tissue sources minus contents of walled organs. M + F specific source. |
| T-bone-S | Trabecular bone mineral surface | |
| T-bone-V | Trabecular bone mineral volume | |
| Testes | Testes | |
| Thymus | Thymus | |
| Thyroid | Thyroid | |
| Trachea | Trachea | |
| UB-cont | Urinary bladder contents | M + F specific source. |
| UB-wall | Urinary bladder wall | M + F specific source. |
| Uterus | Uterus/cervix |
Table 3.
Target organs simulated in the newborn phantom. Targets and acronyms from ICRP Publication 110 were used (ICRP 2009).
| Acronym | Target Region | Notes |
|---|---|---|
| Adipose | Adipose/residual tissue | |
| Adrenals | RAdrenal + LAdrenal | |
| AI | Alveolar-interstitium | Left (L) + right (R) lungs used as surrogate tissue. |
| Brain | Brain | |
| Breast | Breast-a + Breast-g | Male (M) + female (F) specific source. |
| Bronchial | Bronchial tissues | L + R lungs, bronchi, and trachea. |
| Brchiol-sec | Secretory cells of bronchioles | L + R lungs used as surrogate tissue. |
| Cartilage | Cartilage | |
| Colon | Colon | Weighted average of RC-wall, LC-wall, and RSig-wall. |
| Endost-BS | 50 um endosteal region | |
| ET | ET region | Weighted average of ET1-bas and ET2-bas. |
| ET1-bas | Basal cells of anterior nasal passages | |
| ET2-bas | Basal cells of posterior nasal passages + pharynx |
|
| Eye-lens | Lenses of eye | |
| GB-wall | Gall bladder wall | |
| Ht-wall | Heart wall | |
| Kidney-C | Kidney cortex | |
| Kidney-M | Kidney medulla | |
| Kidneys | RKidney + LKidney | Weighted average of Kidney-C and Kidney-M |
| LC-wall | Left colon wall (left transverse + descending) |
|
| Liver | Liver | |
| LN-ET | Lymph nodes of ET region | M + F specific source. |
| LN-Th | Lymph nodes in thoracic region | M + F specific source. |
| Lymph | Lymph nodes, except LN-ET + LN-TH | M + F specific source. |
| LN-Total | All lymph node regions | Weighted average of LN-ET, LN-TH, and Lymph. M + F specific source. |
| Lungs | RLung + LLung | |
| Muscle | Muscle | |
| Oesophagus | Oesophagus wall | |
| Ovaries | ROvary + LOvary | |
| Pancreas | Pancreas | |
| P-gland | Pituitary gland | |
| Prostate | Prostate | |
| RC-wall | Right colon wall (ascending + right transverse) |
|
| R-marrow | Active (red) marrow | |
| RSig-wall | Sigmoid colon wall + rectum wall | |
| S-glands | Salivary glands | Parotid, submaxillary, and sublingual salivary glands. |
| SI-wall | Small intestine wall | |
| Skin | Skin | |
| Sp-cord | Spinal cord | |
| Spleen | Spleen | |
| St-wall | Stomach wall | |
| Testes | Testes | |
| Thymus | Thymus | |
| Thyroid | Thyroid | |
| Trachea | Trachea | |
| UB-wall | Urinary bladder wall | M + F specific source. |
| Uterus | Uterus/cervix | |
| Wbody | Whole body |
2.2.3 Specific Absorbed Fraction Formulation
The SAF is an important measure of organ self- and cross-dose, reflecting the geometry of the irradiation scenario and the photon energy. It is ultimately used to calculate either individual organ absorbed doses, individual organ equivalent doses, or the whole-body effective dose. Dose estimates of internal emitters are derived from knowledge of the energies, types, and frequencies of radiations emitted from source tissues rS and the fraction of that emitted energy that is deposited in various target tissues rT. For any target tissue, the time – independent formulation of radiation absorbed dose from a set of arbitrary source tissues emitting radiation is given by Equations 1 and 2 (Bolch et al 2009):
| (1) |
| (2) |
where Ã(rS) is the time-integrated activity (or the total number of nuclear transformations) occurring in source tissue rS, S(rT ← rS) is the radionuclide S value, defined as the mean absorbed dose rate to target tissue rT per unit activity in source tissue rS, Ei is the energy of the ith radiation, Yi is the yield of the ith radiation, ϕ(rT ← rS; Ei) is the absorbed fraction (AF) defined as the fraction of radiation energy emitted by the ith radiation from source tissue rS that is absorbed in target tissue rT, mT is the mass of the target tissue rT, Δi is the delta value for the ith radiation, defined as the product of the energy and the yield of the ith radiation, and SAF(rT ← rS; Ei) is the SAF, defined as the ratio of the AF to the target tissue mass. The energy dependent SAFs can be obtained by log-log interpolation between the monoenergetic SAFs resulting from this work.
The numbers extracted from the output of the MCNPX simulations were in units of MeV per gram per particle for the photon-only transport and MeV per particle for the full photon-electron transport. Consequently, to obtain the SAF for any particular target tissue, the photon-only results were divided by the initial photon energy. To determine the SAF from the full photon-electron transport, the results were divided by both the initial energy of the photon as well as the target organ mass.
A different method was used to calculate SAF for the skeletal tissues. Equation 3 was used to calculate the SAFs for both AM and TM50 target regions for the whole skeleton:
| (3) |
where k is the constant 6.24142 × 1016 cm2 · MeV / m2 · J, E0 is the initial monoenergetic photon energy, w(rT)j is the mass fraction of the target tissue rT in bone site j, D(rT)/Φ(Ei) is the skeletal photon DRF for target tissue rT at photon energy Ei, Φ(j ← rS; Ei) is the photon fluence emitted from source tissue rS incident on the spongiosa/medullary cavity of bone site j for photons of energy Ei, and SAF (rT ← rS; E0) is the SAF for target tissue rT from source tissue rS for photons with initial energy E0.
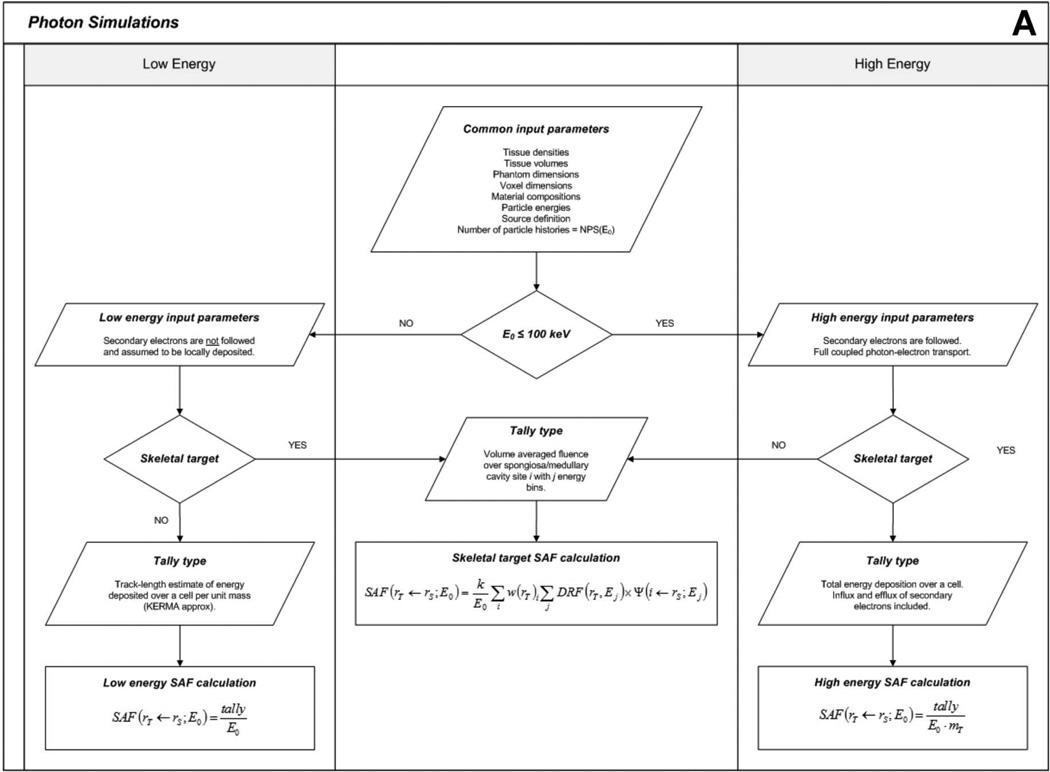
Photon SAFs were obtained for every source-target-energy combination for both the male and female UF newborn hybrid phantoms. Even though the male and female versions of the newborn are almost exactly the same structurally and internally, the models must be simulated separately due to gender-specific target tissues and the penetrating nature of photons. These SAFs can be used to perform dosimetry calculations for almost any nuclear medicine procedure, provided the radiopharmaceutical biokinetics are known. A flowchart outlining the computational hierarchy of the photon simulations is given in Figure 3A.
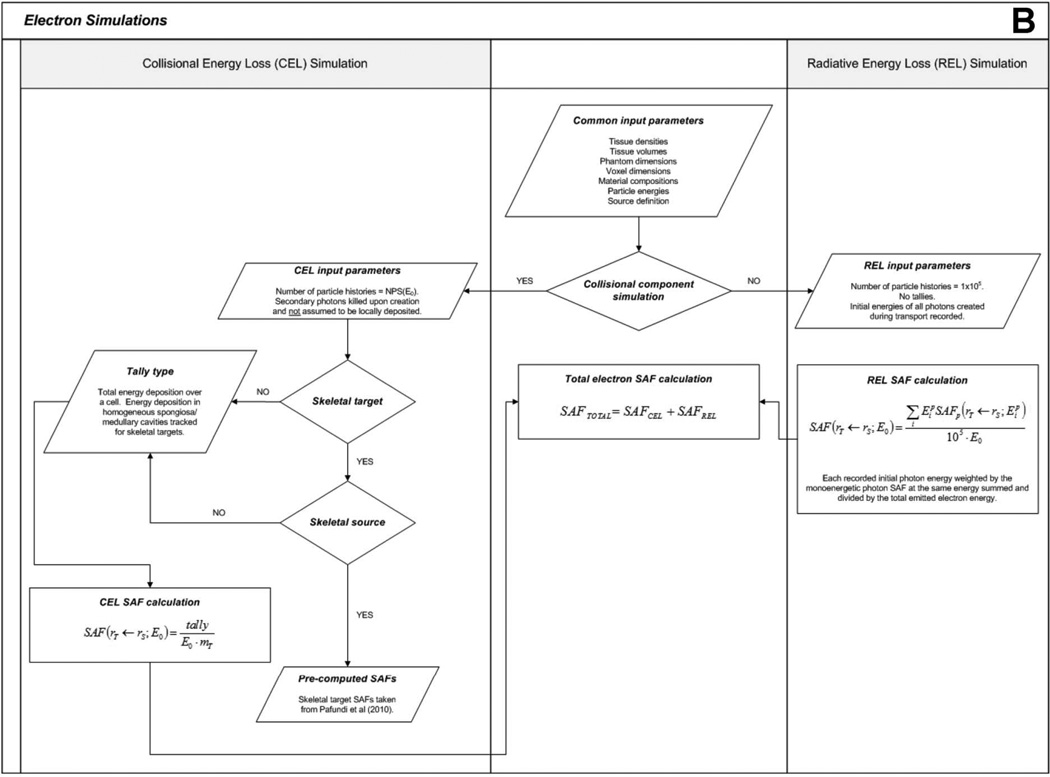
Figure 3.
Flowcharts depicting (A) photon and (B) electron simulation hierarchies.
2.3 Electron Specific Absorbed Fractions
For non-skeletal sources, the parameters used for the electron simulations are mostly identical to those for the photon simulations. However, the photon-only and full photon-electron transport combinations are not used as both electrons and photons resulting from radiative losses (e.g., bremsstrahlung) must additionally be tracked. As a result, different transport methods are used to assemble electron SAFs.
For electron emissions, the recorded energy absorption to organs distant from the source has generally poor statistical reliability as that energy is deposited solely by bremsstrahlung photons of relatively low production and low energy. Full electron-photon transport, however, would in part replicate efforts previously undertaken to assemble the monoenergetic values of the photon SAF. Consequently, electron dosimetry in the newborn phantom in this study is performed in two stages – (1) tracking energy deposition by direct collisional losses from primary source electrons, and (2) tracking energy deposition by radiation losses from the resultant bremsstrahlung photons produced within or near the source organ. This approach to electron dosimetry is referred to as the “two-simulation method”.
First, a full photon-electron simulation is completed in which only the initial energies of bremsstrahlung photons are recorded, and not their energy deposition events. This simulation is meant to model only the radiative energy loss (REL) contribution to tissue dose, henceforth referred to as the “REL simulation”. The number of electron histories is set to 105 to produce a reliable spectrum of initial bremsstrahlung photon energies. The resultant bremsstrahlung energy spectrum is then used to weight the previously developed monoenergetic photon SAFs through Equation 4 to produce an SAF value to the target organ resulting solely from electron radiative energy losses:
| (4) |
where is the specific absorbed fraction of energy for target tissue rT from any source tissue rS for the ith monoenergetic photon energy , E0 is the initial energy of the monoenergetic electrons, NPS is the number of electron histories (105), and SAFREL(rT ← rS; E0) is the specific absorbed fraction of energy due to radiative losses to target tissue rT from any source tissue rS for monoenergetic electrons of initial energy E0. The assumption here is that all bremsstrahlung photons created during transport are uniformly emitted and isotropically directed throughout the source organ.
It is acknowledged that by tracking the initial energies of all bremsstrahlung photons created during primary electron transport, some photons will be created outside of the source tissue, while the assumption ofEq. 4 is that all are produced interior to the source organ. Given the short ranges of electrons, this slight geometric inconsistency is shown not to yield considerable error in the calculations. Also, slight changes in source organ volume have not been shown to produce large changes in SAFs for organs distant from the source (17). Evidence for the validity of this assumption is given later in this study.
After REL simulations are completed, separate simulations are performed to determine the energy absorbed by target tissues resulting from collisional energy losses (CEL), henceforth referred to as the “CEL simulation”. This is accomplished by simulating the transport of the primary electrons alone. Energy loss from bremsstrahlung photon production is included, but these photons are immediately terminated from further consideration. Collisional energy losses over the target organ of interest are tracked, and the SAF for the CEL simulation is given by the ratio of the collisional energy loss absorbed fraction and the mass of the target organ. The number of particle histories simulated is the same as for the monoenergetic photon simulations.
For extra-skeletal sources, the methodology for determining electron SAFs to skeletal target tissues is the same as for non-skeletal target tissues as external electron collisional energy loss contributions do not create intra-skeletal dose enhancement (e.g., no dose response function is required). First, the CEL simulation is performed, and energy deposition is recorded in all spongiosa sites and medullary cavities. The SAF for each site is determined by dividing the energy deposition by the total mass of the site (including marrow and trabecular bone). Then, the REL simulation is performed and applied in the same way as described above. Skeletal average SAFs are determined by weighting the site-specific SAFs by the mass fraction of the target tissue in each site. For intra-skeletal sources, electron SAFs were taken directly from published values given by Pafundi et al (2010). A flowchart outlining the computational hierarchy of the electron simulations is given in Figure 3B.
2.4 S value Calculation
Once monoenergetic photon and electron SAFs are assembled, S values, the formulation for which can be seen in Eq. 2, can be calculated. In this study, they were calculated for radionuclides associated with common molecular imaging studies of the newborn – 11C, 18F, 67Ga, 123I, 131I, 111In, 81mKr, 13N, 15O, 82Rb, 99mTc, 201Tl, and 133Xe, and ultrashort-lived molecular imaging radionuclides 195mAu, 191mIr, and 178Ta (Treves 2007). Radionuclide emission spectra are taken from ICRP Publication 107 (ICRP 2008b). SAFs at all emission energies and radiation types were log-log interpolated from the monoenergetic SAFs developed in this study.
2.5 Variance Reduction Techniques
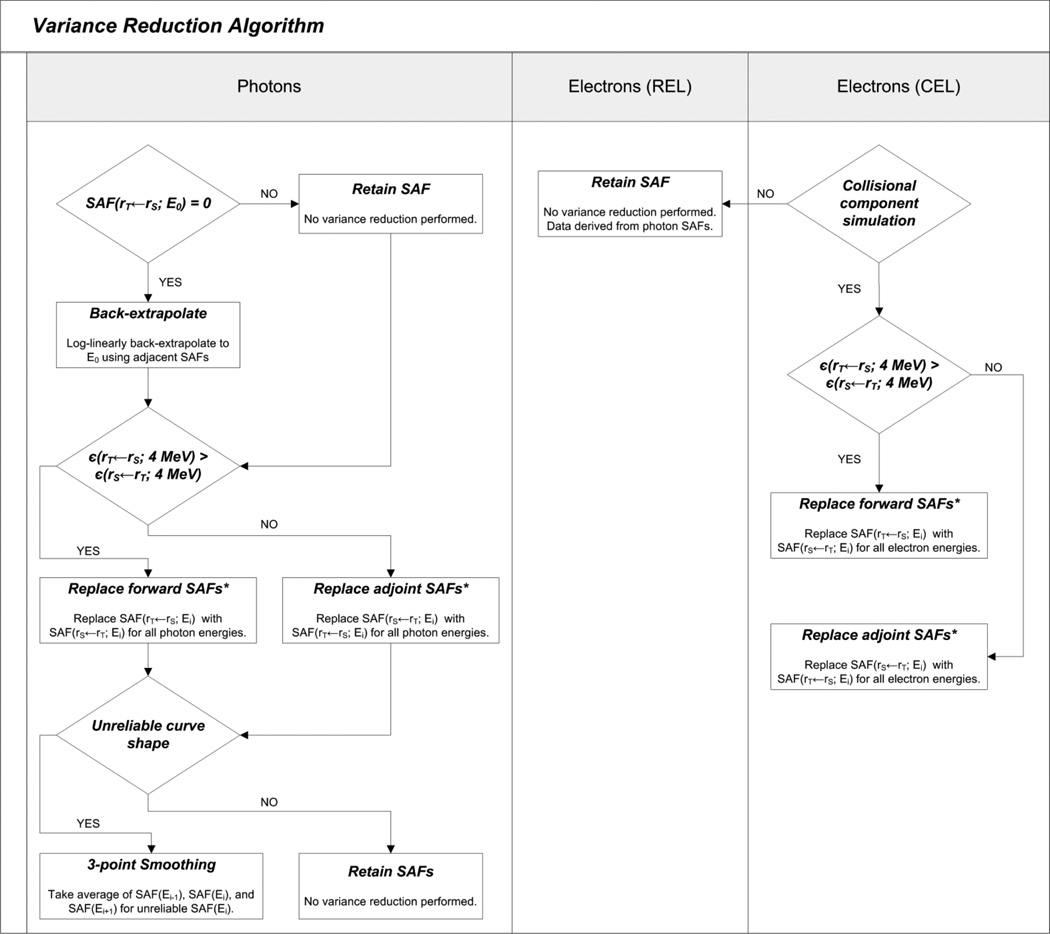
2.5.1 Photons
Reverse (adjoint) Monte Carlo was performed for most source-target combinations by reversing the source and target designations, and retaining the SAF with the lowest statistical uncertainty. The reciprocity theorem states that the SAF from a source organ irradiating a target organ is equivalent to the SAF when the source-target designations are reversed (Petoussi-Henss et al 2007; Shultis and Faw 2000). The theorem is rigorously valid for an infinite uniform homogenous media but it has also been shown to be approximately true for heterogeneous media (Cristy and Eckerman 1987). When applied in heterogeneous media, this methodology is referred to as the reciprocity “principle” (Petoussi-Henss et al 2007). However, the principle is not valid when one of the organs is a skeletal tissue for initial energies between 10 keV and 200 keV (owing to photon dose enhancements) (Cristy and Eckerman 1987). Consequently, the reciprocity principle was not applied for skeletal target tissues at initial energies less than or equal to 200 keV. The uncertainties were seen to improve for the larger organ targets as more energy absorption events were recorded.
In the case of low-energy particles, poor statistical reliability manifested itself occasionally in the absence of any recorded energy deposition. Consequently, the SAF curves for these source-target organ combinations were completed through log-linear extrapolation. For some source-target combinations where both organs were small, adjoint Monte Carlo simulations were insufficient to increase SAF curve reliability. These SAFs displayed unsatisfactory statistical uncertainties across some initial photon energies. In these cases, three-point data smoothing was applied whereby an average of SAF(Ei-1), SAF(Ei), and SAF(Ei+1) was taken. If Ei equaled 10 keV or 4 MeV, two-point smoothing was applied.
2.5.2 Electrons
For electron SAFs, the reciprocity principle was applied only to the CEL simulation results, retaining only those SAFs for source-target organ combinations with the lowest uncertainties. Since data variance reduction techniques had already been applied to the photon SAFs, no additional work was needed for the REL simulation results. A flowchart for the variance reduction steps applied for both photon and electrons is shown in Figure 4.
Figure 4.
Flowchart depicting the variance reduction algorithm.
3. Results
3.1 Skeletal Photon Dose Response Functions
A complete set of fluence-to-absorbed dose response functions for photon irradiation of the newborn skeleton is given in electronic form in Annex A in units of Gy · m2. Dose to the skeletal tissues is thus determined as the convolution of the energy-dependent volumetric photon fluence in the spongiosa and medullary cavities of the newborn phantom, and the tabulated values of the dose response function unique to each skeletal site (Hough et al 2011; Johnson et al 2011). In the case of the newborn, the spongiosa and medullary cavities of the long bones were simulated as one composite source as photon-generated electron cross-fire between medullary marrow and the proximal / distal ends of the long bones had to be considered (Pafundi et al 2010).
3.2 Photon Specific Absorbed Fractions
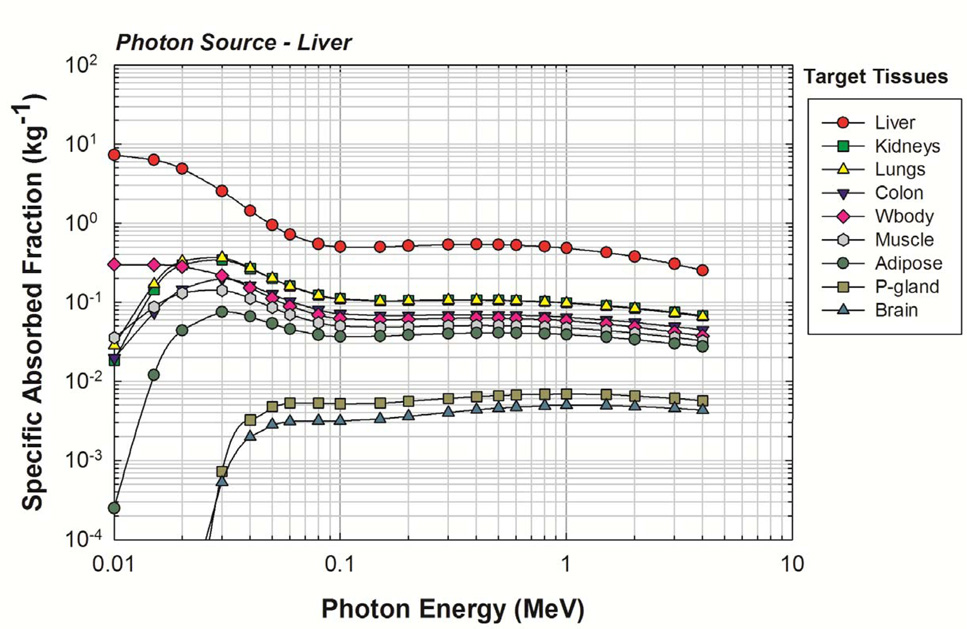
Representative values of photon SAF are given in Figure 5 for photon sources within the newborn liver. As the liver is a relatively large organ, the reverse Monte Carlo method of variance reduction was effective as evidenced by the shape of the SAF curves. MCNPX reports uncertainties as a coefficient of variation (standard deviation divided by the mean tally value). The average uncertainty for initial photon energies greater than or equal to 20 keV was <1%. Relative uncertainties less than 10% are generally considered reliable and those between 10% and 20% are considered questionable (Pelowitz 2005). Consequently, by this standard, it was desired that all SAFs show uncertainties below 10%. The final SAF values for the liver source were considered reliable, and no manual smoothing was necessary. Complete tables of photon SAFs for the newborn male and female phantoms are available in electronic form within Annex B.
Figure 5.
Photon SAFs for a uniform photon source in the newborn liver. Target organs are given in the legend in decreasing order of their SAF at 4 MeV.
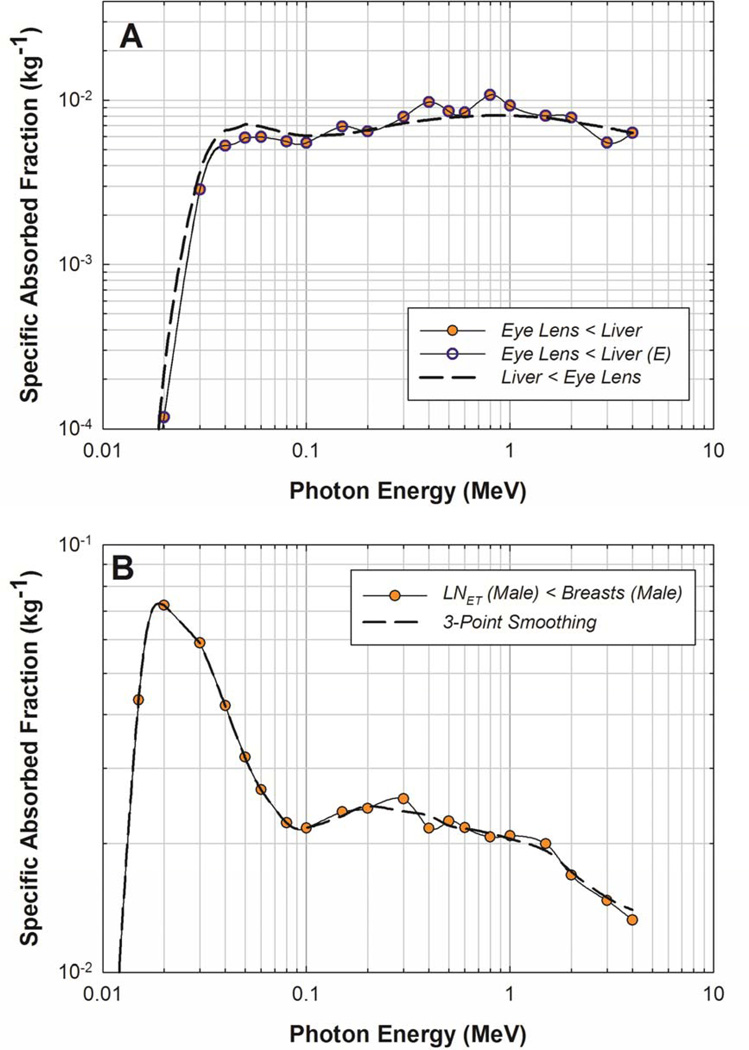
Target organs exhibiting poor statistics for large source organs such as the liver were readily corrected via the reciprocity principle. However, small source/small target combinations presented a challenge. A sample of the smoothing techniques applied can be seen in Figure 6. In 6A for a liver source, a simple application of adjoint Monte Carlo produced satisfactory results as shown. However, for a small source/small target combinations such as the breasts irradiating the extrathoracic lymphatic nodes, both the forward and the reverse Monte Carlo simulations yielded uncertainties exceeding 10%. Even after reverse Monte Carlo was performed, the curve did not exhibit consistent smoothness with photon energy, indicating that the SAFs for this source-target combination are somewhat unreliable. Consequently, a 3-point smoothing technique was used, as described in the previous section and shown in Figure 6B. While the uncertainties associated with the final SAFs for the extrathoracic lymph node target could not be quantified, the SAFs were considered more reliable since the curve shape was more smooth, reflecting the behavior of very low uncertainty SAF curves.
Figure 6.
Variance reduction techniques for a (A) large source (Liver) and small target (Eye-lens) organ and a (B) small source (Breasts (M)) and small target ( LN-ET (M)) organ. E indicates that the data has been log-linearly back extrapolated to low energies.
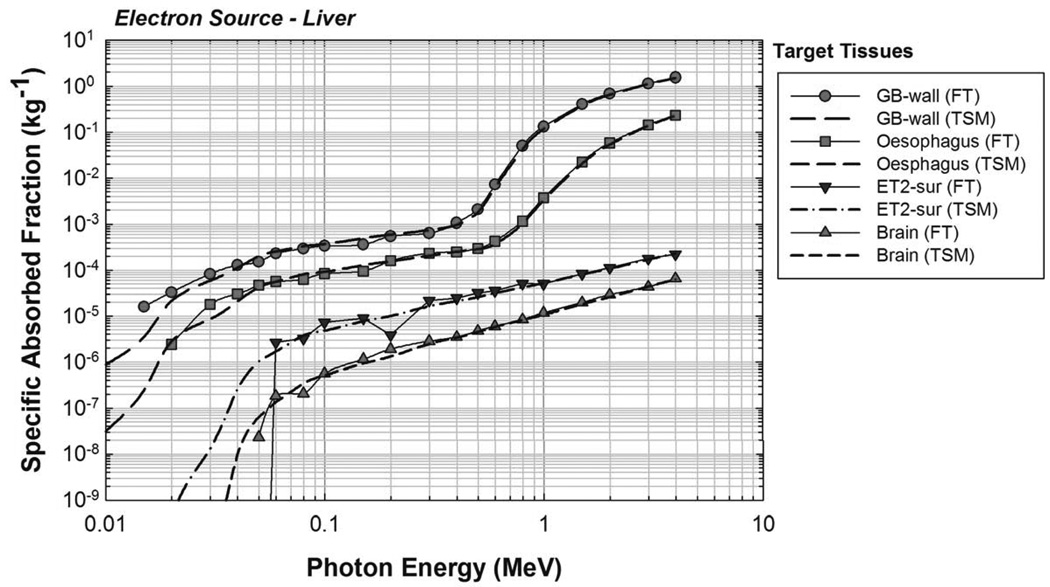
3.3 Electron Specific Absorbed Fractions
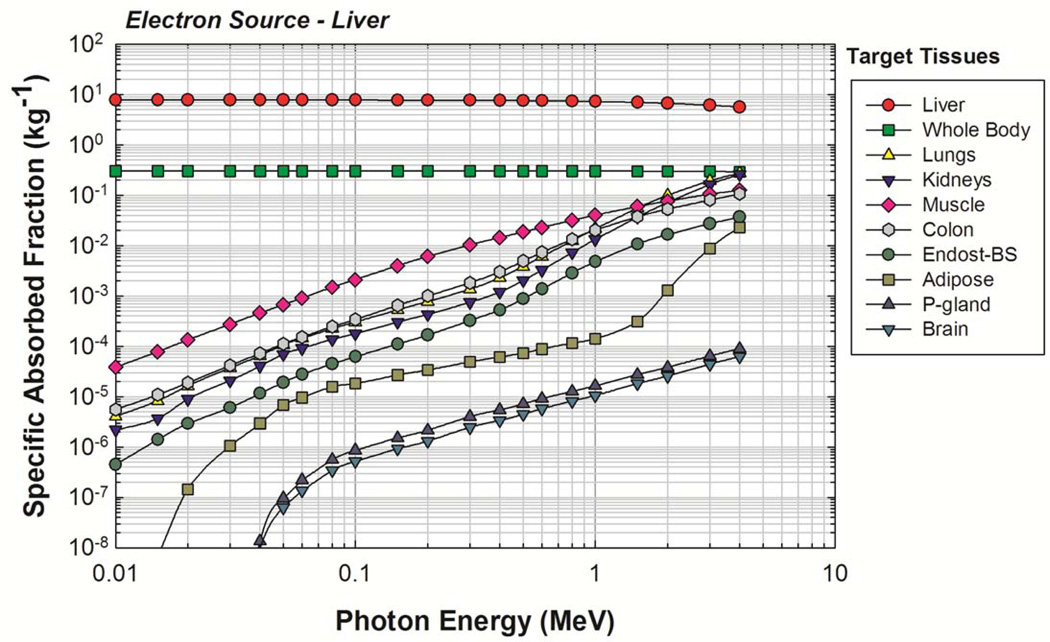
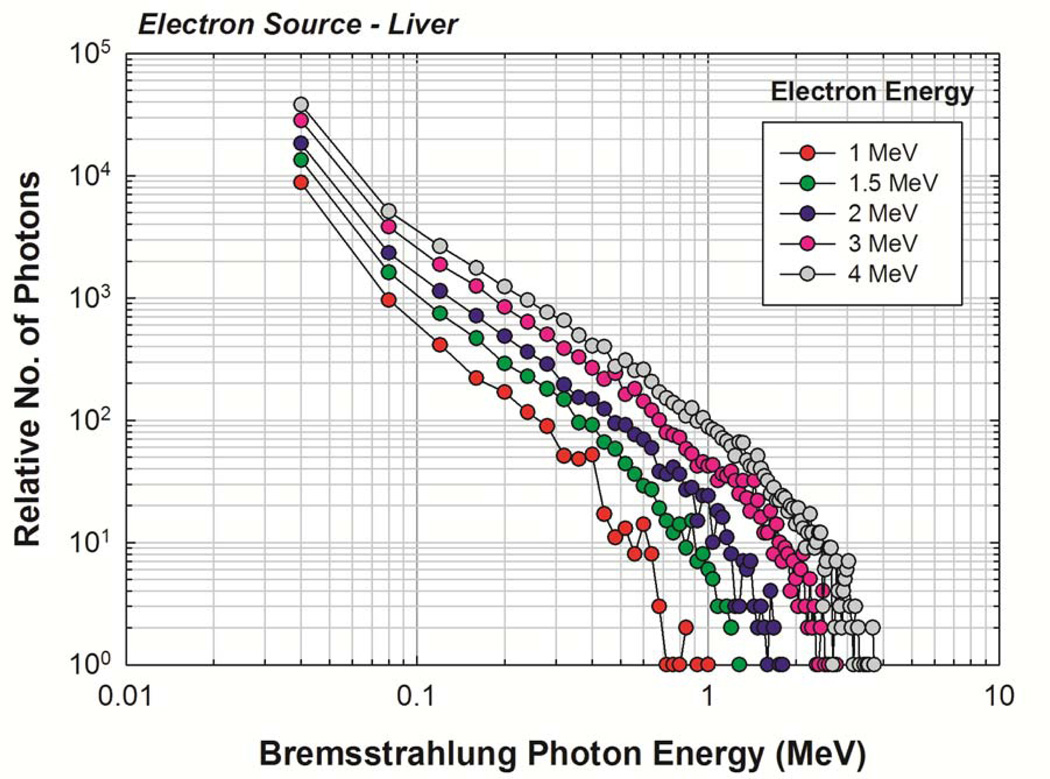
The newborn liver was again chosen as a representative source organ, and the corresponding electron SAFs are shown in Figure 7. For comparison purposes, a full photon-electron transport simulation was also completed with results shown in Figure 8. A good benchmark for determining the effectiveness of the two-simulation approach is to examine the values of SAF(brain ← liver) and of SAF(ET2 ← liver). No primary electrons reach the brain or ET2 from the liver in the newborn phantom, and so the only energy deposition contribution comes from bremsstrahlung photons. Furthermore, the brain and ET2 are sufficiently large enough to ensure relatively low statistical uncertainties under full photon-electron simulations at mid-to-high electron energies. Figure 8 shows that, in this energy range, both methods give similar values, demonstrating that the two-simulation method is conceptually sound and that the consequences of confining photons created outside of the source volume to the source volume itself does not show large deviations from expected values. Similar results were seen for other target tissues. The primary benefit of the two-simulation method is the production of fairly low uncertainty electron SAFs for source-target combinations where there is no primary electron dose contribution. A secondary benefit is a saving of computation time. Based on the benchmarking example runtimes, the two-simulation method saves, on average, about 18 CPU-hours per source tissue. Complete tables of electron SAFs for the newborn male and female phantoms are available in electronic form in Annex C. Figure 9 shows the bremsstrahlung energy spectrum generated for several monoenergetic electron source energies within the newborn liver as needed for the REL contributions to the electron SAF.
Figure 7.
Electron SAFs calculated using the two-simulation method of electron dosimetry. Uniform electron source in the UF newborn liver.
Figure 8.
Comparison of full photon-electron transport (FT) and two-simulation method (TSM) for electron dosimetry. Uniform electron source in the UF newborn liver.
Figure 9.
Bremsstrahlung spectra generated for starting electron energies of 1,1.5, 2, 3, and 4 MeV in the newborn liver.
3.4 RadionuclideS values
S values for the 16 listed radionuclides are available in electronic form in Annex D. S values were computed for all source-target combinations. Residence times calculated from biokinetic analysis and AA can be used in conjunction with the S values to compute individual organ and whole-body doses. Future work will provide S values for all 1252 radionuclides listed in ICRP Publication 107. For verification purposes, the photon spectrum of 99mTc and the beta spectrum of 90Y were directly simulated in MCNPX and the resulting S values were compared to those obtained from the previously assembled photon and electron SAFs. Results for the liver source are shown in Table 4. Most S values calculated from the monoenergetic SAFs were very close to those from the direct simulation. The only exceptions were seen for very small target organs (e.g., pituitary gland) and can be attributed to the poor statistical uncertainties associated with the direct simulations since no variance reduction was performed.
Table 4.
SAF verification study. Ratio of the Svalues obtained from previously developed monenergetic SAFs to the Svalues obtained from direct simulation of the spectra. Liver source shown.
| Ratio -- S(Calculator) / S(Direct) | Radionuclide and Emission Type |
|
|---|---|---|
| Tc-99m | Y-90 | |
| Organ / Tissue | Photons | Betas |
| Adipose | 1.01 | 1.15 |
| Adrenals | 1.02 | 1.00 |
| Brain | 1.00 | 1.00 |
| Breast (F) | 0.96 | 1.75 |
| Bronchial | 1.01 | 1.01 |
| Cartilage | 1.01 | 1.02 |
| ET1-sur | 1.28 | 1.42 |
| ET2-sur | 0.98 | 0.95 |
| Eye-lens | 1.28 | 1.02 |
| GB-wall | 1.04 | 0.99 |
| Ht-wall | 1.01 | 1.01 |
| Kidney-C | 1.00 | 1.00 |
| Kidney-M | 1.01 | 1.30 |
| LC-wall | 1.03 | 1.04 |
| Liver | 1.01 | 1.00 |
| LN-ET (F) | 1.24 | -- |
| LN-Th (F) | 1.04 | 0.68 |
| Lungs | 1.01 | 1.00 |
| Lymph (F) | 1.04 | 1.00 |
| Muscle | 1.01 | 1.00 |
| Oesophagus | 1.04 | 1.04 |
| Ovaries | 1.06 | 0.98 |
| Pancreas | 1.02 | 1.00 |
| Pit-gland | 1.02 | 40.69 |
| RC-wall | 1.02 | 0.99 |
| RSig-wall | 1.03 | 1.15 |
| S-glands | 1.06 | 1.31 |
| SI-wall | 1.02 | 1.01 |
| Skin | 1.02 | 1.04 |
| Sp-cord | 1.02 | 0.94 |
| Spleen | 1.00 | 1.01 |
| St-wall | 1.02 | 1.00 |
| Thymus | 1.04 | 0.99 |
| Thyroid | 1.00 | 1.40 |
| Trachea | 1.08 | 1.05 |
| UB-wall (F) | 1.00 | 1.13 |
| Uterus | 1.03 | 1.05 |
4. Discussion
4.1 Photon Specific Absorbed Fractions
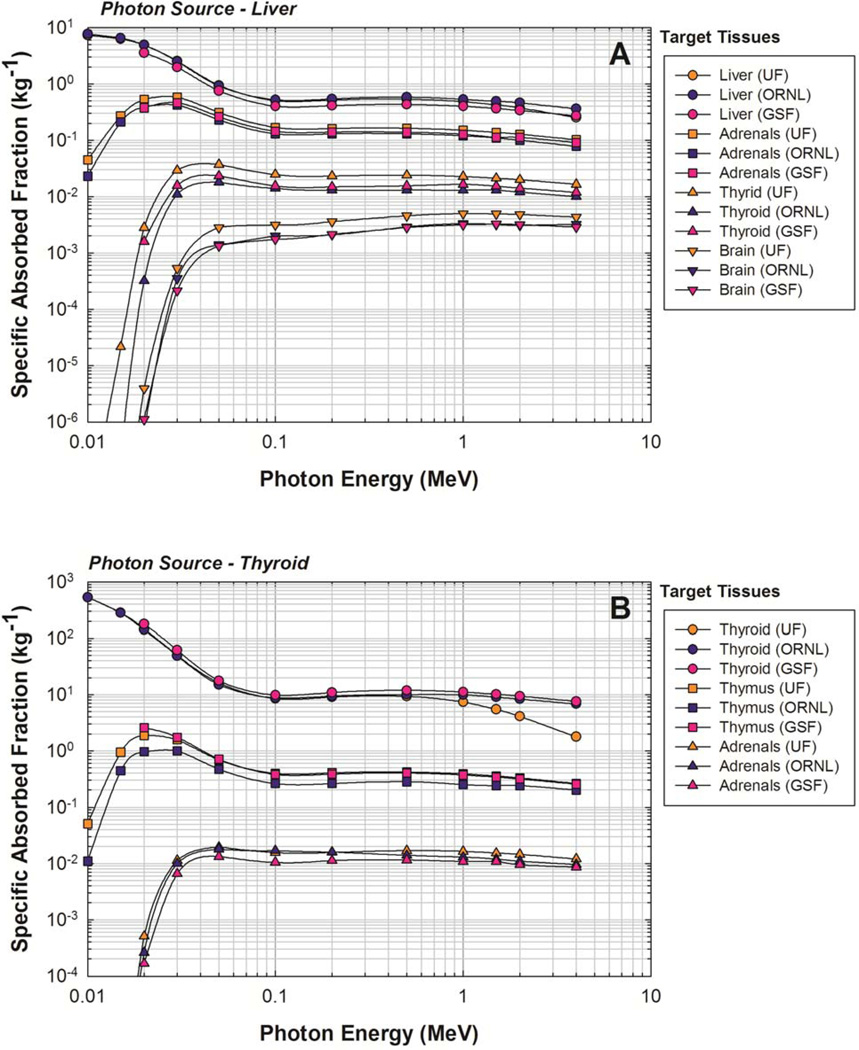
The current standard for monoenergetic photon SAFs for the ICRP-reference newborn phantom is the ORNL/TM-8381/V6 report (Cristy and Eckerman 1987). Therefore, results from the current study were compared to the ORNL/TM-8381/V6 report in addition to a more recent model, the GSF BABY phantom (Petoussi-Henss et al 2002). Two source tissues, the liver and thyroid, were chosen for comparison to illuminate differences with organ size. The adrenals, brain, liver, and thyroid were chosen as target tissues for the liver source, and the adrenals, thymus, and thyroid were chosen as target tissues for the thyroid source. Results of the comparison for the liver and thyroid sources are shown in Figure 10A and 10B, respectively.
Figure 10.
Comparison of specific absorbed fractions for photons sources in the (A) liver and (B) thyroid as given by the current hybrid phantom study (UF), those from the ORNL stylized newborn (Cristy and Eckerman 1987), and those from the GSF 2-month BABY phantom (Petoussi-Henss et al. 2002).
Variations in SAFs were calculated as the ratio of the UF SAFs to the ORNL and GSF SAFs. Considering the chosen source-target combinations, differences between monoenergetic photon SAFs ranged from −77% for to a factor of 90 times greater for . Some SAF variations can be explained by examining differences between physical characteristics of the phantoms themselves, but some differences may be due to different simulation techniques. For example, liver masses in the UF, ORNL, and GSF phantoms are 129 g, 121 g, and 182 g, respectively (Cristy and Eckerman 1987; Petoussi-Henss et al 2002). Across all energies, the UF self-dose SAFs for a uniform photon source in the liver was, on average, 8% less than the ORNL SAFs and 21% greater than the GSF SAFs for the same irradiation geometry. It is well documented that increases in tissue mass result in decreases in self-dose SAFs and vice-versa (Petoussi-Henss et al 2007), so the overall differences between SAFs for this irradiation scenario can be explained by the variations in liver size. However, there is a noticeable downturn in the UF SAF curve compared to the ORNL and GSF SAF curves at higher photon energies, which is also apparent when looking at thyroid self-dose. Physical characteristics of the phantom models alone do not seem sufficient to explain this difference in curve behavior. An energy balance was used for the UF SAFs wherein secondary electrons were tracked while the kerma approximation was used for the ORNL and GSF calculations (Cristy and Eckerman 1987; Petoussi-Henss and Zankl 1998). An accentuated downward turn of the UF SAFs for photon self-dose was observed because secondary electrons created within the volume of interest escape into adjacent regions.
Despite the inability to completely account for differences between the UF, ORNL, and GSF monoenergetic photon SAFs, noticeable, but not unusually large, differences were seen. In looking at the liver source for all energies and 23 target tissues in the ORNL phantom, 33% of the UF SAFs differed from the ORNL SAFs by 50% or more while 42% of the UF SAFs differed from the ORNL SAFs by 50% or more for the thyroid source. The same analysis was done for the GSF BABY phantom, and 25% and 43% of the UF SAFs differed from the GSF SAFs by 50% or more for the liver and thyroid sources, respectively.
4.2 Electron Specific Absorbed Fractions
It is of interest to explore the impact of using transport-generated electron SAFs as opposed to the ICRP Publication 30 method whereby AF(target ← source) = 1 when the source and target are the same and AF (target ← source) = 0 when the source and target are different, or the approach used in the OLINDA code whereby previously calculated electron self-dose AFs to spheres of various sizes are implemented. Consequently, S values were generated for the monoenergetic electron (Auger and internal conversion) and beta components of the 90Y decay scheme for a uniform 90Y source in the liver using each of these three methods. The UF liver self-dose S value for the combined monoenergetic electron and beta contributions was 8% greater than that calculated using the MIRDOSE method and about 1% greater than that calculated using the sphere AF approach. This seems to indicate that the ICRP 30 method was improved upon with the introduction of the two-simulation electron dosimetry method. However, even though the approach of using electron AFs to spheres of various sizes gave results similar to the two-simulation method, electron cross-dose is not accounted for with the OLINDA tissue-sphere approach. In this particular comparison study, cross-dose S values were as significant as about 5% of the self-dose S value. Cross-dose could be potentially significant in other circumstances. It is thus our view that patient dosimetry in nuclear medicine should employ the most current patient anatomic model and transport techniques as they become available for deployment in the clinic.
4.3 RadionuclideS values
Similar to this work, the OLINDA/EXM 1.0 software uses monoenergetic SAFs to compute radionuclide S values for internal dose estimates. OLINDA/EXM 1.0 uses the 6 stylized computational phantoms described previously by Cristy and Eckerman, the SAFs for which were calculated using a Monte Carlo code called ALGAMP, in addition to 4 nonpregnant or pregnant adult females at various stages of pregnancy (Stabin et al 2005). OLINDA/EXM 1.0 calculates dose to radiosensitive tissues in the skeleton with skeletal photon fluence-to-dose response functions for the adult phantom described by Cristy and Eckerman (Cristy and Eckerman 1987). Skeletal photon fluence-to-dose response functions were initially calculated for seven bone sites in the adult phantoms, but two were ultimately recommended for calculating dose to active marrow and bone surfaces – one for the parietal bone and one (the lumbar vertebra) to be applied to all other bone sites (Cristy and Eckerman 1987). OLINDA/EXM utilizes radionuclide decay data from Brookhaven National Laboratory as documented in Stabin and da Luz (2002).
Selected comparisons between 99mTc S values computed by the OLINDA/ EXM 1.0 software package and from the UF newborn hybrid phantom are given in Table 5. S value ratios for all self-dose irradiation scenarios were observed to fall between 0.46 and 1.42. Previous studies have shown that a decrease in tissue mass will typically lead to an increase in self-absorbed dose (Petoussi-Henss et al 2007). For most tissues, this prediction held true, but for several tissues the prediction did not rigorously hold. However, the reason some S values did not follow the expected trend could be attributed to the differences between tissue contours.
Table 5.
Selected ratios ofTc-99m Svalues comparing the UF and OLINDA/EXM 1.0 results. R = S(UF)/S(OLINDA).
| Source |
||||||||||||||
|---|---|---|---|---|---|---|---|---|---|---|---|---|---|---|
| Target | Adrenals | Brain | St-cont | Liver | Lungs | Muscle | Ovaries | R-marrow | T-bone-S | C-bone-V | T-bone-V | Thyroid | Uterus | |
| Adrenals | 1.03 | 1.05 | 1.99 | 1.25 | 0.52 | 1.33 | 1.06 | 1.32 | 1.21 | 0.96 | 0.75 | 0.95 | 0.88 | |
| Brain | 1.05 | 1.15 | 1.56 | 1.62 | 1.55 | 0.96 | 1.32 | 0.94 | 0.92 | 1.34 | 2.27 | 1.36 | 1.14 | |
| St-wall | 2.23 | 1.46 | 0.15 | 1.32 | 1.12 | 1.29 | 0.92 | 1.54 | 1.25 | 0.95 | 0.78 | 1.22 | 0.60 | |
| Liver | 1.25 | 1.62 | 1.24 | 0.99 | 1.33 | 1.32 | 0.71 | 1.55 | 1.32 | 0.98 | 0.80 | 1.71 | 0.53 | |
| Lungs | 0.52 | 1.55 | 1.19 | 1.33 | 1.00 | 1.21 | 0.75 | 2.35 | 1.99 | 1.40 | 1.18 | 1.95 | 0.63 | |
| Muscle | 1.33 | 0.96 | 1.23 | 1.32 | 1.21 | 0.68 | 1.26 | 1.43 | 1.25 | 1.17 | 1.01 | 1.00 | 1.09 | |
| Ovaries | 1.06 | 1.32 | 0.98 | 0.71 | 0.75 | 1.26 | 1.16 | 1.10 | 1.02 | 0.88 | 0.59 | 0.75 | 1.80 | |
| Marrow | 1.23 | 0.81 | 1.48 | 1.55 | 2.18 | 1.43 | 1.07 | 0.46 | 0.82 | 1.37 | 1.36 | 3.26 | 1.48 | |
| Endost-BS | 0.50 | 0.87 | 0.54 | 0.57 | 0.85 | 0.55 | 0.44 | 0.85 | 0.26 | 0.22 | 0.74 | 1.58 | 0.57 | |
| Skin | 1.13 | 0.79 | 1.09 | 1.08 | 1.06 | 0.96 | 1.00 | 1.02 | 0.93 | 0.92 | 0.89 | 1.14 | 1.01 | |
| Thyroid | 0.95 | 1.36 | 1.46 | 1.71 | 1.95 | 1.00 | 0.75 | 3.48 | 3.17 | 2.65 | 3.06 | 1.05 | 0.57 | |
| Uterus | 0.88 | 1.14 | 0.63 | 0.53 | 0.63 | 1.09 | 1.80 | 1.48 | 1.34 | 1.32 | 0.76 | 0.57 | 1.05 | |
| WBody | 1.10 | 1.12 | 0.90 | 1.14 | 1.18 | 1.06 | 1.01 | 1.15 | 1.14 | 1.11 | 1.13 | 1.11 | 0.99 | |
S value ratios for all cross-dose irradiation scenarios were observed between 0.04 and 3.49. Differences between the UF and OLINDA/ EXM 1.0 cross-dose S values were due primarily to variations in organ size and inter-organ separation. For example, the UF S value for the stomach contents irradiating the liver was 24% larger than the OLINDA/ EXM 1.0 S value for the same source and target tissue. The stomach wall surface is almost flush with the liver in the UF phantom while there are sizeable gaps between the stomach and liver in the OLINDA/ EXM 1.0 geometry (Yoriyaz et al 2000; Lee et al 2007b; Petoussi-Henss and Zankl 1998). While geometry differences can be somewhat predicted, the inequality of other dosimetric factors makes it difficult to rigorously predict internal dosimetry variations between the two models. Factors such as radionuclide spectra, electron dosimetry method, tissue densities, and tissue compositions complicate the comparison between models. Nevertheless, significant variations were seen between the UF and OLINDA/ EXM 1.0 S values.
5. Conclusions
This present study presents a comprehensive dosimetry model of the newborn patient for use in estimating organ and tissue absorbed doses following molecular imaging studies. Newborn anatomy is captured within 126 anatomical organ and tissue models, including 38 skeletal sites and 31 cartilage sites, all described within the hybrid phantom using either NURBS or polygon surfaces. This work introduces for the first time a set of fluence-to-dose response functions that uniquely allow assessment of dose to the tissues of the newborn skeleton taking into consideration the bone-specific microarchitecture of newborn bone trabeculae and marrow cavities. Furthermore, a new approach to internal electron dosimetry is introduced whereby dose is assessed separately from electron collisional and radiation losses for both self-dose and cross-dose energy deposition events. For the radiative loss contribution, a separate Monte Carlo simulation is made to assemble the bremsstrahlung spectrum, and then this spectrum is used to re-weight a previously established monoenergetic database of photon SAFs for all source-target organ combinations. S values are also provided in electronic form for a series of radionuclides of interest to newborn molecular imaging. Similar work in establishing data libraries of photon and electron SAF values, and radionuclide S values, is currently ongoing across the entire series of UF pediatric and adult hybrid phantoms. These data will allow for anatomically realistic estimates of patient organ absorbed dose in cases where patient-specific imaging data are unavailable for dose assessment, and thus phantom-based estimates are required for optimization studies and risk evaluations.
Acknowledgements
This research was supported in part by grants R01 CA116743 and R01 CA96441 with the National Cancer Institute, and by grant DE-FG07–06ID14773 with the US Department of Energy.
Footnotes
In ICRP Publication 89, reference organ masses are identical for the reference male and female at ages of 0, 1, 5, and 10 years. Separate gender-specific organs masses are thus given only for the ICRP reference 15-year-old and adults.
REFERENCES
- Bolch WE, Eckerman KF, Sgouros G, Thomas SR. MIRD Pamphlet No. 21 – A generalized schema for radiopharmaceutical dosimetry: Standardization of nomenclature. J Nucl Med. 2009;50:477–484. doi: 10.2967/jnumed.108.056036. [DOI] [PubMed] [Google Scholar]
- Cristy M, Eckerman KF. Specific absorbed fractions of energy at various ages from internal photon sources. Oak Ridge, TN: Oak Ridge National Laboratory; 1987. [Google Scholar]
- Gelfand MJ, Sharp SE, Treves ST, Fahey FH, Parisi MT, Alessio AM. Estimated cumulative radiation dose from PET/CT in children with malignancies. Pediatr Radiol. 2010;40:1712–1713. doi: 10.1007/s00247-010-1794-4. author reply 1714–1715. [DOI] [PubMed] [Google Scholar]
- Hendricks JS, McKinney GW, Waters SW. MCNPX Extended Version 2.5.0. Los Alamos, NM: Los Alamos National Laboratory; 2005. [Google Scholar]
- Hough M, Johnson P, Rajon D, Jokisch D, Lee C, Bolch W. An image-based skeletal dosimetry model for the ICRP reference adult male-internal electron sources. Phys Med Biol. 2011;56:2309–2346. doi: 10.1088/0031-9155/56/8/001. [DOI] [PMC free article] [PubMed] [Google Scholar]
- Hurtado JL, Lee C, Lodwick D, Geode T, Williams JL, Bolch WE. Hybrid computational phantoms representing the reference adult male and adult female: Construction and applications to retrospective dosimetry. Health Phys. in press doi: 10.1097/HP.0b013e318235163f. [DOI] [PMC free article] [PubMed] [Google Scholar]
- ICRP. Annals of the ICRP. Oxford, UK: Pergamon Press; 1975. ICRP Publication 23: Report on the Task Group on Reference Man; pp. 1–480. International Commission on Radiological Protection. [Google Scholar]
- ICRP. ICRP Publication 53: Radiation dose to patients from radiopharmaceuticals. Ann ICRP. 1988;18:1–137. doi: 10.1016/s0146-6453(99)00006-8. [DOI] [PubMed] [Google Scholar]
- ICRP. ICRP Publication 62: Radiological protection in biomedical research -Addendum 1 to ICRP Publication 53. Ann ICRP. 1992;22:1–71. [Google Scholar]
- ICRP. ICRP Publication 66: Human respiratory tract model for radiological protection. Ann ICRP. 1994;24:1–482. [PubMed] [Google Scholar]
- ICRP. ICRP Publication 80: Radiation dose to patients from radiopharmaceuticals -Addendum 2 to ICRP Publication 53. Ann ICRP. 1998;28:1–126. doi: 10.1016/s0146-6453(99)00006-8. [DOI] [PubMed] [Google Scholar]
- ICRP. ICRP Publication 89: Basic anatomical and physiological data for use in radiological protection – reference values. Ann ICRP. 2002;32:1–277. [PubMed] [Google Scholar]
- ICRP. ICRP Publication 106: Radiation dose to patients from radiopharmaceuticals -Addendum 3 to ICRP Publication 53. Ann ICRP. 2008a;38:1–197. doi: 10.1016/j.icrp.2008.08.003. [DOI] [PubMed] [Google Scholar]
- ICRP. ICRP Publication 107: Nuclear decay data for dosimetric calclations. Ann ICRP. 2008b;38:1–26. doi: 10.1016/j.icrp.2008.10.004. [DOI] [PubMed] [Google Scholar]
- ICRP. ICRP Publication 110: Adult reference computational phantoms. Ann ICRP. 2009;39:1–165. doi: 10.1016/j.icrp.2009.09.001. [DOI] [PubMed] [Google Scholar]
- Johnson PB, Bahadori AA, Eckerman KF, Lee C, Bolch WE. Response functions for computing absorbed dose to skeletal tissues from photon irradiation-an update. Phys Med Biol. 2011;56:2347–2365. doi: 10.1088/0031-9155/56/8/002. [DOI] [PMC free article] [PubMed] [Google Scholar]
- Lee C, Kaufman K, Pafundi D, Bolch W. Applications of lymphatic node models in UF hybrid phantoms to radionuclide therapy of lymphoma patients. IEEE Transactions. 2009a;97:2060–2075. [Google Scholar]
- Lee C, Lodwick D, Hasenauer D, Williams JL, Lee C, Bolch WE. Hybrid computational phantoms of the male and female newborn patient: NURBS-based whole-body models. Phys Med Biol. 2007a;52:3309–3333. doi: 10.1088/0031-9155/52/12/001. [DOI] [PubMed] [Google Scholar]
- Lee C, Lodwick D, Hurtado J, Pafundi D, Williams JL, Bolch WE. The UF family of reference hybrid phantoms for computational radiation dosimetry. Phys Med Biol. 2010;55:339–363. doi: 10.1088/0031-9155/55/2/002. [DOI] [PMC free article] [PubMed] [Google Scholar]
- Lee C, Pafundi DH, Kaufman K, Bolch WE. An algorithm for lymphatic node placement in hybrid computational phantoms – applications to radionuclide therapy dosimetr. Proc IEEE. 2009b;97:2098–2108. [Google Scholar]
- Lee C, Park S, Lee JK. Specific absorbed fraction for Korean adult voxel phantom from internal photon source. Radiat Prot Dosimetry. 2007b;123:360–368. doi: 10.1093/rpd/ncl167. [DOI] [PubMed] [Google Scholar]
- Nipper JC, Williams JL, Bolch WE. Creation of two tomographic voxel models of paediatric patients in the firstyear of life. Phys Med Biol. 2002;47:3143–3164. doi: 10.1088/0031-9155/47/17/307. [DOI] [PubMed] [Google Scholar]
- Pafundi D, Lee C, Watchman C, Bourke V, Aris J, Shagina N, Harrison J, Fell T, Bolch W. An image-based skeletal tissue model for the ICRP reference newborn. Phys Med Biol. 2009;54:4497–4531. doi: 10.1088/0031-9155/54/14/009. [DOI] [PubMed] [Google Scholar]
- Pafundi D, Rajon D, Jokisch D, Lee C, Bolch W. An image-based skeletal dosimetry model for the ICRP reference newborn--internal electron sources. Phys Med Biol. 2010;55:1785–1814. doi: 10.1088/0031-9155/55/7/002. [DOI] [PubMed] [Google Scholar]
- Pelowitz DB. MCNPX Users Manual Version 2.5.0. Los Alamos, NM: Los Alamos National Laboratory; 2005. [Google Scholar]
- Petoussi-Henss N, Bolch WE, Zankl M, Sgouros G, Wessels B. Patient-specific scaling of reference S-values for cross-organ radionuclide S-values: what is appropriate? Radiat Prot Dosimetry. 2007;127:192–196. doi: 10.1093/rpd/ncm270. [DOI] [PubMed] [Google Scholar]
- Petoussi-Henss N, Zankl M. Voxel anthropomorphic models as a tool for internal dosimetry. Radiat. Prot Dosim. 1998;79:415–418. [Google Scholar]
- Petoussi-Henss N, Zankl M, Fill U, Regulla D. The GSF family of voxel phantoms. Phys Med Biol. 2002;47:89–106. doi: 10.1088/0031-9155/47/1/307. [DOI] [PubMed] [Google Scholar]
- Sgouros G, Frey EC, Bolch WE, Wayson MB, Abadia AF, Treves ST. An approach for balancing diagnostic image quality with cancer risk: Application to pediatric diagnostic imaging of 99m-Tc-dimercaptosuccinic acid. J Nucl Med. in press doi: 10.2967/jnumed.111.092221. [DOI] [PMC free article] [PubMed] [Google Scholar]
- Shultis J, Faw R. Radiation Shielding. La Grange Park, IL: American Nuclear Society; 2000. [Google Scholar]
- Smith T, Petoussi-Henss N, Zankl M. Comparison of internal radiation doses estimated by MIRD and voxel techniques for a “family” of phantoms. European Journal of Nuclear Medicine. 2000;27:1387–1398. doi: 10.1007/s002590000294. [DOI] [PubMed] [Google Scholar]
- Stabin MG, da Luz LC. Decay data for internal and external dose assessment. Health Phys. 2002;83:471–475. doi: 10.1097/00004032-200210000-00004. [DOI] [PubMed] [Google Scholar]
- Stabin MG, Siegel JA. Physical models and dose factors for use in internal dose assessment. Health Phys. 2003;85:294–310. doi: 10.1097/00004032-200309000-00006. [DOI] [PubMed] [Google Scholar]
- Stabin MG, Sparks RB, Crowe E. OLINDA/EXM: the second-generation personal computer software for internal dose assessment in nuclear medicine. J Nucl Med. 2005;46:1023–1027. [PubMed] [Google Scholar]
- Treves ST. Pediatric Nuclear Medicine / PET. New York, NY: Springer Science & Business Media, LLC; 2007. [Google Scholar]
- Treves ST, Baker A, Fahey FH, Cao X, Davis RT, Drubach LA, Grant FD, Zukotynski K. Nuclear medicine in the firstyear of. life J Nucl Med. 2011;52:905–925. doi: 10.2967/jnumed.110.084202. [DOI] [PubMed] [Google Scholar]
- Treves ST, Davis RT, Fahey FH. Administered radiopharmaceutical doses in children: a survey of 13 pediatric hospitals in North America. J Nucl Med. 2008;49:1024–1027. doi: 10.2967/jnumed.107.049908. [DOI] [PubMed] [Google Scholar]
- Yoriyaz H, dos Santos A, Stabin MG, Cabezas R. Absorbed fractions in a voxel-based phantom calculated with the MCNP-4B code. Med Phys. 2000;27:1555–1562. doi: 10.1118/1.599021. [DOI] [PubMed] [Google Scholar]
- Zanzonico PB. 2010 Annual Meeting of the Society of Nuclear Medicine. Salt Lake City: Utah; 2010. MIRD Continuing Education Session: Putting the risk versus benefit balance in perspective for physicians and patients. [Google Scholar]


