We describe microfluidic technology for manipulating and monitoring continuous growth of populations of bacteria. A system consisting of ∼10 input and output channels controls >102 microdroplet chemostats and enables the manipulation of chemical factors in each microchemostat independently over time. This paper characterizes the dynamics of bacterial populations in microdroplet chemostats and cellular responses to a range of stable or changing antibiotic concentrations. This technology provides a platform for highly parallel, long-term studies of microbial ecology, physiology, evolution, and adaptation to chemical environments.
The introduction of the chemostat by Leo Szilard[1] was a milestone in the field of microbiology. Chemostats facilitate the continuous culture of bacteria, yeast, and algae by continuously replenishing a constant volume of fluid to maintain specific concentrations of cells and growth factors.[1,2] Chemostats have facilitated a wide-range of studies, including microbial ecology,[3] predator-prey dynamics[4] and the evolution of drug resistance[5,6] The consumption of large quantities of reagents and significant operational challenges of traditional chemostats limit their use.
Single phase, microfluidic versions of chemostats minimize incubation volumes,[7–10] and yet are limited by their complexity: the proportionality between the number of input/output controls and the number of chemostats hamper large scale parallelization Single-phase microfluidic systems are prone to biofilm formation, which makes them either single-use devices[9] or requiring additional steps to minimize cell adhesion.[8] Droplet microfluidics[11] offers a unique solution to creating many parallel chemostats. The earliest example of this technology in microbiology was first demonstrated by Joshua Lederberg nearly 60 years ago.[12] In the interim, the field of microfluidics solved many of the technical challenges associated with using this approach to study microbes. Compartmentalizing cells and nutrients in microdroplets of liquid can reduce the complexity and cost of operating many parallel chemostats. Recently, bacteria have been incubated in droplets in channels over short time intervals,[13–17] however sustained cell growth over hundreds of generations in a series of fully addressable microdroplets has not been possible.
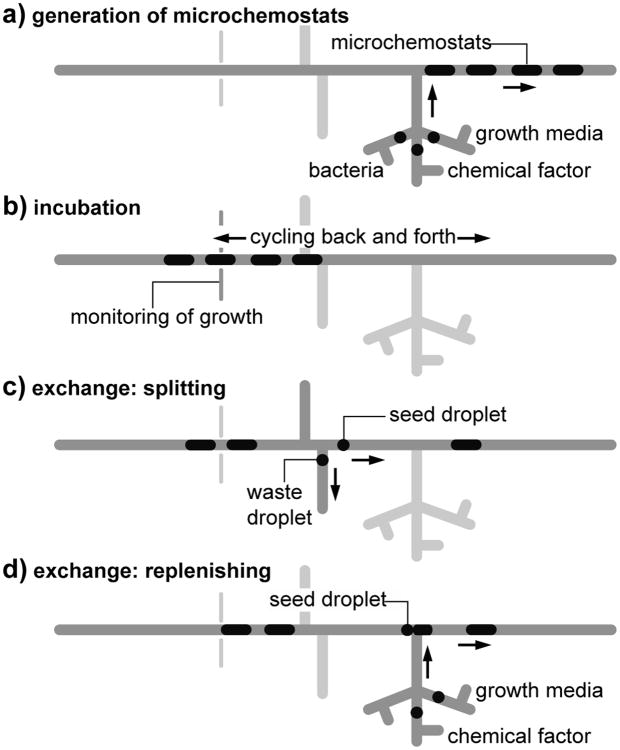
Here, we describe an automated microdroplet system that transcends existing challenges and enables users to manipulate the chemical composition of droplets for long-term bacterial studies. The microfluidic system (Fig. 1) performs three functions: 1) formation of microdroplets containing cells, reagents, and soluble growth factors; 2) cycling microdroplets for cell incubation and monitoring; and 3) splitting and fusing microdroplets to control the concentration of chemical factors over time.
Fig. 1.
Diagram of the operation of the microdroplet chemostat system. a) Fusing droplets of bacteria, growth media, and chemical factors creates a sequence of microdroplets containing encapsulated bacteria. b) Microdroplets are cycled in the incubation segment and cell growth is monitored. c) Each microdroplet is split into a seed droplet and a waste droplet. d) The seed droplet is fused to a microdroplet containing nutrient media and chemical factors. Symbols are explained in the legend.
After loading the reservoirs with liquid samples, we used a source of pressure and external valves to regulate the flow of oil (the carrier fluid), aqueous growth media, and a suspension of bacterial cells. We generated a sequence of microdroplets seeded with cells, nutrients, and reagents by coalescing smaller droplets of different solutions.[15] Real-time video feedback enables us to administer volumes with an accuracy of ∼0.3%.
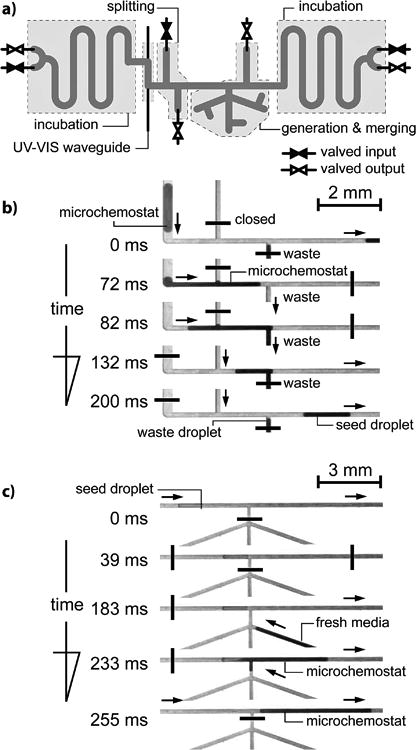
We created a sequence of 164 microdroplet chemostats and cycled them back and forth in pressure driven flow controlled with two pairs of (in/out) valves at each end of the channel (Fig. 2). The microchemostats periodically passed through an in-situ, waveguide spectrophotometer that measured the absorbance of light (λ=600 nm) passing through each droplet over a 5-mm optical path.
Fig. 2.

a) Diagram of the layout of the microfluidic device. b) A sequence of micrographs illustrating the operation of splitting of one microdroplet into a seed droplet and waste droplets with preprogrammed volumes. c) A sequence of micrographs illustrating the fusion of the seed droplet with fresh media to control the chemical composition and number of cells in a microdroplet.
At user-defined intervals, the system exchanges a fraction of the volume of each microdroplet chemostat. First, a microdroplet was accurately divided into two preprogrammed volumes: a waste and a seed droplet (SI, Video S1, Fig. S3 and S4). The waste droplet was removed from the system and the seed droplet was fused (SI, Video S2) with a microdroplet containing fresh reagents. Using this approach, we controlled the concentration of cells and reagents in microdroplets over 10-100 hours (Video S3) and controlled the concentration of soluble factors with an accuracy of ∼0.8% (Fig. S3 and S4). The transfer of a fraction of a growing bacterial population—with its characteristic genotype and phenotype—to new microdroplets containing fresh media and user-defined chemical compositions enabled us to perform experiments of long-term cell growth.
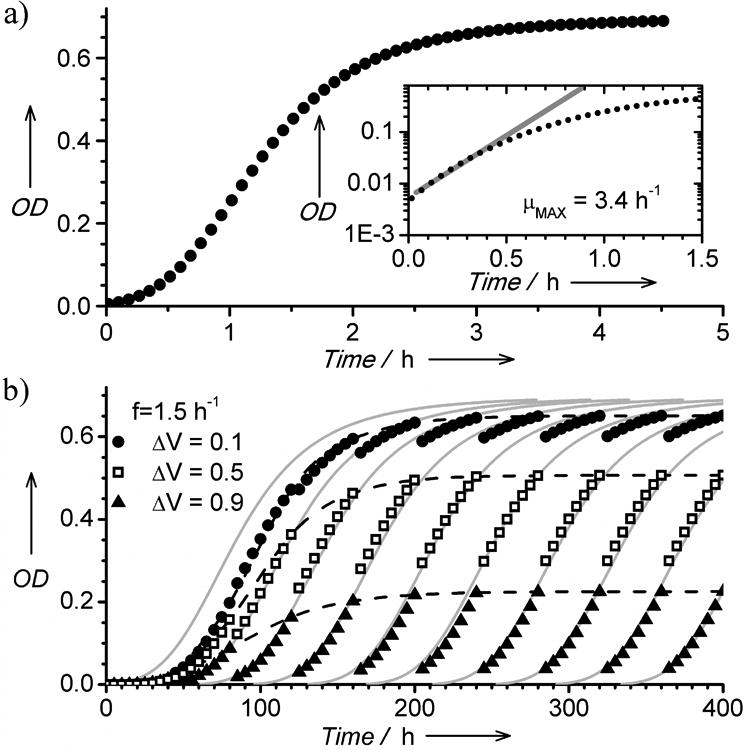
To check the dynamics of growth in microdroplet chemostats we prepared microdroplets (volume: 1.28 μL) containing a suspension of Escherichia coli cells (strain ATCC 25992) at a density of (1.09±0.13 × 10⁷ cfu/mL) in LBK media buffered with 7.0 pH PIPES, which provides a maximal growth rate in anaerobic conditions.[18] A single droplet contained ∼14,000 cells (OD=0.025) at the beginning of cultivation. We cycled the droplets for 600 min and continuously monitored cell density. Growth in microdroplet chemostats (Fig. 3a) was similar to growth in bulk liquid culture, including initial exponential growth, log phase growth, and the stage of saturation. The number of cells N(t) in microdroplet chemostats followed Monod's model:[19] N(t) = N0eμ(C(t))t, where N0 is the initial number of cells, μ(C(t)) = (μMAXC(t))/(KM + C(T)) is the specific growth rate of bacteria [1/h], C(t) is the concentration of the rate limiting nutrient [g/ml], μMAX is the maximum growth rate [1/h], and KM[g/ml] is the saturation parameter corresponding to the substrate concentration that yields half the maximum growth rate. The values of the constants that we determined from fitting the model are consistent with values for E. coli growing in rich nutrient broth.
Fig. 3.

a) Representative growth curve of E coli ATCC 25992 cells in a microdroplet chemostat. The inset plot depicts a calculation of the growth rate by fitting the exponential function. b) A plot illustrating three repetitive growth curves acquired for an extended period of time and with different fractions of exchanged media (either 0.1, 0.5, or 0.9 of the droplet volume). The experimental data points are in good agreement with theoretical curves depicting Monod's model (grey lines).
The conditions in microdroplet chemostats are controlled using three parameters: 1) the chemical composition of the growth media; 2) the frequency of exchanging the culture media; and 3) the fraction of the microdroplet volume that is exchanged. To probe the role of parameters (2) and (3) we created a sequence of 1.28 μL droplets with a low cell concentration (1.09±0.13×10⁷ cfu/mL) and iterated the steps of cycling and exchanging media. The concentration of cells followed Monod's model (Fig. 3a). Initially, the concentration of cells increased with every iteration and reached a periodic trajectory after several iterations (Fig. 3b). The shapes of the growth curves illustrate the approach to a stable cell density NSAT at the moment of exchanging liquids. The region of Monod's curve probed in each (i-th) microchemostat and NSAT depends on the interval Ti between—or frequency of—exchanges, and the fraction ΔVi of the volume V of the droplet that is exchanged.
Cell density in a traditional chemostat depends on the dilution ratio D = Q/V. The analog parameter in microdroplet chemostats is D = fΔV/V. To test how NSAT depends on D we created a sequence of 54 microdroplets, starting with, N0 = 1.09±0.13×10⁷ cfu/mL and tested an 9 × 6 matrix of values of D where ΔV/V ∈ (0.1, 0.9) with a step of 0.1 and f ∈ (0.5, 3) [1/h] with a step of 0.5 [1/h]. At low values of f and ΔV/V, cell density is high. Increasing D decreases NSAT; at extreme values of f and ΔV/V, the culture is unable to regrow within the interval T. Fig. S7 shows that the density of bacterial communities in microdroplet chemostats follows a similar trend to those in traditional chemostats. An appropriate choice of f and ΔV/V enabled us to reduce changes in the optical density that occur duing the exchange of media to less than 10%, providing a close approximation of continuous exchange of media in a classical chemostat (Fig. S8).
Using numerical simulations of the Monod's model we confirmed that the dynamic stability of bacterial populations (i.e. of NSAT) agrees with the small error (σV < 1%) in exchanging the volume ΔV of the microchemostat (Fig. S9). The precision of liquid handling creates exceptionally small variability in the density of bacterial populations: a control experiment conducted over 50 hours yielded variability in NSAT of ≤5% (Fig. S9).
Parallel experiments of microbial population dynamics—including studies of predator/prey and syntrophic interactions—and the response and adaptation of bacteria to chemical and environmental stresses require that no cross-contamination occurs between microchemostats. Long-term control experiments monitoring the concentration of fluorescein in circulating droplets (Fig. S2) and with bacteria, in which we compared the growth rate and saturation density of cells in adjacent microdroplets that either contained LBK nutrient media or LBK admixed with chloramphenicol (10 μg/mL) suggested no cross-contamination (Fig. S10). Low levels of cross-contamination may be expected,[20] however the physical dimensions of the microdroplets and the large separation between them in our system reduces the mass exchange between droplets to negligible levels. Other factors that can reduce cross-contamination include the use of small concentrations of surfactant and fluorinated oils as the continuous phase.
As an application of the system, we determined the parameters of the growth curves of E. coli as a function of the concentration of tetracycline. Parameters extracted from fits of the Monod's equation quantitatively determine the effect of the antibiotic on the growth rate (Fig. S11).
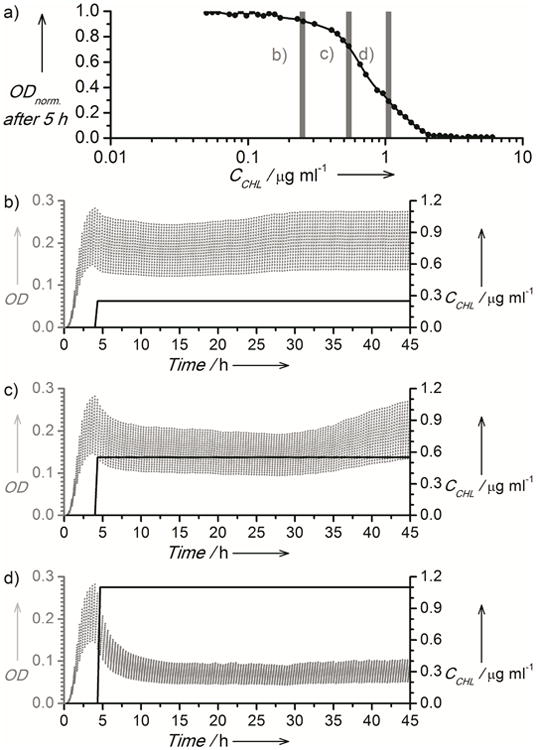
Importantly, the system enables experiments to study the response and adaptation of microorganisms to changing chemical environments. We studied the response of E. coli cells to changes in concentration of chloramphenicol (CCHL). We grew cells in microdroplets chemostats to a steady state in the absence of stress for 4 h (f = 3 h−1, ΔV = 0.5), applied one of three different values of CCHL and monitored the dynamics of bacterial populations over 50 h (Fig. 4b-d). The growth rate of bacteria decreased as chloramphenicol was added and continued to decrease for several generations of growth in the microdroplet chemostats. After a time interval that depended on CCHL, bacteria adapted and growth accelerated and returned to the initial rate. There are several possible explanations for the observed increase in growth rate, including changes in membrane properties,[6] drug efflux, or changes in the structure of the ribosome,[21] which is targeted by chloramphenicol.
Fig. 4.

a) A plot of the relationship between the normalized optical absorbance of E. coli cells (λ =600 nm) and CCHL. Vertical bars indicate concentrations used in adaptation experiments b-d. The right axis of plots b-d depicts the concentration of antibiotic (black solid line), and left axes depict the optical density measured in the microchemostats (grey dots).
We next studied the response of populations of E. coli to slowly increasing CCHL (Fig. S12). We prepared 15 microchemostats consisting of three groups of 5 microdroplets that were treated with increasing CCHL at rates of 0.006, 0.01 or 0.015 μg·mL−1·h−1. The maximum standard deviation in the absorbance between microdroplets in each group was 5.7% (for a rate of 0.006 μg·mL−1·h−1), 6.1% (0.01), and 7.1% (0.015) throughout the 45-hour experiment. Higher rates of chloramphenicol addition produced more variability in growth rates. This observation prompts the question about the relation between the diversity of mutations arising in the population and the level of stress to which it is subject. Another possible explanation is the time scale for growth of persister cells that survive antibiotic dosing.[7] We are currently studying the influence of the rate of antibiotic addition on genetic variation, which is beyond the scope of the present paper.
In summary, microdroplet chemostats enable long-term, highly parallel studies of cell growth in response to extracellular chemical stress. To the best of our knowledge, this system provides the first demonstration of a fully automated droplet microfluidic technology that offers scalability in the number of parallel microchemostats. The physical dimensions and the frequency of droplet formation and manipulation limit the system's scalability.
Previous studies have demonstrated the cultivation of microorganisms inside droplets, which can be advantageous due to several characteristics, including: 1) massive parallelization; [22–24] 2) stochastic confinement;[16] and 3) automation [14,15] The longest cultivation times reported to-date has been several bacterial generations due to limited nutrient availability and the accumulation of secondary metabolites. The microchemostat system we report enables the long-term cultivation of bacteria by exchanging small volumes of liquids between microdroplets and performs parallel studies of the effect of fluctuating chemical environments on the adaptation and dynamics of microbial populations. A remaining technical challenge is to construct the system in a stiff, yet gas permeable polymer that supports aerobic metabolism and alleviates the requirement for buffering the growth media. The system can readily be expanded for an additional feedback control loop to adjust the parameters for media and reagent exchange of media (f, ΔV/V) in response to measured rates of growth. This capability will make it possible to perform long-term experiments on the trajectories of adaptation of microbial communities to chemical stresses. Chemostat studies have demonstrated the remarkably rapid adaptation of bacteria to environmental changes.[6] Our approach complements these experiments by introducing a method for the parallel study of hundreds of individual microchemostats. Importantly, the operational complexity of the system is low and users can rapidly adjust the phase of bacterial growth in experiments and the size and density of bacterial populations.
Importantly, the system that we presented here can be integrated with the capability for splitting large (ca. microliter) droplets containing populations of microorganisms into thousands of monodisperse small (picoliter) droplets[25] for further screening at the single cell level.[22–24] This could open new areas of study, including the distribution of fitness or gene expression in a population subject to changes of the chemical envioronement in which it grows.
These capabilities provide new opportunities for studying the genetic and phenotypic adaptation of bacteria and open a new window for studies of microbial evolution.
Supplementary Material
Acknowledgments
Financial support from the Foundation for Polish Science through TEAM (to P.G.) and START programmes (to T.S.K.) is also acknowledged. We also acknowledge support from the Alfred P. Sloan Foundation (fellowship to D.B.W.) and NIH grant 1DP2OD008735-01 (to D.B.W.). We thank dr Szymon Kaczanowski for helpful discussions.
Footnotes
This project was performed co-financed by the EU European Regional Development Fund under the Operational Programme Innovative Economy NanoFun POIG.02.02.00-00-025/09 (to P.G.) and within the European Research Council Starting Grant 279647 (to P.G.).
Supplemental Information including experimental details, is available on the WWW under ….
Contributor Information
Dr. Slawomir Jakiela, Institute of Physical Chemistry, Polish Academy of Sciences, Kasprzaka 44/52, 01-224 Warsaw, Poland, Fax: (+48) 22 343 33 33.
Tomasz S. Kaminski, Institute of Physical Chemistry, Polish Academy of Sciences, Kasprzaka 44/52, 01-224 Warsaw, Poland, Fax: (+48) 22 343 33 33.
Dr. Olgierd Cybulski, Institute of Physical Chemistry, Polish Academy of Sciences, Kasprzaka 44/52, 01-224 Warsaw, Poland, Fax: (+48) 22 343 33 33
Prof. Douglas B. Weibel, Department of Biochemistry, University of Wisconsin–Madison, 433 Babcock Drive, Madison, WI 53706, USA
Prof. Piotr Garstecki, Email: garst@ichf.edu.pl, Institute of Physical Chemistry, Polish Academy of Sciences, Kasprzaka 44/52, 01-224 Warsaw, Poland, Fax: (+48) 22 343 33 33, Homepage: http://pepe.ichf.edu.pl/pgarstecki/index.html.
References
- 1.Novick A, Szilard L. Science. 1950;112:715–716. doi: 10.1126/science.112.2920.715. [DOI] [PubMed] [Google Scholar]
- 2.James T. Annual Review of Microbiology. 1961;15:27–&. [Google Scholar]
- 3.Topiwala H, Hamer G. Biotechnology and Bioengineering. 1971;13:919–&. doi: 10.1002/bit.260160105. [DOI] [PubMed] [Google Scholar]
- 4.Becks L, Hilker FM, Malchow H, Jurgens K, Arndt H. Nature. 2005;435:1226–1229. doi: 10.1038/nature03627. [DOI] [PubMed] [Google Scholar]
- 5.Lee HH, Molla MN, Cantor CR, Collins JJ. Nature. 2010;467:82–U113. doi: 10.1038/nature09354. [DOI] [PMC free article] [PubMed] [Google Scholar]
- 6.Toprak E, Veres A, Michel JB, Chait R, Hartl DL, Kishony R. Nature Genetics. 2012;44:101–U140. doi: 10.1038/ng.1034. [DOI] [PMC free article] [PubMed] [Google Scholar]
- 7.Balaban NQ, Merrin J, Chait R, Kowalik L, Leibler S. Science. 2004;305:1622–1625. doi: 10.1126/science.1099390. [DOI] [PubMed] [Google Scholar]
- 8.Balagadde FK, You LC, Hansen CL, Arnold FH, Quake SR. Science. 2005;309:137–140. doi: 10.1126/science.1109173. [DOI] [PubMed] [Google Scholar]
- 9.Groisman A, Lobo C, Cho HJ, Campbell JK, Dufour YS, Stevens AM, Levchenko A. Nature Methods. 2005;2:685–689. doi: 10.1038/nmeth784. [DOI] [PubMed] [Google Scholar]
- 10.Au SH, Shih SCC, Wheeler AR. Biomedical Microdevices. 2011;13:41–50. doi: 10.1007/s10544-010-9469-3. [DOI] [PubMed] [Google Scholar]
- 11.Theberge AB, Courtois F, Schaerli Y, Fischlechner M, Abell C, Hollfelder F, Huck WTS. Angewandte Chemie-International Edition. 2010:49, 5846–5868. doi: 10.1002/anie.200906653. [DOI] [PubMed] [Google Scholar]
- 12.Ledeberg J. Journal of Bacteriology. 1954;68:258–259. doi: 10.1128/jb.68.2.258-259.1954. [DOI] [PMC free article] [PubMed] [Google Scholar]
- 13.Leung K, Zahn H, Leaver T, Konwar KM, Hanson NW, Page AP, Lo CC, Chain PS, Hallam SJ, Hansen CL. Proceedings of the National Academy of Sciences of the United States of America; 2012; pp. 7665–7670. [DOI] [PMC free article] [PubMed] [Google Scholar]
- 14.Baraban L, Bertholle F, Salverda MLM, Bremond N, Panizza P, Baudry J, de Visser JAGM, Bibette J. Lab on a Chip. 2011;11:4057–4062. doi: 10.1039/c1lc20545e. [DOI] [PubMed] [Google Scholar]
- 15.Churski K, Kaminski TS, Jakiela S, Kamysz W, Baranska-Rybak W, Weibel DB, Garstecki P. Lab on a Chip. 2012;12:1629–1637. doi: 10.1039/c2lc21284f. [DOI] [PubMed] [Google Scholar]
- 16.Boedicker JQ, Vincent ME, Ismagilov RF. Angewandte Chemie-International Edition. 2009;48:5908–5911. doi: 10.1002/anie.200901550. [DOI] [PMC free article] [PubMed] [Google Scholar]
- 17.Derda R, Tang SKY, Whitesides GM. Angewandte Chemie-International Edition. 2010;49:5301–5304. doi: 10.1002/anie.201001143. [DOI] [PMC free article] [PubMed] [Google Scholar]
- 18.Blankenhorn D, Phillips J, Slonczewski JL. Journal of Bacteriology. 1999;181:2209–2216. doi: 10.1128/jb.181.7.2209-2216.1999. [DOI] [PMC free article] [PubMed] [Google Scholar]
- 19.Monod J. Annales De L Institut Pasteur. 1950;79:390–410. [PubMed] [Google Scholar]
- 20.Skhiri Y, Gruner P, Semin B, Brosseau Q, Pekin D, Mazutis L, Goust V, Kleinschmidt F, El Harrak A, Hutchison JB, et al. Soft Matter. 2012;8:10618–10627. [Google Scholar]
- 21.Pongs O, Bald R, Erdmann V. Proceedings of the National Academy of Sciences of the United States of America; 1973; pp. 2229–2233. [DOI] [PMC free article] [PubMed] [Google Scholar]
- 22.Brouzes E, Medkova M, Savenelli N, Marran D, Twardowski M, Hutchison JB, Rothberg JM, Link DR, Perrimon N, Samuels ML. Proceedings of the National Academy of Sciences of the United States of America; 2009; pp. 14195–14200. [DOI] [PMC free article] [PubMed] [Google Scholar]
- 23.Agresti JJ, Antipov E, Abate AR, Ahn K, Rowat AC, Baret JC, Marquez M, Klibanov AM, Griffiths AD, Weitz DA. Proceedings of the National Academy of Sciences of the United States of America; 2010; pp. 4004–4009. [DOI] [PMC free article] [PubMed] [Google Scholar]
- 24.Baret JC, Beck Y, Billas-Massobrio I, Moras D, Griffiths AD. Chemistry & Biology. 2010;17:528–536. doi: 10.1016/j.chembiol.2010.04.010. [DOI] [PubMed] [Google Scholar]
- 25.Kaminski TS, Jakiela S, Czekalska MA, Postek W, Garstecki P. Lab on a Chip. 2012;12:3995–4002. doi: 10.1039/c2lc40540g. [DOI] [PubMed] [Google Scholar]
Associated Data
This section collects any data citations, data availability statements, or supplementary materials included in this article.


