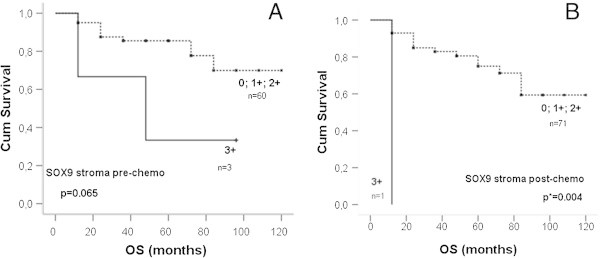
Figure 3.

Kaplan Meier curves in stromal SOX9 expression. A: Cumulative survival in months of Sox9 expression prior to chemotherapy was compared to high expression (3+) und moderate/ no expression (0, 1+, 2+), log-rank P = 0.065. B: Post-chemotherapy survival in months, P = 0.004.
