

Abstract
Small cell lung cancer (SCLC) is an aggressive type of lung cancer, and the detection of SCLCs at an early stage is necessary for successful therapy and for improving cancer survival rates. Fucosylation is one of the most common glycosylation-based modifications. Increased levels of fucosylation have been reported in a number of pathological conditions, including cancers. In this study, we aimed to identify and validate the aberrant and selective fucosylated glycoproteins in the sera of patients with SCLC. Fucosylated glycoproteins were enriched by the Aleuria aurantia lectin column after serum albumin and IgG depletion. In a narrowed down and comparative data analysis of both label-free proteomics and isobaric peptide-tagging chemistry iTRAQ approaches, the fucosylated glycoproteins were identified as up- or down-regulated in the sera of limited disease and extensive disease stage patients with SCLC. Verification was performed by multiple reaction monitoring-mass spectrometry to select reliable markers. Four fucosylated proteins, APCS, C9, SERPINA4, and PON1, were selected and subsequently validated by hybrid A. aurantia lectin ELISA (HLE) and Western blotting. Compared with Western blotting, the HLE analysis of these four proteins produced more optimal diagnostic values for SCLC. The PON1 protein levels were significantly reduced in the sera of patients with SCLC, whereas the fucosylation levels of PON1 were significantly increased. Fucosylated PON1 exhibited an area under curve of 0.91 for the extensive disease stage by HLE, whereas the PON1 protein levels produced an area under curve of 0.82 by Western blot. The glycan structural analysis of PON1 by MS/MS identified a biantennary fucosylated glycan modification consisting of a core + 2HexNAc + 1Fuc at increased levels in the sera of patients with SCLC. In addition, the PON1 levels were decreased in the sera of the Lewis lung carcinoma lung cancer mouse model that we examined. Our data suggest that fucosylated protein biomarkers, such as PON1, and their fucosylation levels and patterns can serve as diagnostic and prognostic serological markers for SCLC.
Lung cancer is the most common cause of cancer death worldwide, with over one million cases annually (World Health Organization, economics of tobacco control). Lung cancer can be divided into four major histological subtypes as follows: adenocarcinoma, squamous cell carcinoma, large cell carcinoma, and small cell carcinoma (1). Small cell lung cancer (SCLC)1 is distinguishable from the other three histological subtypes (non-SCLC) by its distinct histological appearance (1, 2). SCLC is a neuroendocrine lung cancer subtype, which accounts for ∼20% of all lung cancer cases (3). SCLC is an aggressive malignancy that exhibits early metastatic spread and a high relapse rate. Thus, despite current advanced therapeutic strategies, including chemotherapy and radiation therapy, the 5-year survival rates for SCLC remain between 5 and 10% (4, 5). As SCLC is generally metastasized by the time of diagnosis (6), current diagnostic and prognostic workups for SCLC, such as chest x-rays and computed tomography, are far from efficient in terms of early detection. Therefore, the development of novel diagnostic techniques to identify SCLC is important for the earlier diagnosis of primary or recurring cancers to facilitate more effective treatments and improved prognosis (6). The identification of novel serum biomarkers is a prominent solution for the convenient and easy diagnosis and early detection of cancer, and a combination of markers is expected to enhance sensitivity and specificity.
Glycosylation is one of the major post-translational modifications of proteins for cellular function. Approximately 50% of human serum proteins, including secretory and membrane-bound proteins, are suggested to exhibit various N-linked glycosylation patterns (7). Such glycan structures of proteins during carcinogenesis can affect various aspects of the biological behaviors of tumor cells (8–11). In fact, altered glycosylation patterns have long been recognized as hallmarks of cancer progression, in which tumor-specific glycoproteins are actively involved in neoplastic progression and metastasis (12–14). The sensitive detection of such disease-associated glycosylation changes and abnormalities can become a unique landmark to develop diagnostic and prognostic glycoprotein biomarkers.
Among the carbohydrate structures on glycoproteins that are altered during carcinogenesis, much interest has been focused on the terminal monosaccharides, fucose and sialic acid (15, 16). Such terminal structures of monosaccharides are known to be involved in biological functions, including cellular recognition, fertilization, and development (17). Fucose is a constituent of the terminal structure of glycan chains and is associated with cancer and inflammation (10). The altered fucosylation of N-linked glycans has been reported in various cancers such as prostate cancer, breast cancer, liver cancer, ovarian cancer, and pancreatic cancer (18). The biological role of fucosylation in cancer is associated with cancer metastasis, tumor immune surveillance, modification of growth factor receptors, and cancer cell interaction with adhesion molecules (19). Carbohydrate antigen 19-9 and α-fetoprotein (AFP)-L3 fraction, which are fucosylated glycoproteins, have been used as tumor markers in the sera of patients with pancreatic and liver cancers, respectively (20). The fucosylated form of AFP (AFP-L3) has demonstrated more robust diagnostic power than AFP itself (21). Therefore, the analysis of specific glycosylated serum glycoproteins represents an important approach for the development of cancer diagnostic biomarkers.
Glycoproteomic technologies, such as mass spectrometry-based approaches, have significantly improved biomarker discovery. Thus, in this study, we performed a proteomic screening of fucosylated glycoproteins associated with SCLC. We found that altered fucosylated glycoproteins, specifically the altered fucosylated glycan patterns of PON1, can serve as potential diagnostic and prognostic biomarkers for SCLC.
EXPERIMENTAL PROCEDURES
Serum Sample Collection and Albumin/IgG Depletion
Serum samples were collected from the limited disease stage patients with SCLC (LD; 25 samples), the extensive stage patients with SCLC (ED; 29 samples), and the healthy control individuals (HE; 29 samples) from Samsung Hospital (Seoul, Korea). The protocols for this study were approved by the Samsung Hospital Institutional Review Board with informed patient consent. The serum samples were used from the patients with a confirmed diagnosis of SCLC based upon histopathological analysis and clinical history data (Table I and supplemental Table 1). All of the samples were collected from the patients at a preoperative stage following a standardized protocol. The HE serum samples were obtained with informed consent from 29 volunteers who received medical examinations at Samsung Hospital. The serum samples were prepared by collecting blood in empty tubes, which were maintained at room temperature (RT, 30 min) until centrifugation. The serum samples were centrifuged at 1,500 × g for 10 min at 4 °C. After centrifugation, the samples were divided into 500-μl aliquots in cryotubes and immediately stored at −80 °C until use. Each aliquot was thawed no more than twice prior to use. Multiple affinity removal system albumin and IgG removal spin columns (Agilent) were used to deplete these two abundant proteins from the serum samples. The depletion was performed with 500 μl of pooled sera according to the manufacturers' protocols. The depleted serum samples were transferred into Amicon ultra-3-centrifugal devices (Millipore) and centrifuged at 4,000 × g, followed by three washes in double distilled water. Using this process, we reduced the sample volumes from 10 ml to 300 μl.
Table I. The patient clinical parameters of the serum samples used in this study.
| Patient samples utilized in study |
|||
|---|---|---|---|
| HE | LD | ED | |
| Population | 29 | 25 | 29 |
| Gender female/male | 8:21 | 2:23 | 3:26 |
| Age | 53 ± 20 | 62 ± 11 | 65 ± 8 |
| Smoking habit number (Y, Ex, N) | 17:2:10 | 17:6:2 | 22:5:2 |
| ⇓ |
⇓ |
|||||
|---|---|---|---|---|---|---|
| Fucosylated glycoproteins identification using samples |
N-Linked glycan analysis using samples |
|||||
| HE | LD | ED | HE | LD | ED | |
| Population | 5 | 5 | 5 | 10 | 10 | 10 |
| Gender F/M | 0:5 | 0:5 | 0:5 | 0:10 | 0:10 | 0:10 |
| Age | 65 ± 8 | 61 ± 7 | 56 ± 3 | 57 ± 10 | 62 ± 10 | 62 ± 8 |
| Smoking habit number (Y, Ex, N) | 5:0:0 | 5:0:0 | 5:0:0 | 10:0:0 | 10:0:0 | 10:0:0 |
The samples were provided from Seoul Samsung Hospital. The diagnoses were determined by MRI and/or by tissue biopsy. The tumor staging was determined using the Veterans Affairs Lung Study Group staging system for SCLC. Smoking habit: Y, current smoker; Ex, ex-smoker; N, nonsmoker.
Enrichment of Fucosylated Glycoproteins Using AAL Columns
The extraction of the fucosylated glycoproteins was performed as described previously (22) using agarose-bound AAL (purchased from Vector Laboratories, Burlingame, CA). Briefly, spin columns (Bio-Spin from Bio-Rad) were packed with 1 ml of agarose-bound AAL. Next, the albumin/IgG-depleted samples (300 μl) were diluted in 1.7 ml of lectin adsorption buffer (GALAB, Germany), loaded onto the spin columns, and incubated at 4 °C for 16 h. After the unbound proteins were removed by washing with adsorption buffer, the fucosylated glycoproteins were eluted twice with 50 μl of AAL elution buffer (GALAB).
AAL Lectin Blot Analysis
Lectin blot analyses were performed as described previously (22). Briefly, 3 μg of protein from each sample was subjected to 12% SDS-PAGE. After electrophoresis, the gels were transferred onto nitrocellulose membranes (Whatman). The membranes were blocked with phosphate-buffered saline (PBS) containing 3% bovine serum albumin (BSA) at 4 °C overnight and then incubated with biotinylated AAL (1.0 μg/μl; Vector Laboratories) at RT for 1 h. Next, the membranes were washed three times with Tris-buffered saline/Tween 20 (TBS-T), incubated with diluted horseradish peroxidase/streptavidin (Biolegend, CA) at RT for 1 h, washed three additional times with TBS-T, and developed using an ECL system (Amersham Biosciences).
Label-free Proteomic Analysis
Following the fucosylated glycoprotein enrichment, the samples (five HE, five LD, and five ED pooled sera) were subjected to one-dimensional SDS-PAGE (20 μg of protein per lane) and stained with Coomassie Brilliant Blue. The indicated stained protein bands were excised and subjected to in-gel tryptic digestion as reported previously (23). LC-MS/MS analysis was performed using an LTQ mass spectrometer (Thermo Electron, San Jose, CA) equipped with nanospray ionization sources (San Jose, CA). The mass spectrometric analysis conditions were the same as reported previously (24). Briefly, spray voltage was 1.9 kV, and the temperature of the ion transfer tube was set at 190 °C. The normalized collision energy was set at 35%. Data-dependent acquisition mode (m/z 300–1800) was enabled, and each survey MS scan was followed by five MS/MS scans with the 30-s dynamic exclusion option on. The mobile phases consisted of H2O (A) and ACN (B), and both contained 0.1% v/v formic acid. The gradient was started at 2% B, reached 40% B in 50 min, 80% B in the next 5 min, and 100% A in the final 15 min. The tandem mass spectra were extracted, and the charge states were deconvoluted and de-isotoped using Sorcerer 3.4 beta2 (Sorcerer software 3.10.4, Sorcerer Web interface 2.2.0 r334). All of the MS/MS samples were analyzed using SEQUEST (ThermoFinnigan, San Jose, CA; Version 27, Revision 11). SEQUEST was set to query the IPI Human 3.68 database (IPI Version 3.68, 87,061 entries), assuming that trypsin was the digestion enzyme. The SEQUEST search parameters were set to a fragment ion mass tolerance of 1.00 Da and a parent ion tolerance of 1.5 Da. The oxidation of methionine and the iodoacetamide modification of cysteine were specified as the variable modifications. For improved false-positive statistics, the decoy option was selected during the data search process in the Sorcerer program to improve the quality of the results by reducing the noise effects. Subsequently, data comparative analysis using Scaffold (version Scaffold_4.0.5, Proteome Software Inc., Portland, OR) was used to validate the MS/MS-based peptide and protein identification. Peptide identifications were accepted if they could be established at greater than 95% probability by the Peptide Prophet algorithm (25). Protein identifications were accepted if they could be established at greater than 95% probability and contained at least two identified unique peptides. Protein probabilities were assigned by the Protein Prophet algorithm (26). Proteins that contained similar peptides and could not be differentiated based on MS/MS analysis alone were grouped to satisfy the principles of parsimony. The peptide and protein false discovery rate (FDR) was calculated using the Scaffold 4 software. In Scaffold, peptides are considered “incorrectly identified” if they are only in proteins that do not meet the acceptance criteria specified by the “Minimum Protein Probability” or by the “Minimum Number of Peptides.” This means whether a peptide is “correct” or “incorrect” depends upon the probability filter settings chosen. In this case Scaffold bases its calculation of the peptide FDR on the probabilities of the spectra that have been assigned to proteins. The sum of the probabilities of the assigned spectra is divided by the sum of the maximum possible probabilities of those spectra. This result is subtracted from 1 and converted to a percentage. To calculate the protein FDR, Scaffold would sum the probabilities of identified proteins and then divide by the sum of maximum probabilities for each. After identifying the proteins, each dataset was used for a subtractive analysis by semi-quantitative normalized total ion current (TIC), which were normalized by average of all the TIC values of the spectra assigned to a protein in the Scaffold program. Scaffold applied the scaling factor for each sample to each protein group and produced a normalized quantitative value (supplemental MS data).
iTRAQ Labeling Proteomic Analysis
Three groups of fucosylated glycoprotein-eluted samples (same samples from the label-free proteomic analysis, HE, LD, and ED; 100 μg) were buffer-exchanged with double distilled water using Amicon ultra-3-centrifugal devices, and the samples were evaporated using a speed vacuum. Reduction, alkylation, digestion, and iTRAQ labeling were performed according to the manufacturer's protocols (Applied Biosystems, Foster City, CA). Reduction was performed for 1 h at 60 °C after centrifugation;, cysteine blocking agent was added and incubated for 10 min at room temperature. Finally, the overnight digestion was performed at 37 °C with freshly prepared trypsin (2 μg). Each sample was then labeled with one of the three different iTRAQ reagents according to the manufacturer's protocols. The eluted HE-, LD-, and ED-fucosylated glycoprotein samples were labeled with iTRAQ 114, 115, and 116, respectively. After the labeling, the three samples were pooled, and the iTRAQ-labeled peptide pool was cleaned by strong cation-exchange spin tips (PROTEA) to remove excess reagents according to the manufacturer's protocols. After the clean up, an OFFGEL electrophoresis was performed according to the manufacturer's protocols (Agilent). Desalted and dehydrated samples were reconstituted in OFFGEL solution. Isoelectric focusing was performed on an IPG dry strip (13 cm, pH 3–10, linear; GE Healthcare) using a 12-well frame, for 20 kV-h with a maximum current of 50 μA and power of 200 milliwatts. The collected fractions were desalted using C18 spin columns (Thermo Scientific), then evaporated by a speed vacuum, and stored at −20 °C. LC-MS/MS analysis was performed using an LTQ Orbitrap Velos ETD (San Jose, CA). The spray voltage was set to 1.9 kV, and the temperature of the heated capillary was set to 275 °C. The sample was subjected to reverse-phase chromatography using an Easy-nLC system (Thermo Scientific). The mobile phases consisted of H2O (A) and ACN (B), where both phases contained 0.1% v/v formic acid. The flow rate was maintained at 300 nl/min. The peptides were eluted from the analytical column (C18) by a linear gradient running from 13 to 30% acetonitrile over 90 min, to 60% B over the next 7 min, and to 90% B over the final 10 min, followed by direct spray into the LTQ mass spectrometer. Mass spectra were acquired in the positive mode with an m/z window of 350–1,600, and a maximum of five precursors were selected for higher energy collisional dissociation analysis in the Orbitrap (isolation width, 2; minimum signal required, 1,000; normalized collision energy, 45%) with dynamic exclusion. The normalized collision energy was set at 40%. SEQUEST (XCorr Only) (ThermoFinnigan, San Jose, CA; Version v.1.3.0.339) searches were performed against tryptic peptides, allowing for two missed cleavages with 25 ppm (monoisotopic) precursor mass tolerance and 25 ppm (monoisotopic) fragment mass tolerance detected in the Orbitrap. The searches were conducted against an IPI human 3.87 database (IPI Version 3.87, 91,464 entries) with the decoy option enabled, and the iodoacetamide derivative of cysteine and iTRAQ multiplexed quantitation chemistry of lysine and the N terminus were specified in SEQUEST as fixed modification. Oxidation of methionine was specified in SEQUEST as a variable modification. Scaffold (version Scaffold_4.0.5, Proteome Software Inc., Portland, OR) was used to validate MS/MS-based peptide and protein identifications. For the iTRAQ quantification, Scaffold Q+ (version Scaffold_4.0.5, Proteome Software Inc., Portland, OR) program was used to quantitate label-based quantitation peptide and protein identifications. Peptide identifications were accepted if they could be established at greater than 95.0% probability by the Peptide Prophet algorithm (24). Protein identifications were accepted if they could be established at greater than 99.0% probability and contained at least two identified unique peptides. Protein probabilities were assigned by the Protein Prophet algorithm (25). Proteins that contained similar peptides and could not be differentiated based on MS/MS analysis alone were grouped to satisfy the principles of parsimony. Channels were corrected by the matrix [0.000,0.01000,0.925,0.0630,0.00200], [0.000,0.0200,0.919,0.0600,0.001000], [0.000,0.0300,0.920,0.0490,0.001000], and [0.001000,0.0400,0.920,0.0380,0.001000] in all samples according to the algorithm described in i-Tracker (26). Peptides were quantitated using the centroid reporter ion peak intensity. Intra-sample channels were normalized based on the median ratio for each channel across all proteins. Multiple isobaric tag samples were normalized by comparing the median protein ratios for the reference channel. Protein quantitative values were derived from only uniquely assigned peptides. The minimum quantitative value for each spectrum was calculated as 2.8% of the highest peak. The results of these calculations are presented in the supplemental MS data.
Glycosylation Sites Analysis
We used NetNGlyc 1.0 server and NetOGlyc 3.1 server and Uniprot database for statistical analysis of predicting N- and O-linked glycosylation sites in the identified protein list.
LC/MRM-MS Analysis
The three groups of fucosylated glycoprotein enrichment samples (same samples from the label-free proteomic analysis: HE, LD, and ED; 5 samples pooled, 30 μg) were subjected to denaturation, reduction, alkylation, and tryptic digestion. Digested peptide mixture was applied onto a C18 spin column for desalting and was dried. Thirty microliters of 0.1% formic acid in HPLC water was added to dissolve the desalted peptides. One femtomole of a β-galactosidase peptide (293LNVENPK299, Lys heavy labeled) was added to the desalted peptide mixture as a relative internal standard peptide for quantitation. Peptides were separated using Agilent 1260 Infinity LC system with ChipCube Interface (Agilent, Santa Clara, CA). HPLC-Chip consisted of 40 nl of enrichment column, a 75-μm × 150-mm separation column packed with ZORBAX 300SB-C18 5 μm of material, and a nanoelectrospray tip. Separation was performed using binary gradients A (HPLC water in 0.1% formic acid solution) and B (acetonitrile in 0.1% formic acid solution). The column was initially equilibrated and eluted at a flow rate of 0.4 μl/min for the nanopump and 4 μl/min for the capillary pump. The 40-min gradient was programmed as follows: 2.5–40 min, 3–40% B; 40–45 min, 40–80% B; finally, 15 min in 0% B to equilibrate the chip column prior to the injection of the next sample. Peptides were then detected on an Agilent 6490 QQQ mass spectrometer using the following parameters: positive ion mode, 2 kV capillary voltage, drying gas flow rate 11 liters/min at 150 °C, and Q1 and Q3 set to unit resolution. For each protein candidate, two peptides (Rank1 and -2) from the spectral library database (consensus spectral libraries constructed from the 40 public datasets in Human Plasma PeptideAtlas) having the highest spectral counts for a given charge state were selected for MRM analysis methods. In this study, the four most abundant optimized MRM transitions for each peptide were screened. The 492 MRM transitions (targeted protein 62 and targeted peptides 158) from which were selected four of the most intense y ions were screened for signal to noise interference. After screening, 195 abundant optimized MRM transitions (49 target proteins and 49 targeted peptides) were selected, giving total monitored transitions using scheduled MRM. With the total cycle time set to 500 ms, the minimum and maximum dwell times were between 10 and 165 ms, and the window time was 3 min. The data were acquired by Skyline software Version 1.4.0.4421. Skyline was used for data extraction from the intensity chromatograms of the transitions; then the highest (Rank1) peak areas for transition were used for quantitation, and the remaining three transitions served as qualifiers and normalized abundant transition versus internal standard transitions (Q1/Q3 transitions at 411.2/594.3 m/z for the β-galactosidase peptide). Each normalized peak area for the individual transitions was compared with the corresponding transition peaks of other samples to estimate the relative differences among the HE, LD, and ED samples (supplemental MS data).
Immunoblotting
Equal amounts (20 μg) of crude sera were subjected to 12% SDS-PAGE. After electrophoresis, the proteins were transferred onto nitrocellulose membranes (Whatman) and probed using mouse monoclonal antibodies against serum amyloid p component (APCS, AbFrontier, Seoul, Korea), complement component 9 (C9, Abcam), serum paraoxonase 1 (PON1, Abcam), and kallistatin (SERINA4, R&D Systems). The membranes were incubated with mouse anti-APCS (1:1,000), mouse anti-C9 (1:1,000), rabbit anti-SERPINA4 (1:1,000), and mouse anti-PON1 (1:1,000) antibodies overnight at 4 °C. The blots were next incubated with secondary anti-rabbit and anti-mouse IgG HRP-conjugated antibodies (Cell Signaling, 1:2,000) for 1 h at RT. The immunoreactive proteins were detected using the ECL PLUS Western blot analysis system (Amersham Biosciences). Densitometric analysis of the bands was performed using Scion Image (Scion, Frederick, MD).
HLE
The HLE analysis method used in this study was modified and optimized from a previously described version (22) using an ELISA starter kit (Koma Biotech Inc., Korea). Briefly, 96-well plates were coated with 100 ng of APCS, C9, SERPINA4, and PON1 monoclonal antibodies in a 100-μl volume at 37 °C for 3 h. To reduce the background, the plates were incubated with 0.1 ml of oxidation buffer (20 mm sodium periodate)/well for 30 min and blocked with 3% BSA in PBS for 2 h. The plates were next washed four times with washing buffer (PBS-T, PBS with 0.05% Tween 20). The serum samples were diluted 20-fold in PBS, and 100 μl of each sample was added to each well. The samples were incubated at RT for 2 h. After four additional washes, 2,000-fold diluted biotinylated AALs (in PBS-T) were added, and the plates were incubated for 1.5 h at RT. The lectins were detected using horseradish peroxidase/streptavidin and were incubated at RT for 1.5 h followed by additional washes. Next, the 3,3′,5,5′-Tetramethylbenzidine (TMB) substrate was added, followed by the stop solution. To determine the extent of fucosylation, the absorbance of the plates was measured at 450 nm using an ELISA reader (Shimadzu). The results presented are the average values of all the experiments that had been repeated at least twice.
Deglycosylation by Peptide N-Glycosidase F (PNGase F)
One microgram of pooled sera was denatured in buffer at 100 °C for 10 min and then transferred to RT. For complete deglycosylation, the protein was incubated with 1 μl of PNGase F (New England Biolabs) in reaction buffer at 37 °C for 1 h. The deglycosylated proteins were visualized by immunoblotting.
Purification of Serum PON1
An anti-PON1 antibody coupled to protein G-Sepharose 4B (GE Healthcare) was used to purify PON1 from the depleted serum samples. For immunoprecipitation, the protein G-Sepharose beads (300 μl) were washed four times with wash buffer (25 mm Tris-HCl, pH 6.8, 2.7 mm KCl, and 137 mm NaCl). After washing, the beads were equilibrated with 400 μl of coupling buffer (0.1 m NaHCO3, 0.5 m NaCl, pH 8.3), mixed with the PON1 monoclonal antibody (10 μl), and incubated overnight with agitation at 4 °C. The depleted sera (500 μl each) from each of the HE, LD, and ED samples were used for immunoprecipitation. Sepharose beads (80 μl) were added to the albumin- and IgG-depleted samples and incubated with agitation overnight at 4 °C to pre-clear the samples. After pre-clearing, the samples were centrifuged at 1,000 × g, and the supernatants were transferred to new tubes. Next, the supernatants were combined with anti-PON1 antibody-conjugated Sepharose beads and incubated with agitation overnight at 4 °C. Next, the Sepharose beads were washed five times with washing buffer. After the final wash, the beads were eluted three times with the same bead volume of an elution buffer (0.1 m glycine, pH 3).
Analysis of N-Linked Glycans
Three depleted serum samples (pooled from 10 HE, 10 LD, and 10 ED serum samples), which were selected by age, sex, and smoking habits, were derived from 29 HE, 25 LD, and 29 ED total serum samples (Table I) and analyzed for whole N-linked glycan patterns. The N-linked glycans were released from the glycoproteins in the depleted pooled sera by the addition of PNGase F (Roche Applied Science). Next, the released N-glycans were purified using porous graphitic carbon columns. Glycan permethylation was performed using a solid-phase permethylation method (27). The permethylated N-glycans were dissolved in 50% (v/v) methanol/water and then mixed with a 2,5-dihydroxybenzoic acid (Sigma-Aldrich) solution (10 mg/ml in 50% (v/v) methanol/water). The reactions were then spotted onto a stainless steel MALDI plate and dried in a vacuum pot. A Bruker Daltonics Autoflex matrix-assisted laser desorption/ionization time-of-flight mass spectrometer (MALDI-TOF MS) equipped with a 337-nm nitrogen laser (Bruker, Bremen, Germany) was used for the mass spectrometric analyses. The mass resolution of MALDI-TOF MS used for the measurements is 14,500 Full width at half maximum (FWHM). The analysis parameters were as follows: positive ion mode, reflectron mode, detector gain = 3.9 and laser power = 70%. A total of 100 shots from five different spots were scanned to acquire mass spectral data. The three HE, LD, and ED samples were dialyzed at a molecular mass cutoff of 10,000 Da against nanopure water for 12 h and dried completely prior to glycan release.
For the structural analysis of the N-linked glycans in the PON1 protein, 100 μl of a 100 mm ammonium bicarbonate (NH4HCO3), 5 mm DTT (Promega) solution was added to the purified PON1 samples (HE, LD, and ED) and heated to 100 °C for 2 min to denature the proteins. After cooling the samples to RT, 2 μl of PNGase F (New England Biolabs) was added to each mixture, pH 7.5, and incubated at 37 °C for 12 h in a water bath. The released N-glycans were purified and enriched using graphitic carbon columns. Prior to use, each graphitized carbon cartridge (150 mg bed weight, 4 ml cartridge volume) was washed with nanopure water followed by a wash with 80% ACN in 0.05% (v/v) TFA (v/v) and a last wash with nanopure water. The glycan solutions were applied to the graphitic carbon column cartridges and subsequently washed with several cartridge volumes of nanopure water at a flow rate of 1 ml/min to remove the salts. The fucosylated glycans were eluted with a solution of 20% ACN in H2O (v/v). The eluted fractions were collected and concentrated in vacuo and then reconstituted in nanopure water prior to the mass spectrometric analysis. The mass spectra were recorded on an UltrafleXtreme MALDI-TOF/TOF mass spectrometer (Bruker Daltonics GmbH, Bremen, Germany) equipped with a SMARTbeam II laser. We used 2,5-dihydroxybenzoic acid as a matrix (2.5 mg/100 ml in 50% ACN/H2O). A saturated solution of NaCl in 50% ACN in H2O was used as a cation dopant to increase the signal sensitivity. The glycan solution (1.0 μl) was applied to the MALDI probe followed by matrix solution (0.7 μl). The sample was dried under a vacuum prior to mass spectrometry. In MALDI-LIFT-TOF/TOF mode, the precursor ions were accelerated to 8 kV and selected in a timed ion gate. The fragments were further accelerated by 19 kV in the LIFT cell (LIFT means “lifting” the potential energy for the second acceleration of ion source), and their masses were analyzed after the ion reflector passage. The fucosylated glycans were analyzed using a microfluidic HPLC-Chip-qTOF mass spectrometer (Agilent). The microfluidic HPLC-CHIP consisted of an enrichment column, an LC separation column packed with porous graphitized carbon, and a nanoelectrospray tip. Separation was performed using binary gradients A (3% ACN in 0.1% formic acid solution) and B (90% ACN in 0.1% formic acid solution). The column was initially equilibrated and eluted at a flow rate of 0.3 μl/min for the nanopump and 4 μl/min for the capillary pump. The 65-min gradient was programmed as follows: 2.5–20 min, 0–16% B; 20–30 min, 16–44% B; 30–35 min, 45–100% B, up to an additional 45 min in 100% B; and finally, 20 min in 0% B to equilibrate the chip column prior to the injection of the next sample. The identification of each N-glycan was based upon the mass tolerance with additional retention times and the abundance information that was simultaneously noted. The data acquisition and processing were performed using FlexAnalysis 2.4 software (Bruker, Bremen, Germany). The predicted identities of the glycans were derived by GlycoMod tool. The glycan schematics representing the mass peaks were constructed using GlycoWorkbench software.
Analysis of PON1 Protein Levels in the Lung Cancer Mouse Model
Male C57BL/6 mice were purchased from Hyochang Science (Daegu, Korea). All of the mice used in this study were 7–8 weeks of age. The C57BL/6 male mice (n = 9) were inoculated with LLC cells (1 × 10⁶) through the tail vein. In contrast, the normal control mice (n = 7) were injected with PBS through the tail vein. The mice were sacrificed at 10 and 32 days after the initial inoculation of the LLC cells. The lung, liver, and sera samples were harvested for subsequent immunoblotting analysis.
Statistical Analysis
For the Western blot result (Fig. 5), the densitometry data for three groups of APCS and PON1 were statistically analyzed using the nonparametric Kruskal-Wallis test. A post hoc test was performed along with Mann-Whitney U test. The data for C9 and SERPINA4 were analyzed using the parametric analysis of variance. For the HLE result (Fig. 6), statistical significance of fucosylation levels were analyzed using analysis of variance to determine the p value among the groups. The nonparametric Mann-Whitney U test was used in Fig. 9. All of the analyses were performed using Origin 8.0 (OriginLab), and p values ≤ 0.05 were considered statistically significant. The AUC value was determined using the Panel Composer Program, which was provided by the Yonsei Proteome Research Center (Seoul, Korea).
Fig. 5.

Verification of the four selected biomarker candidates by immunoblot and ROC analyses. Western blots of the individual crude sera from the 29 HE, 25 LD and 29 ED patients samples were subjected to densitometry analysis. Densitometric analysis of the WB bands was performed using Scion Image. ROCs were constructed for the four target proteins, as described under “Experimental Procedures.” The densitometric ratio values were calculated as the densitometric value for an individual sample divided by the normalization control value × 100, in which the normalization control was the densitometric value for the five pooled ED-positive control samples. A, APCS. B, C9. C, kallistatin (SERPINA4). D, serum PON1. The p values were calculated using Origin program, as described under “Experimental Procedures.”
Fig. 6.

Fucosylated glycoprotein alterations as indicated by HLE and ROC analyses. HLE analyses were performed in triplicate for the detection of fucosylated APCS, C9, SERPINA4, and PON1 from the 29 HE, 25 LD, and 29 ED crude serum samples. See under “Experimental Procedures” for the development of the HLE. ROCs were also constructed for the four fucosylated target proteins. A, APCS. B, C9. C, kallistatin (SERPINA4). D, serum PON1. The p values were calculated using nonparametric Kruskal-Wallis analysis of variance. The p values were calculated using Origin program, as described under “Experimental Procedures.”
Fig. 9.

PON1 protein was reduced in the sera of the LLC mice. For the in vivo analysis of the serum and liver PON1 protein levels, mice were inoculated with either LLC lung cancer cells (1 × 10⁶) or PBS (normal control) through the tail vain. A, resected lungs at 32 days after PBS or LLC inoculation. The tumor multiplicity is shown in an LLC mouse lung. B and C, PON1 protein levels were analyzed in the sera (B) and the liver tissue lysates (C) of the mice by immunoblotting. D, densitometric analysis of the WB bands was performed. The densitometric value ratios were calculated by dividing the densitometric value for an individual liver tissue lysate sample with the normalization control (β-actin) value. The PON1 levels in the sera were decreased, whereas the levels in liver remained unchanged.
RESULTS
Depletion of Albumin and IgG Proteins and the Enrichment of the Fucosylated Glycoproteins from the Serum Samples
For biomarker discovery purposes, we employed the procedures summarized in Fig. 1. Serum samples were selected from age-, sex-, and smoking habit-matched groups of LD, ED patients, and HE individuals that were collected and pooled (n = 5 or 10), respectively. Table I and supplemental Table 1 show the clinical information of the samples used in this proteomic analysis. To remove the most two abundant proteins from the serum samples, an albumin and IgG depletion procedure was performed. To confirm the efficiency of the depletion, the depleted samples were analyzed by SDS-PAGE, and proteins were visualized by Coomassie Brilliant Blue staining (Fig. 2A). After the depletion of albumin and IgG, the fucosylated glycoproteins were enriched from each serum sample using AAL columns and visualized by Coomassie Brilliant Blue staining (Fig. 2B) for further label-free analysis by LC-MS/MS. To verify the enrichment of the fucosylated glycoproteins, AAL blot analyses were performed. Compared with the flow-through fractions, the highly enriched fucosylated glycoproteins were visible in the eluted samples (Fig. 2C).
Fig. 1.

Schematic representation of the fucosylated glycoproteomics approach for the discovery of serum biomarkers in patients with SCLC. The 5 and (later) 10 pooled serum samples (total 500 μl) from healthy control individuals (HE), limited disease (LD) and extensive disease (ED) stage patients with SCLC were subjected to albumin and IgG depletion, followed by enrichment for the fucosylated glycoproteins using AAL columns. The proteomic profiling of the fucosylated glycoproteins was performed using label-free and iTRAQ labeling analysis using MS. Both proteomic methods (label-free and iTRAQ) were analyzed by two or three technical replicates, respectively. To select the promising candidates for validation, data filtration, comparative data analysis, and small scale verification using LC-MRM-MS analysis were performed on the identified list from both label-free and iTRAQ labeling approaches. The levels of the candidate proteins and their altered fucosylation were verified by Western blot (WB) and hybrid AAL ELISA (HLE) analyses. The 10 pooled serum samples were subjected to N-linked glycan profiling and structural analysis.
Fig. 2.

SDS-PAGE analysis of the albumin- and IgG-depleted and AAL-captured glycoproteins from the pooled serum samples of HE and patients with SCLC. A, pattern check of the albumin- and IgG-depleted human serum samples. The pooled sera from HE, LD, and ED patients were depleted of albumin and IgG using immunoaffinity columns, followed by SDS-PAGE. The purified proteins were visualized by Coomassie Brilliant Blue staining. T, total crude sera; B, albumin and IgG column-bound proteins; D, albumin- and IgG-depleted sera. The most prominent removal was observed in serum albumin (∼66 kDa), which represents ∼50% of the total protein content in crude sera. The IgG heavy chain (∼55 kDa) was also efficiently removed. B, depleted sera were enriched for fucosylated glycoproteins using AAL columns. The flow-through and the AAL-bound fucosylation enriched-proteins were visualized by Coomassie Brilliant Blue staining. Flow-through, AAL column unbound proteins; Elution, AAL column-bound proteins. C, visualization of the same samples from B was performed by AAL blot analysis using biotinylated AAL and horseradish peroxidase-conjugated streptavidin.
Identification of Proteins in the Fucosylation-enriched Samples and Comparative Data Analysis
The enriched fucosylated glycoproteins were in-gel digested for the label-free identification of the proteins by LC-MS/MS in duplicate. For more precise quantitation, the iTRAQ labeling approach was also performed to analyze the intensity of the set of reporter ions, which were generated from the tag-labeled peptides. The three iTRAQ-labeled samples were analyzed in triplicate for protein identification and for relative protein level quantitation by LTQ-OT Velos ETD MS (HE, 114; LD, 115; ED, 116) after OFFGEL fractionation. The significant cutoff thresholds were then evaluated for each set of data. The protein list was filtered by 95% peptide and protein probability using statistical confidence, and proteins with more than two unique peptides were identified within these criteria. The number of proteins identified is shown in Table II and supplemental MS data. The enrichment process of fucosylated glycans by AAL column resulted in the identification of 71% (87 out of 122) potential glycoproteins (supplemental MS data).
Table II. The number of proteins identified by LC-MS/MS analysis for the fucosylated glycoprotein-enriched samples from HE, LD, and ED patients.
| No. of identified proteins |
|||
|---|---|---|---|
| Label-free, 1 set | Label-free, 2 sets | iTRAQ | |
| HE | 73 | 75 | 108 |
| LD | 75 | 78 | |
| ED | 66 | 75 | |
The LC-MS/MS analyses were experimentally performed in duplicate for the label-free approach and in triplicate for the iTRAQ approach per individual sample. A positive protein identification required a minimum of two unique peptides (95% confidence) per protein. The iTRAQ-labeled samples were analyzed for protein identification and relative protein level quantitation using both OFF-gel fractionation with LTQ-OT Velos ETD MS HE, 114; LD, 115; ED, 116) analyses.
Total 186 proteins were identified from two different approaches as follows: the label-free and iTRAQ-labeling approaches. From these two different MS analyses, 130 and 108 proteins were identified, respectively (supplemental MS data). To narrow down the number of potential SCLC marker candidates, we conducted two types of filtrations for the proteins identified (Fig. 3A and supplemental MS data). First, we excluded contaminant proteins (common laboratory contaminant serum proteins such as trypsin, albumin, keratin, and hemoglobin), uncharacterized proteins, and immunoglobulins. Fifteen, 20, and 29 proteins were classified as contaminant proteins, uncharacterized proteins, and immunoglobulins among the total 186-protein list. Second, the protein list from the first filtration was further filtrated based on the existence of the glycosylation sites in the proteins. Among the 122 proteins, 87 proteins turned out to contain N- and O-linked glycosylation sites by the NetNGlyc, NetOGlyc, and Uniprot database analysis. Our goal was to select potent biomarker candidates between HE and SCLC groups. We performed a comparative analysis among the filtered 87 proteins. The comparative data analysis results are summarized in Fig. 3B. First, we selected proteins that were identified in both sets that exhibited greater than 1.3- or 1.5-fold changes in quantitative average TIC values for the label-free approach or for iTRAQ reporter ion intensity ratio in the LD and ED samples compared with the HE samples. In these two sets of label-free approaches, 15 and 22 proteins were up-regulated (>1.3-fold) in LD samples compared with the HE samples, and 16 and 12 proteins were up-regulated in the ED samples compared with the HE samples in each set. In addition, 19 and 20 proteins were down-regulated (<0.77-fold) in the LD samples compared with the HE samples, and 28 and 25 proteins were down-regulated in the ED samples compared with the HE samples in each set (supplemental Table 2). In the iTRAQ labeling approach, 10 and 31 proteins were up-regulated (>1.5-fold) in the LD and ED samples compared with the HE samples, and 33 and 14 proteins were down-regulated (<0.67-fold) in the LD and ED samples compared with the HE samples (supplemental Table 3). In the iTRAQ labeling approach, total up- and down-regulated proteins in the SCLC samples (LD and ED combined) were 33 and 35, respectively. Next, we selected up-regulated (>1.3-fold) or down-regulated (<0.77-fold) proteins through set-wise comparison analyses in the label-free approach (supplemental Table 4); seven proteins were identified in a common pattern in the first and second sets as up-regulated, and seven proteins were identified as down-regulated in the LD samples compared with the HE samples. In the ED samples compared with the HE samples, six proteins showed up-regulation and 13 proteins showed down-regulation commonly in duplicate analyses. The number of up- and down-regulated proteins in the SCLC samples (LD and ED combined) were 11 and 16, respectively, compared with the HE samples. To select potential biomarker candidate proteins, a comparative analysis of the two different proteomic approaches was performed. A final comparison list of up- and down-regulated proteins in both approaches is provided in supplemental Table 5. Up- and down-regulated proteins in the SCLC from both approaches were 40 and 44, respectively. Because 18 proteins showed different change patterns between these two different proteomic analyses, the total regulated proteins were 66. To narrow down more possible potential biomarkers for further verification analysis, we performed quantitative proteomics method LC-MRM MS analysis in small scale samples. We selected target MS-observable peptides and transitions from the PeptideAtlas database. The 62 of 66 target proteins had spectral information; therefore, 62 target proteins were screened by MRM to confirm the transitions that contain significant intensity for relative quantification. From the MRM, it turned out that 49 of 62 targeted proteins were possible for applying scheduled MRM analyses. A list of the targeted peptides observed along with their transitions and their scheduled MRM results are provided in supplemental Table 6. In the result of 5 out of the 49 target proteins, the coefficients of variation were more than 25% in the three replicate analyses, and thus these five proteins were excluded from the list. We then compared the MRM data with the shotgun profiling MS data of the remaining proteins to select target proteins for further antibody-based immunoassays (Table III). Among these proteins, we selected two up-regulated (APCS and C9) and two down-regulated (SERPINA4 and PON1) proteins for further verification analyses.
Fig. 3.

Schematic workflow of narrowing down and comparative data analysis between the label-free and iTRAQ labeling proteomics approaches for the discovery of serum biomarker candidates in SCLC samples. A, all of the data from the label-free and iTRAQ approaches were filtered using two steps to narrow down the candidate list of potential SCLC-selective fucosylated glycoprotein biomarkers. In the first filtration, contaminant proteins, uncharacterized proteins, and immunoglobulins are excluded out from the total list of identified proteins in two approaches. In the second filtration, glycoproteins that have potential N- or O-linked glycosylation sites are selected. B, filtrated proteins are quantified. The label-free approach was performed in duplicate, and the iTRAQ labeling approach was performed in triplicate. The proteins that were identified in both approaches to exhibit greater than 1.3- or 1.5-fold changes of label-free average TIC or iTRAQ reporter ion intensity ratios in the LD and ED samples compared with the HE samples were selected for further analysis.
Table III. A selected list of similar pattern of up- and down-regulated fucosylated glycoproteins in the SCLC samples using MRM and shotgun profiling MS analyses.
| Accession no. | Molecular mass | Label-free fold-change |
iTRAQ-fold change |
MRM-fold change |
||||
|---|---|---|---|---|---|---|---|---|
| LD/HE | ED/HE | LD/HE | ED/HE | LD/HE | ED/HE | |||
| kDa | ||||||||
| SCLC up-regulated proteins (8) | ||||||||
| Gene_Symbol = C4BPA C4b-binding protein α chain | IPI00021727 | 67 | ↑ | ↑ | ↑ | ↑ | ||
| Gene_Symbol = APCS serum amyloid p component | IPI00022391 | 25 | ↑ | ↑ | ↑ | |||
| Gene_Symbol = C9 complement component C9 | IPI00022395 | 63 | ↑ | ↑ | ↑ | ↑ | ||
| Gene_Symbol = AMBP protein AMBP | IPI00022426 | 39 | ↑ | ↓ | ↑ | |||
| Gene_Symbol = SERPINA6 corticosteroid-binding globulin | IPI00027482 | 45 | ↑ | ↑ | ↑ | |||
| Gene_Symbol = C5 complement C5 | IPI00032291 | 188 | ↑ | ↑ | ↑ | |||
| Gene_Symbol = SERPINA7 thyroxine-binding globulin | IPI00292946 | 46 | ↑ | ↑ | ↑ | ↑ | ||
| Gene_Symbol = HP haptoglobin | IPI00641737 | ↑ | ↑ | ↑ | ||||
| SCLC down-regulated proteins (22) | ||||||||
| Gene_Symbol = AOC3 membrane primary amine oxidase | IPI00004457 | 85 | ↓ | ↓ | ↓ | ↓ | ||
| Gene_Symbol = APOD apolipoprotein D | IPI00006662 | 21 | ↓ | ↓ | ↓ | |||
| Gene_Symbol = CDH5 cadherin-5 | IPI00012792 | 88 | ↓ | ↓ | ↓ | ↓ | ||
| Gene_Symbol = PLG plasminogen | IPI00019580 | 91 | ↓ | ↓ | ↓ | ↓ | ↓ | |
| Gene_Symbol = F12 coagulation factor XII | IPI00019581 | 68 | ↓ | ↓ | ↓ | |||
| Gene_Symbol = LUM lumican | IPI00020986 | 38 | ↓ | ↓ | ↓ | ↓ | ||
| Gene_Symbol = APOA1 apolipoprotein A-I | IPI00021841 | 31 | ↓ | ↓ | ↓ | |||
| Gene_Symbol = APOA2 apolipoprotein A-II | IPI00021854 | 11 | ↓ | ↓ | ↓ | |||
| Gene_Symbol = APOC3 apolipoprotein C-III | IPI00021857 | 11 | ↓ | ↓ | ↓ | ↓ | ||
| Gene_Symbol = AHSG cDNA FLJ55606, highly similar to α2-HS-glycoprotein | IPI00022431 | 47 | ↓ | ↓ | ↓ | ↓ | ||
| Gene_Symbol = HPX hemopexin | IPI00022488 | 52 | ↓ | ↓ | ↓ | |||
| Gene_Symbol = A1BG α1B-glycoprotein | IPI00022895 | 54 | ↓ | ↓ | ↓ | |||
| Gene_Symbol = GP5 platelet glycoprotein V | IPI00027410 | 61 | ↓ | ↓ | ↓ | |||
| Gene_Symbol = CFH isoform 1 of complement factor H | IPI00029739 | 139 | ↓ | ↓ | ↓ | |||
| Gene_Symbol = AGT angiotensinogen | IPI00032220 | 53 | ↓ | ↓ | ↓ | |||
| Gene_Symbol = PON1 serum paraoxonase/arylesterase 1 | IPI00218732 | 40 | ↓ | ↓ | ↓ | ↓ | ||
| Gene_Symbol = SELL L-selectin precursor | IPI00218795 | 44 | ↓ | ↓ | ↓ | |||
| Gene_Symbol = CLU isoform 1 of clusterin | IPI00291262 | 52 | ↓ | ↓ | ↓ | |||
| Gene_Symbol = SERPINA4 kallistatin | IPI00328609 | 49 | ↓ | ↓ | ↓ | ↓ | ↓ | |
| Gene_Symbol = SERPINA1 isoform 1 of α1-antitrypsin | IPI00553177 | 47 | ↓ | ↓ | ↓ | |||
| Gene_Symbol = KLKB1 plasma kallikrein | IPI00654888 | 71 | ↓ | ↓ | ||||
| Gene_Symbol = C3 complement C3 (fragment) | IPI00783987 | 187 | ↓ | ↓ | ↓ | |||
For label-free analyses, the LD/HE or ED/HE fold ratios were calculated by dividing the average TIC of LD or ED with the HE. For the iTRAQ labeling approach, the HE samples were labeled with iTRAQ 114 reagent, the LD samples with the iTRAQ 115 reagent, and the ED samples with the iTRAQ 116 reagent. iTRAQ quantitative analysis was performed using the Scaffold 4Q+ program. MRM assays were configured for 44 proteins found in shotgun analyses (both label-free and iTRAQ labeling approaches). MRM data for these analyses are compared relative quantification values of the HE, LD, and ED. Fold change differences from each measurement are indicated by ↑, >1.3-fold changes; ↓, <0.77-fold changes.
Comparative Analysis of N-Linked Glycans in Depleted Serum Samples
We performed a comparative analysis of N-linked glycans in the albumin- and IgG-depleted HE, LD, and ED serum samples. The pooled HE, LD, and ED samples are described in Table I. Total N-linked glycans were released from the glycoproteins in the depleted serum samples by the addition of the PNGase F. The released N-linked glycans were analyzed by MALDI-TOF. The total 30 N-linked glycans were detected in all groups by MALDI-TOF analysis. Among them, 15 were fucosylated glycans (supplemental Table 7). The main differences in the glycans observed in the SCLC ED patients were the increased levels of core fucosylated bi- and triantennary glycans (2,966.3 and 3,776.5 m/z, respectively). Notably, these significantly increased glycans were also fucosylated. The results are shown in Fig. 4.
Fig. 4.

N-Linked glycan analysis of depleted sera by MALDI-TOF MS. N-Linked glycan profiling analysis was performed to select the N-glycosylated proteins in the SCLC patient serum samples for further analysis. Total N-linked glycans were released from the glycoproteins by the addition of peptide N-glycosidase F to the depleted HE, LD, and ED serum samples (500 μl each). The released N-linked glycans were permethylated and analyzed by MALDI-TOF MS. The main N-linked glycan peak differences between the HE and SCLC samples were the core fucosylated bi- and triantennary glycans (2,966.3 and 3,776.5 m/z). All of the N-linked glycans are presented in supplemental Table 7.
Validation of the Up- and Down-regulated Fucosylated Glycoprotein Levels in the SCLC Samples
To confirm the variations in protein levels detected by our comparative data analysis method, the four selected proteins were subjected to Western blot (WB) analysis using the crude nondepleted sera (Fig. 5 and supplemental Fig. 1). APCS, C9, kallistatin (SERPINA4), and serum paraoxonase (PON1) were identified among the list of down- and up-regulated proteins in the SCLC samples. For every WB analysis, we used the same normalization control, which consisted of five pooled SCLC ED serum samples. We measured band intensities by densitometric analysis, and the resulting values were normalized to the positive control values. We performed ROC curve analysis for a total of 83 serum samples, which included the samples from the 29 HE control individuals and the 25 LD and 29 ED patients.
As shown in Fig. 5A, the APCS serum levels were significantly increased in the ED samples compared with the HE samples. The AUC for APCS between the HE and LD samples was 0.662, and this value between the HE and ED samples was 0.734. The C9 serum levels were significantly higher in the LD and ED samples compared with those in the HE samples (Fig. 5B). The AUC value for C9 between the HE and LD samples was 0.849, and the value between the HE and ED samples was 0.834. The serum protein levels of kallistatin (also known as SERPINA4), which was detected as a down-regulated protein in the SCLC samples by LC-MS/MS analysis results, exhibited no significant differences between the samples from the patients with SCLC and the HE controls (Fig. 5C). The discrepancy between the MS and WB data might be attributed to differences in the treatment of the samples and, in part, due to detection method differences. The serum levels of PON1 were significantly lower in the LD and ED samples compared with those in the HE samples (Fig. 5D). The AUC value for PON1 between the HE and LD samples was 0.614, and the value between the HE and ED samples was 0.822.
Analysis of the Fucosylation Levels of Target Proteins in the Sera of SCLC Patients
We next investigated the levels of the fucosylated forms of the APCS, C9, SERPINA4, and PON1 proteins in the SCLC serum samples. To evaluate the fucosylated glycan levels within the four selected proteins, we developed a fucosylated glycoprotein detection system, HLE. The HLE utilizes a specific antibody to capture the target proteins and a biotinylated AAL with HRP-conjugated streptavidin to detect the fucosylated glycans on the target proteins. The fucosylated target protein levels were measured by HLE in the crude sera of 29 HE control individuals, and 25 LD and 29 ED patients (Fig. 6). The levels of fucosylated APCS were increased in the sera of the patients with SCLC. Statistically significant differences were observed between the HE and LD samples, between the HE and ED samples, and between the LD and ED samples. The AUC for APCS between the HE and LD samples was 0.746, whereas that between the HE and ED samples was 0.875 (Fig. 6A). The C9 fucosylation levels were significantly higher in the SCLC samples compared with the HE control samples. The AUC for C9 between the HE and LD samples was 0.690, whereas that between the HE and ED samples was 0.789 (Fig. 6B). The level of fucosylated kallistatin was decreased in the SCLC samples, whereas the protein level itself was not different among the groups. Statistically significant differences were observed between the HE and LD samples and between the HE and ED sample but not between the LD and ED samples. The AUC for SERPINA4 between the HE and LD samples was 0.669, whereas that between the HE and ED samples was 0.667 (Fig. 6C). Surprisingly, the fucosylated PON1 levels were significantly increased in the SCLC samples compared with the HE control samples, and statistical significance was also observed between the LD and ED samples. The AUC for PON1 between the HE and LD samples was 0.773 and that between the HE and ED samples was 0.910 (Fig. 6D). Notably, the pattern of fucosylated PON1 levels was opposite that of the PON1 protein expression levels measured by WB (Fig. 5D).
N-Linked Glycan Analysis of PON1
Taken together, the results suggested that fucosylated PON1 levels could be supportive or more informative as a biomarker of SCLC. In particular, PON1 exhibited different patterns between the levels of the protein itself and the levels of its fucosylation. Therefore, we first investigated whether PON1 has N-linked glycosylation. The serum samples were treated with the PNGase F enzyme and were then subjected to SDS-PAGE (Fig. 7A). Following the PNGase F treatment, immunoblot analysis revealed that the ∼45- and 43-kDa PON1 bands were downshifted to ∼40 and 38 kDa, suggesting that the 45- and 43-kDa bands were an N-linked glycosylated form of PON1. We next tested whether PON1 is fucosylated and whether there is a difference in the extent of fucosylation between the SCLC and the HE control serum samples. PON1 was purified by immunoprecipitation using a PON1-specific antibody from the albumin- and IgG-depleted sera. The immunoprecipitated samples were subjected to WB analysis using the PON1 antibody, followed by reprobing with biotinylated AAL- and HRP-conjugated streptavidin. The results showed that the PON1 protein levels progressively decreased from the HE control to the LD and then to the ED patients. However, the extent of PON1 fucosylation gradually increased from the HE to the ED patients when analyzed by immunoblotting with the AAL (Fig. 7B). Although the PON1 protein levels in the sera of the patients with SCLC were significantly decreased, the fucosylation levels of PON1 were significantly increased.
Fig. 7.
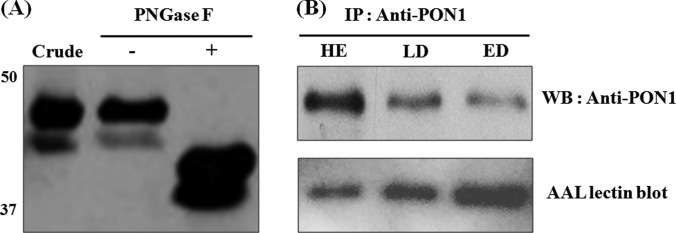
PON1 protein in the sera of the patients with SCLC is highly reactive with fucose-binding lectin. A, serum samples treated with or without PNGase F were analyzed by immunoblotting using a PON1 antibody. The PNGase F treatment reduced the size of the PON1 protein, indicating that the PON1 protein was N-linked glycosylated. Crude, five pooled HE crude sera; −, PNGase F-untreated crude sample; +, PNGase F-treated crude sample. B, comparison of the fucosylation levels of PON1 in the HE, LD, and ED samples. Upper panel, after the immunoprecipitation and purification of PON1 from the depleted serum samples, the same volumes of eluted protein were subjected to SDS-PAGE (12% gel), followed by Western blotting analysis using anti-PON1 antibody. Lower panel, reblotting of the same membrane using biotinylated AAL, followed by HRP-conjugated streptavidin for the detection of the levels of fucosylated PON1 protein.
N-Linked Glycan Structural Analysis of PON-1
Next, we analyzed the structure of the glycans and measured the fucosylated glycan levels of the PON1 glycoprotein. We performed a mass profiling of the PON1 N-linked glycans on the PON1 immunoprecipitated from the HE, LD, and ED patient samples. The exact glycan compositions of hexoses (Hex), N-acetylhexosamines (HexNAc), fucoses (Fuc), and sialic acid (NeuAc) were deduced based on their specific masses. Abundant glycans were further analyzed by tandem mass spectrometry (MS/MS) using high energy collision-induced dissociation (CID) to obtain further information about the structural connectivity of the individual monosaccharides within the native glycans. The representative spectra of the fucosylated N-glycans found in the ED, LD, and HE samples are shown in Fig. 8A. To confirm whether these fucosylated glycans are released from PON1, we performed structural glycan analysis after in-gel PNGase F digestion of the PON1 size band from one-dimensional SDS-PAGE of immunoprecipitation products (supplemental Fig. 2). We confirmed the same fucosylated glycan patterns between in-solution and in-gel targeted band approaches. The putative structures of the abundant species were assigned based on known glycobiology (or N-glycan biosynthesis) and tandem mass spectrometry. The m/z 1,647.62 ([M + Na]+ corresponding to GlcNAc2Man3 + HexNAc2Hex1Fuc1)is the base peak; fucosylated glycans were abundant in all of the samples. The data confirmed that the fucosylated glycans were enriched and were identified in our analysis.
Fig. 8.

Structural and quantitative analyses of the N-linked glycans in the PON1 protein. A, fucosylated N-linked glycan profiling of PON1 protein. PON1 protein was purified from the HE, LD, and ED samples by immunoprecipitation, and the N-linked glycans were released by PNGase F treatment. The purified N-linked glycans from PON1 were analyzed by MALDI-MS. B, representative structural data for the ion at m/z 1,485 by tandem MS. C, biantennary fucosylated glycan consisting of core + 2HexNAc + 1Fuc was readily altered between the HE control to the ED SCLC patient samples. The analysis of the fucosylated glycans from the PON1 glycoprotein was performed in duplicate by Chip-QTOF nano-LC-MS.
To confirm the glycan composition and to obtain detailed structural information, such as the putative glycan structures shown in Fig. 8A, select ions were subjected to tandem mass spectrometry using CID. Tandem MS allows for the detection of ions arising from the sequential loss of individual monosaccharides from the native glycan structures, thus supplementing the compositional data obtained above via MALDI-TOF MS, with information on the interconnectivity of the monosaccharides. A representative CID analysis is shown for the ion at m/z 1,485.534 ([M + Na]+), corresponding to 4HexNAc (2HexNAc and 2GlcNAc), 3Man, and 1Fuc, for which tandem MS provided extensive fragments within a single MS/MS event (see Fig. 8B and supplemental Fig. 2 for further elaboration). The glycosidic bond cleavages corresponding to the loss of the HexNAc, Fuc, and GlcNAc + Fuc residues present in the N-glycan (m/z 1,282, 1,339 and 1,118, respectively) were readily observed, along with fragments corresponding to subsequent monosaccharide losses (i.e. m/z 915, 712, 550, 388, and 226).
The fucosylated glycans from the PON1 glycoprotein were quantitatively analyzed by nano-LC-MS in duplicate. The chromatographic peak areas were used for overall glycan quantitation. Indeed, fucosylated glycans were the most abundant N-glycan species in three samples, accounting for 87.1, 83.6, and 86.5% of the total N-glycans identified in the HE, LD, and ED samples, respectively (supplemental Fig. 3). In addition, the biantennary fucosylated glycans accounted for ∼75% in the three samples, whereas the triantennary fucosylated glycans included the remaining 25%. We monitored changes in the levels of glycosylation of the top six fucosylated glycans (three biantennary: m/z 1,485, 1,647, and 1,809 and three triantennary: m/z 1,688, 1,850, and 2,012) from three samples. Interestingly, the ion at m/z 1,485, which is the second most abundant glycan in all of the samples, readily increased from the HE to the ED samples (Fig. 8C). The remainder of the minor ions did not exhibit any statistically significant changes. These results indicate that the PON1 glycoprotein has various fucosylated glycans and that the second most abundant ion at m/z 1,485 is increased in the SCLC sera compared with the HE control sera.
Serum PON1 Levels Are Reduced in Vivo by Lung Cancer Cells in a Mouse Model
PON1 is reportedly expressed predominantly in the liver (The Human Protein Atlas and Uniprot Database reported). To test in vivo whether lung cancer cells reduce the serum levels of PON1 by influencing its levels in the liver, an LLC orthotropic mouse model was established. The mice were sacrificed at 10 and 32 days after the injection of the LLC cells into the tail vein, and the lungs of normal control (N, n = 7) and LLC-induced mouse (LC, n = 9) were resected. Two out of nine LLC did not develop nodules (LC1 and LC2) and were sacrificed at 10 days after the inoculation of the LLC cells (the N1 and N2 normal counterparts were sacrificed on the same day). The seven other LLC mice developed tumor nodules in the lungs and were sacrificed at 32 days (the N3–N7 normal counterparts were also sacrificed at the same day). Two out of these seven mice developed liver metastases (LC8 and LC9). The resected lungs of the LLC-injected mice exhibited eminent nodules (Fig. 9A). Western blot analysis of the PON1 expression levels in the sera and liver tissue lysates of the LLC mice indicated that the PON1 serum levels were significantly lower in the LC-induced mice than in control (N) mice. However, the PON1 levels in the liver tissue lysates were not significantly different between the N and LC mice. These data indicate that the lung cancer decreased serum PON1 levels. Although the PON1 levels remained unchanged in the liver lysates, it is possible that the half-life of the PON1 protein was decreased by the lung cancer cells or that the lung cancer cells might have degraded the serum PON1, a possibility that has been suggested by other groups (28).
DISCUSSION
In this study, fucosylated glycoproteins enriched by the AAL column were analyzed by two types of comparative proteomic approaches involving label-free and iTRAQ labeling. Among the candidates, four proteins, APCS, C9, SERPINA4, and PON1, were selected for the analysis of their protein levels and extent of fucosylation in SCLC and control serum samples. The PON1 protein levels were decreased, and its fucosylation levels were significantly increased in the SCLC samples. Detailed glycan analysis showed that the fucosylated glycan ion at m/z 1,485.534 is indeed increased in the SCLC samples. Our lung cancer mouse model also showed decreased serum levels of PON1 protein. These data suggest that the measurement of PON1 fucosylation degree can serve as an enhanced diagnostic indicator for SCLC.
We performed multiple proteomics approaches to complement each approach and to find more reliable biomarker candidates for further verification. The use of the label-free approach provided higher numbers of proteins identified, and the iTRAQ labeling approach provides more precise quantitative data. To further substantiate our shotgun proteome discovery results, we applied LC-MRM-MS analysis. MRM analyses provide better reliability of dynamic quantitation for the selection of potential biomarker candidates. The results from our validation of the four proteins were generally congruous with the MS results.
Four proteins were selected as biomarker candidates based upon the following characteristics. 1) Protein functions were involved in a cancer progression. 2) The glycan structures of the proteins were not previously reported. 3) Commercially available antibodies exist for further immunoassays. Of these four proteins, the levels of APCS and C9 were significantly increased, whereas PON1 was significantly decreased in the SCLC samples. Although the median values of SERPINA4 were increased in the LD and ED samples compared with the HE samples, SERPINA4 was not significantly different among the groups according to both WB and densitometric analyses. The SERPINA4 discordance between our LC-MS/MS and WB results might be attributed to differences in the sample treatments; albumin and IgG depletion and fucosylated protein enrichment for the LC-MS/MS analysis were compared with direct crude sera for the WB analysis.
As measured by HLE, the fucosylation levels of APCS and C9 were also significantly increased as the protein levels increased. However, the fucosylation levels of PON1 were significantly increased, whereas the PON1 protein itself was decreased. The fucosylation levels of SERPINA4 were significantly decreased in the SCLC samples. Thus, in the case of SERPINA4, the fucosylated SERPINA4 measurements by HLE revealed a more favorable indicator value for SCLC and, unlike the SERPINA4 protein level itself, exhibited no differential indication between the SCLC and HE control samples. We did not observe any significant changes in protein levels of SERPINA4, APCS, and PON1 of samples derived from early stage patients (disease status between the HE and LD patients). However, the fucosylation levels in these comparisons exhibited significant differences. For APCS and PON1, the HLE analysis demonstrated more favorable differential indicator potentials among HE control, LD, and ED samples. Taken together, measurements by HLE might represent an enhanced approach for the differential diagnosis of patients with SCLC from HE individuals.
In this study, we also report, for the first time, the fucosylated glycan pattern profiling of glycoproteins in the sera of patients with SCLC. Our total N-linked glycan analysis showed that specific fucosylated glycan patterns were increased in albumin- and IgG-depleted SCLC patient sera. In particular, the bi-antennary glycan at m/z 2,966.3 and the tri-antennary core-fucosylated glycan at m/z 3,776.5 were highly detected in the SCLC patient samples but not in the HE samples. Moreover, these two glycans were increased upon disease progression from LD to ED. Therefore, our data indicate that these glycans can serve as potential serum biomarkers for SCLC.
Each candidate protein is associated with cellular processes involved in tumor development and malignant progression. SERPINA4, a unique serine proteinase inhibitor (serpin) and heparin-binding protein, was previously found to inhibit angiogenesis and inflammatory activities in Lewis lung carcinoma mouse models. In another study, the lentivirus-mediated transduction of SERPINA4 impaired tumor growth and enhanced the survival of the Lewis lung carcinoma mice (29). The gene transfer of SERPINA4 was also found to suppress angiogenesis and metastasis in a hepatocellular carcinoma mouse model (30, 31) and in a gastric cancer mouse model (32). The decreased levels of SERPINA4 have also been reported in hepatocellular carcinoma tissue samples compared with normal liver tissue samples as indicated by two dimensional gel electrophoresis with proteomics analysis (33). Our data indicate a mild increase of SERPINA4 protein levels in SCLC samples and a more prominent increase of the fucosylated SERPINA4 form. These findings might represent a defense mechanism for the suppression of the growth and metastasis of SCLC.
APCS, a member of the pentraxin family, has been proposed to play important roles in innate immunity and inflammation. It primarily functions as a protein that is associated with dead cells to facilitate their disposal by professional phagocytes (34). Abnormalities of APCS in patients with cancer have been reported. A comparison of protein profiles of HER2-positive breast cancer patients in serum samples acquired prior to and after preoperative chemotherapy showed that APCS was significantly decreased after chemotherapy (35). Increased APCS levels have also been reported in the plasma samples of a hepatic tumor rat model and in serum samples from c-myc lung cancer tissues as indicated by two dimensional gel electrophoresis-based proteomics analysis (36, 37). Increased APCS levels are also reported in several other types of cancers, such as neuroblastoma (38), lymphoma (39), and renal adenocarcinoma (40). However, there were no differences found in the levels of APCS in the sera of colon cancer patients (41), although the levels of APCS protein were found to be decreased in human stomach adenocarcinoma tissues compared with surrounding normal tissues (42). The increased APCS levels observed in SCLC may be contributed by professional phagocytic cells during the process of phagocytosis and cell killing.
C9 is the pore-forming subunit that is a constituent of the membrane attack complex that plays a key role in the innate immune response by forming pores in the plasma membrane of target cells. Previously, our group reported that fucosylated C9 levels might represent a supportive biomarker for squamous lung cancer (22). In this study, we showed that both C9 protein levels and fucosylated C9 levels can also serve as potential SCLC biomarkers.
Serum PON1 binds to high density lipoprotein (HDL) and contributes to the elimination of organophosphorus-containing compounds, such as paraoxon, and carcinogenic lipid-soluble radicals from lipid peroxidation (43, 44). PON1 is part of an endogenous free radical scavenging system in the human body and has been linked to several cancers, such as endometrial (45), ovarian (46), lung (47), gastric (48), and pancreatic (49) cancers. To the present, these studies were performed on PON1 polymorphisms and the enzymatic activity of serum PON1. The PON1 enzymatic activity levels were decreased in these cancers compared with the HE. More recently, Sun et al. (50) reported that the increased fucosylation and sialylation of serum PON1 could serve as potential glycan biomarkers for the early diagnosis of hepatocellular carcinoma in liver cirrhosis patients. In that study, AAL blotting was also used to detect PON1 that was immunoprecipitated from the sera of the hepatocellular carcinoma patients. In this study, we measured the fucosylated PON1 levels not only by the lectin blotting but also by HLE, which was developed to specifically measure the levels of PON1 fucosylation in a large number of samples at a time. The fucosylated PON1 levels were significantly increased in the sera of the patients with SCLC, whereas the PON1 protein level itself was significantly decreased. In addition, we also analyzed the fucosylated glycan structures of PON1 for the first time by mass spectrometry. Furthermore, our study also showed that the specific fucosylated glycan ion at m/z 1,485 of PON1 was indeed increased in the SCLC samples compared with HE control samples. These data suggest that the PON1 glycoprotein from the ED samples might have higher ratios of fucosylated glycans per given number of PON1 molecules.
The serum levels of PON1 protein might be controlled by the liver. Previous tissue microarray data have revealed that PON1 is highly expressed in liver (The Human Protein Atlas). Therefore, lung cancer cells might influence the PON1 protein levels in the liver and serum. Indeed, our in vivo LLC-induced mouse model showed a significant reduction of PON1 serum levels, consistent with the observations in human cases. However, the PON1 levels in the liver were not significantly different between the control and LLC mice. It is possible that lung cancer cells might not regulate the expression of PON1 in liver cells, but rather might inhibit the secretion of PON1 proteins from the liver cells to the blood. However, the lung cancer cells did not appear to inhibit the secretion of fucosylated PON1 proteins; nonfucosylated or less fucosylated PON1 proteins might be rapidly degraded, whereas fucosylated PON1 proteins might persist longer due to reduced proteolytic degradation in the blood. Thus, highly fucosylated PON1 proteins remained only in the blood of patients with SCLC. Further study is required to elucidate the detailed mechanism underlying how the fucosylated PON1 levels are increased, whereas the total PON1 levels are decreased in lung cancers. Is more fucosylated PON1 synthesized? Is fucosylated PON1 protein more resistant to degradation than nonfucosylated PON1? Is fucosylated PON1 not taken up to macrophages?
Regarding the link between serum paraoxonase family proteins and cancer, PON2/3 were found inside cancers cells, eliciting anti-oxidative effects that protect the cells from the apoptosis triggered by endoplasmic reticulum stress and mitochondrial oxidative stress (28, 51). PON1 is found on circulating HDL particles. However, a recent report has also suggested that it can be redistributed from such lipoprotein particles back into cells (52). Thus, lung cancer cells might take PON1 from the blood for its anti-oxidant activities to prevent oxidative stress-induced cell death, thereby resulting in the reduced serum levels of PON1 that we observed in this study. However, these speculations need to be tested by further experiments.
In summary, our findings show that altered fucosylated glycoproteins, their fucosylated glycan patterns, and the specific glycan characteristics of PON1 can serve as potential biomarkers for the diagnosis of SCLC. These data need to be confirmed using larger patient cohorts to determine whether these glycoprotein/glycan-specific markers are truly reliable. Future studies will determine whether a combination of these glycoprotein/glycan measurements with other biomarkers can significantly improve the sensitivity and specificity of current markers used for the diagnosis of SCLC.
Supplementary Material
Footnotes
* This work was supported by the 21C Frontier Follow-on Support Research and Development Program Grant 2012M3C5A1053342, a Proteogenomics Research Program grant 2012M3A9B9036669, and National Research Foundation of Korea Grant 2012K001536 funded by the Ministry of Science, Information & Communication Technology (ICT), and Future Planning.
 This article contains supplemental Tables 1–7 and Figs. 1–4.
1 The abbreviations used are:
- SCLC
- small cell lung cancer
- HE
- healthy control
- LD
- limited disease stage
- ED
- extensive disease stage
- AFP L3 fraction
- α-fetoprotein L3 fraction
- AAL
- Aleuria aurantia lectin
- TIC
- total ion current
- AUC
- area under curve
- LLC
- Lewis lung carcinoma
- iTRAQ
- isobaric tags for relative and absolute quantitation
- IPI
- International Protein Index
- MRM
- multiple reaction monitoring
- APCS
- serum amyloid p component
- C9
- complement component 9
- PON1
- serum paraoxonase 1
- SERPINA4
- kallistatin
- HLE
- hybrid AAL ELISA
- HRP
- horseradish peroxidase
- PNGase
- peptide N-glycosidase F
- WB
- Western blot
- FDR
- false discovery rate
- Hex
- hexose
- HexNAc
- N-acetylhexosamine
- ACN
- acetonitrile
- ROC
- receiver-operator characteristic curve
- CID
- collision-induced dissociation.
REFERENCES
- 1. Carney D. N., Gazdar A. F., Nau M., Minna J. D. (1985) Biological heterogeneity of small cell lung cancer. Semin. Oncol. 12, 289–303 [PubMed] [Google Scholar]
- 2. Shimosato Y., Nakajima T., Hirohashi S., Morinaga S., Terasaki T., Yamaguchi K., Saijo N., Suemasu K. (1986) Biological, pathological and clinical features of small cell lung cancer. Cancer Lett. 33, 241–258 [DOI] [PubMed] [Google Scholar]
- 3. Parkin D. M., Bray F., Ferlay J., Pisani P. (2005) Global cancer statistics, 2002. CA Cancer J. Clin. 55, 74–108 [DOI] [PubMed] [Google Scholar]
- 4. Rudin C. M., Hann C. L., Peacock C. D., Watkins D. N. (2008) Novel systemic therapies for small cell lung cancer. J. Natl. Compr. Canc. Netw. 6, 315–322 [DOI] [PMC free article] [PubMed] [Google Scholar]
- 5. Chen L. C., Travis W. D., Krug L. M. (2006) Pulmonary neuroendocrine tumors: What (little) do we know? J. Natl. Compr. Canc. Netw. 4, 623–630 [DOI] [PubMed] [Google Scholar]
- 6. Chute J. P., Chen T., Feigal E., Simon R., Johnson B. E. (1999) Twenty years of phase III trials for patients with extensive-stage small-cell lung cancer: perceptible progress. J. Clin. Oncol. 17, 1794–1801 [DOI] [PubMed] [Google Scholar]
- 7. Apweiler R., Hermjakob H., Sharon N. (1999) On the frequency of protein glycosylation, as deduced from analysis of the SWISS-PROT database. Biochim. Biophys. Acta 1473, 4–8 [DOI] [PubMed] [Google Scholar]
- 8. Kannagi R., Izawa M., Koike T., Miyazaki K., Kimura N. (2004) Carbohydrate-mediated cell adhesion in cancer metastasis and angiogenesis. Cancer Sci. 95, 377–384 [DOI] [PMC free article] [PubMed] [Google Scholar]
- 9. Hakomori S. (1989) Aberrant glycosylation in tumors and tumor-associated carbohydrate antigens. Adv. Cancer Res. 52, 257–331 [DOI] [PubMed] [Google Scholar]
- 10. Lau K. S., Partridge E. A., Grigorian A., Silvescu C. I., Reinhold V. N., Demetriou M., Dennis J. W. (2007) Complex N-glycan number and degree of branching cooperate to regulate cell proliferation and differentiation. Cell 129, 123–134 [DOI] [PubMed] [Google Scholar]
- 11. Partridge E. A., Le Roy C., Di Guglielmo G. M., Pawling J., Cheung P., Granovsky M., Nabi I. R., Wrana J. L., Dennis J. W. (2004) Regulation of cytokine receptors by Golgi N-glycan processing and endocytosis. Science 306, 120–124 [DOI] [PubMed] [Google Scholar]
- 12. Kobata A. (1989) Altered glycosylation of surface glycoproteins in tumor cells and its clinical application. Pigment Cell Res. 2, 304–308 [DOI] [PubMed] [Google Scholar]
- 13. Kobata A., Amano J. (2005) Altered glycosylation of proteins produced by malignant cells, and application for the diagnosis and immunotherapy of tumours. Immunol. Cell Biol. 83, 429–439 [DOI] [PubMed] [Google Scholar]
- 14. Dennis J. W., Granovsky M., Warren C. E. (1999) Glycoprotein glycosylation and cancer progression. Biochim. Biophys. Acta 1473, 21–34 [DOI] [PubMed] [Google Scholar]
- 15. Miyagi T., Wada T., Yamaguchi K., Hata K. (2004) Sialidase and malignancy: a minireview. Glycoconj. J. 20, 189–198 [DOI] [PubMed] [Google Scholar]
- 16. Becker D. J., Lowe J. B. (2003) Fucose: biosynthesis and biological function in mammals. Glycobiology 13, 41R–53R [DOI] [PubMed] [Google Scholar]
- 17. Orczyk-Pawilowicz M., Katnik-Prastowska I. (2011) Terminal monosaccharide expression on amniotic glycoproteins as biomarkers of fetus maturity. Biochem. Soc. Trans. 39, 344–348 [DOI] [PubMed] [Google Scholar]
- 18. Miyoshi E., Moriwaki K., Nakagawa T. (2008) Biological function of fucosylation in cancer biology. J. Biochem. 143, 725–729 [DOI] [PubMed] [Google Scholar]
- 19. Moriwaki K., Miyoshi E. (2010) Fucosylation and gastrointestinal cancer. World J. Hepatol. 2, 151–161 [DOI] [PMC free article] [PubMed] [Google Scholar]
- 20. Szymendera J. J. (1986) Clinical usefulness of three monoclonal antibody-defined tumor markers: CA 19–9, CA 50, and CA 125. Tumour Biol. 7, 333–342 [PubMed] [Google Scholar]
- 21. Aoyagi Y., Saitoh A., Suzuki Y., Igarashi K., Oguro M., Yokota T., Mori S., Suda T., Isemura M., Asakura H. (1993) Fucosylation index of α-fetoprotein, a possible aid in the early recognition of hepatocellular carcinoma in patients with cirrhosis. Hepatology 17, 50–52 [PubMed] [Google Scholar]
- 22. Narayanasamy A., Ahn J. M., Sung H. J., Kong D. H., Ha K. S., Lee S. Y., Cho J. Y. (2011) Fucosylated glycoproteomic approach to identify a complement component 9 associated with squamous cell lung cancer (SQLC). J. Proteomics 74, 2948–2958 [DOI] [PubMed] [Google Scholar]
- 23. Heo S. H., Lee S. J., Ryoo H. M., Park J. Y., Cho J. Y. (2007) Identification of putative serum glycoprotein biomarkers for human lung adenocarcinoma by multilectin affinity chromatography and LC-MS/MS. Proteomics 7, 4292–4302 [DOI] [PubMed] [Google Scholar]
- 24. Keller A., Nesvizhskii A. I., Kolker E., Aebersold R. (2002) Empirical statistical model to estimate the accuracy of peptide identifications made by MS/MS and database search. Anal. Chem. 74, 5383–5392 [DOI] [PubMed] [Google Scholar]
- 25. Nesvizhskii A. I., Keller A., Kolker E., Aebersold R. (2003) A statistical model for identifying proteins by tandem mass spectrometry. Anal. Chem. 75, 4646–4658 [DOI] [PubMed] [Google Scholar]
- 26. Shadforth I. P., Dunkley T. P., Lilley K. S., Bessant C. (2005) i-Tracker: for quantitative proteomics using iTRAQ. BMC Genomics 6, 145. [DOI] [PMC free article] [PubMed] [Google Scholar]
- 27. Kang P., Mechref Y., Novotny M. V. (2008) High-throughput solid-phase permethylation of glycans prior to mass spectrometry. Rapid Commun. Mass Spectrom. 22, 721–734 [DOI] [PubMed] [Google Scholar]
- 28. Schweikert E. M., Devarajan A., Witte I., Wilgenbus P., Amort J., Förstermann U., Shabazian A., Grijalva V., Shih D. M., Farias-Eisner R., Teiber J. F., Reddy S. T., Horke S. (2012) PON3 is upregulated in cancer tissues and protects against mitochondrial superoxide-mediated cell death. Cell Death Differ. 19, 1549–1560 [DOI] [PMC free article] [PubMed] [Google Scholar]
- 29. Shiau A. L., Teo M. L., Chen S. Y., Wang C. R., Hsieh J. L., Chang M. Y., Chang C. J., Chao J., Chao L., Wu C. L., Lee C. H. (2010) Inhibition of experimental lung metastasis by systemic lentiviral delivery of kallistatin. BMC Cancer 10, 245. [DOI] [PMC free article] [PubMed] [Google Scholar]
- 30. Jiang X., Li H., Qiao H., Jiang H., Xu R., Sun X. (2009) Combining kallistatin gene therapy and meloxicam to treat hepatocellular carcinoma in mice. Cancer Sci. 100, 2226–2233 [DOI] [PMC free article] [PubMed] [Google Scholar]
- 31. Tse L. Y., Sun X., Jiang H., Dong X., Fung P. W., Farzaneh F., Xu R. (2008) Adeno-associated virus-mediated expression of kallistatin suppresses local and remote hepatocellular carcinomas. J. Gene Med. 10, 508–517 [DOI] [PubMed] [Google Scholar]
- 32. Zhu B., Lu L., Cai W., Yang X., Li C., Yang Z., Zhan W., Ma J. X., Gao G. (2007) Kallikrein-binding protein inhibits growth of gastric carcinoma by reducing vascular endothelial growth factor production and angiogenesis. Mol. Cancer Ther. 6, 3297–3306 [DOI] [PubMed] [Google Scholar]
- 33. Luo Q., Siconolfi-Baez L., Annamaneni P., Bielawski M. T., Novikoff P. M., Angeletti R. H. (2007) Altered protein expression at early-stage rat hepatic neoplasia. Am. J. Physiol. Gastrointest. Liver Physiol. 292, G1272–G1282 [DOI] [PubMed] [Google Scholar]
- 34. Merchant S., Sun J., Korbelik M. (2007) Dying cells program their expedient disposal: serum amyloid P component upregulation in vivo and in vitro induced by photodynamic therapy of cancer. Photochem. Photobiol. Sci. 6, 1284–1289 [DOI] [PubMed] [Google Scholar]
- 35. Mazouni C., Baggerly K., Hawke D., Tsavachidis S., André F., Buzdar A. U., Martin P. M., Kobayashi R., Pusztai L. (2010) Evaluation of changes in serum protein profiles during neoadjuvant chemotherapy in HER2-positive breast cancer using an LC-MALDI-TOF/MS procedure. Proteomics 10, 3525–3532 [DOI] [PubMed] [Google Scholar]
- 36. Park S. Y., Phark S., Lee M., Zheng Z., Choi S., Won N. H., Jung W. W., Sul D. (2010) Evaluation of plasma carcinogenic markers in rat hepatic tumors models induced by rat hepatoma N1-S1 cells and benzo[a]pyrene. Arch. Pharm. Res. 33, 247–255 [DOI] [PubMed] [Google Scholar]
- 37. Chatterji B., Borlak J. (2009) A 2-DE MALDI-TOF study to identify disease regulated serum proteins in lung cancer of c-myc transgenic mice. Proteomics 9, 1044–1056 [DOI] [PubMed] [Google Scholar]
- 38. Sandoval J. A., Turner K. E., Hoelz D. J., Rescorla F. J., Hickey R. J., Malkas L. H. (2007) Serum protein profiling to identify high-risk neuroblastoma: preclinical relevance of blood-based biomarkers. J. Surg. Res. 142, 268–274 [DOI] [PMC free article] [PubMed] [Google Scholar]
- 39. Kristiansson M. H., Bhat V. B., Babu I. R., Wishnok J. S., Tannenbaum S. R. (2007) Comparative time-dependent analysis of potential inflammation biomarkers in lymphoma-bearing SJL mice. J. Proteome Res. 6, 1735–1744 [DOI] [PMC free article] [PubMed] [Google Scholar]
- 40. Hind C. R., Tennent G. A., Evans D. J., Pepys M. B. (1983) Demonstration of amyloid A (AA) protein and amyloid P component (AP) in deposits of systemic amyloidosis associated with renal adenocarcinoma. J. Pathol. 139, 159–166 [DOI] [PubMed] [Google Scholar]
- 41. Levo Y., Wollner S., Treves A. J. (1986) Serum amyloid P-component levels in patients with malignancy. Scand. J. Immunol. 24, 147–151 [DOI] [PubMed] [Google Scholar]
- 42. Jang J. S., Cho H. Y., Lee Y. J., Ha W. S., Kim H. W. (2004) The differential proteome profile of stomach cancer: identification of the biomarker candidates. Oncol. Res. 14, 491–499 [DOI] [PubMed] [Google Scholar]
- 43. Aviram M., Rosenblat M., Bisgaier C. L., Newton R. S., Primo-Parmo S. L., La Du B. N. (1998) Paraoxonase inhibits high-density lipoprotein oxidation and preserves its functions. A possible peroxidative role for paraoxonase. J. Clin. Invest. 101, 1581–1590 [DOI] [PMC free article] [PubMed] [Google Scholar]
- 44. Mackness M. I., Arrol S., Durrington P. N. (1991) Paraoxonase prevents accumulation of lipoperoxides in low-density lipoprotein. FEBS Lett. 286, 152–154 [DOI] [PubMed] [Google Scholar]
- 45. Arioz D. T., Camuzcuoglu H., Toy H., Kurt S., Celik H., Erel O. (2009) Assessment of serum paraoxonase and arylesterase activity in patients with endometrial cancer. Eur. J. Gynaecol. Oncol. 30, 679–682 [PubMed] [Google Scholar]
- 46. Camuzcuoglu H., Arioz D. T., Toy H., Kurt S., Celik H., Erel O. (2009) Serum paraoxonase and arylesterase activities in patients with epithelial ovarian cancer. Gynecol. Oncol. 112, 481–485 [DOI] [PubMed] [Google Scholar]
- 47. Elkiran E. T., Mar N., Aygen B., Gursu F., Karaoglu A., Koca S. (2007) Serum paraoxonase and arylesterase activities in patients with lung cancer in a Turkish population. BMC Cancer 7, 48. [DOI] [PMC free article] [PubMed] [Google Scholar]
- 48. Akçay M. N., Yilmaz I., Polat M. F., Akçay G. (2003) Serum paraoxonase levels in gastric cancer. Hepatogastroenterology 50 (Suppl. 2), cclxxiii–cclxxv [PubMed] [Google Scholar]
- 49. Akçay M. N., Polat M. F., Yilmaz I., Akçay G. (2003) Serum paraoxonase levels in pancreatic cancer. Hepatogastroenterology 50 (Suppl. 2), ccxxv–ccxxvii [PubMed] [Google Scholar]
- 50. Sun C., Chen P., Chen Q., Sun L., Kang X., Qin X., Liu Y. (2012) Serum paraoxonase 1 heteroplasmon, a fucosylated, and sialylated glycoprotein in distinguishing early hepatocellular carcinoma from liver cirrhosis patients. Acta Biochim. Biophys. Sin. 44, 765–773 [DOI] [PubMed] [Google Scholar]
- 51. Witte I., Altenhöfer S., Wilgenbus P., Amort J., Clement A. M., Pautz A., Li H., Förstermann U., Horke S. (2011) Beyond reduction of atherosclerosis: PON2 provides apoptosis resistance and stabilizes tumor cells. Cell Death Dis. 2, e112. [DOI] [PMC free article] [PubMed] [Google Scholar]
- 52. Deakin S. P., Bioletto S., Bochaton-Piallat M. L., James R. W. (2011) HDL-associated paraoxonase-1 can redistribute to cell membranes and influence sensitivity to oxidative stress. Free Radic. Biol. Med. 50, 102–109 [DOI] [PubMed] [Google Scholar]
Associated Data
This section collects any data citations, data availability statements, or supplementary materials included in this article.