

Abstract
It has been shown that SIRT7 regulates rDNA transcription and that reduced SIRT7 levels inhibit tumor growth. This anti-tumor effect could be due to reduced Pol I activity and perturbed ribosome biogenesis. In this study, using pulse labeling with RNA and amino acid analogs, we found that SIRT7 knockdown efficiently suppressed both RNA and protein synthesis. Surprisingly, SIRT7 knockdown preferentially inhibited protein synthesis over rDNA transcription, whereas the levels of both were reduced to similar extents following Pol I knockdown. Using an affinity purification mass spectrometry approach and functional analyses of the resulting SIRT7 interactome, we identified and validated SIRT7 interactions with proteins involved in ribosomal biogenesis. Indeed, SIRT7 co-fractionated with monoribosomes within a sucrose gradient. Using reciprocal isolations, we determined that SIRT7 interacts specifically with mTOR and GTF3C1, a component of the Pol III transcription factor TFIIIC2 complex. Further studies found that SIRT7 knockdown triggered an increase in the levels of LC3B-II, an autophagosome marker, suggesting a link between SIRT7 and the mTOR pathway. Additionally, we provide several lines of evidence that SIRT7 plays a role in modulating Pol III function. Immunoaffinity purification of SIRT7-GFP from a nuclear fraction demonstrated specific SIRT7 interaction with five out of six components of the TFIIIC2 complex, but not with the TFIIIA or TFIIIB complex, the former of which is required for Pol III–dependent transcription of tRNA genes. ChIP assays showed SIRT7 localization to the Pol III targeting genes, and SIRT7 knockdown triggered a reduction in tRNA levels. Taken together, these data suggest that SIRT7 may regulate Pol III transcription through mTOR and the TFIIIC2 complex. We propose that SIRT7 is involved in multiple pathways involved in ribosome biogenesis, and we hypothesize that its down-regulation may contribute to an antitumor effect, partly through the inhibition of protein synthesis.
Recent studies have shown that SIRT7 exhibits oncogenic activity, maintaining tumor growth (i.e. tumor cell proliferation) (1, 2). Overexpression of SIRT7 is associated with multiple types of cancers (1–3) and malignancy (2). Like yeast Sir2, SIRT7 localizes within nucleoli (4, 5), the center for ribosome biogenesis (6). In addition, SIRT7 can regulate rDNA transcription through deacetylation of the Pol I complex (7) or through interaction with chromatin remodeling complexes within nucleoli (8). It is likely that a yet undescribed role for SIRT7 in ribosome biogenesis may contribute to tumor cell proliferation, possibly in parallel with its regulation of Pol I transcription.
The coordination between a cell's growth and its division relies on molecular pathways connecting the factors involved in ribosome biogenesis to those involved in cell-cycle checkpoint maintenance. For example, many mitogenic signals converge on the mTOR and extracellular signal-regulated kinase (ERK) pathways that activate Pol I transcription through the phosphorylation of key Pol I–regulatory factors (e.g. TIF-IA and UBF) (6, 9). At the same time, mTOR and ERK also promote cell cycle progression and, therefore, proliferation through the phosphorylation of cell-cycle checkpoints (6, 9). In an opposing mechanism, the perturbation of ribosome biogenesis (10–12) triggers nucleolar stress and the activity of related signaling pathways that use ribosome proteins to induce p53-mediated cell-cycle arrest (13). Ribosomal proteins (e.g. RPL11) propagate this nucleolar stress signal through their interaction with MDM2 and subsequent inhibition of MDM2 E3 ligase activity, which ultimately leads to p53 stabilization (11, 14). The interconnected pathways linking ribosome biogenesis and cell-cycle progression provide an intracellular network through which SIRT7 may regulate tumor cell proliferation.
As SIRT7 is an emerging target for anticancer therapies, it is important to determine whether the role of SIRT7 is restricted to its function in Pol I transcription. Here, we sought to understand the effects of SIRT7 knockdown on the inhibition of transcription and translation. First, using immunoaffinity purifications of SIRT7-GFP from either whole cell lysates or nuclear fractions and reciprocal isolations, we determined that SIRT7 specifically interacts with ribosomal proteins, mTOR, the TFIIIC2 complex, and other proteins involved in ribosome biogenesis. Second, we demonstrated that SIRT7 knockdown reduced steady-state rRNA levels via diminished synthesis rates, but slightly extended the turnover rates of newly synthesized RNA. Third, we showed that SIRT7 associates with monoribosomes and that its knockdown reduces protein synthesis rates. Importantly, we demonstrate that, relative to Pol I knockdown, SIRT7 knockdown preferentially suppresses protein rather than RNA synthesis rates. Finally, using chromatin immunoprecipitation, we found that SIRT7 can target genetic regions transcribed by Pol III and that SIRT7 knockdown triggered a reduction in tRNA. Our results suggest that SIRT7 may regulate Pol III function through interaction with mTOR and TFIIIC2. Together, these results lead us to propose a model in which SIRT7 plays multiple roles in ribosome biogenesis, including in the regulation of Pol I and Pol III transcription.
EXPERIMENTAL PROCEDURES
Reagents and Cell Culture
Rabbit polyclonal anti-SIRT7 and mouse monoclonal anti-β tubulin antibodies were generous gifts from Dr. Izumi Horikawa (NCI, NIH) (5) and Dr. Thomas Shenk (Princeton University), respectively. Other antibodies, oligo primers (Integrated DNA Technologies, Coralville, IA), and siRNA (Sigma) used in this study are listed in supplemental Table S1. A HEK293 cell line stably expressing SIRT7-EGFP fusion protein was established as previously described (8). Human HeLa (cervical cancer) cells were maintained in DMEM (Invitrogen) supplemented with 10% fetal bovine serum (FBS) and 1% penicillin-streptomycin solution (Invitrogen).
siRNA Knockdown and Real-time Quantitative PCR
Transfection of siRNA was performed using Lipofectamine RNAiMAX (Invitrogen) at a final siRNA concentration of 20 nm in each experiment. After either 2 or 3 days of incubation with siRNA, as indicated for specific experiments, treated cells were prepared for the subsequent analyses. The RNA levels of targeted genes upon treatment with either gene-specific siRNA or scrambled siRNA treatment were monitored via real-time quantitative PCR. Briefly, mRNA was purified using Trizol (Invitrogen) and converted to cDNA through reverse transcription (Retroscript, Ambion, Austin, TX). Primer sets representing the genes of interest (supplemental Table S1) were mixed with the cDNA along with a DNA polymerase mixture containing SYBR green I dye (Power SYBR Green PCR Master Mix, ABI, Foster City, CA) for real-time quantitative PCR analysis (ABI 7900HT). Normalization was performed using GAPDH as an internal control.
Ribonuclease A Treatment
Ribonuclease A (RNase A)1 treatments was performed as described (15), with slight modifications. HeLa cells were grown on millicell EZ slides (Millipore, Billerica, MA) and treated with 0.2 mg/ml RNase A. Mock treatments were performed using 0.02% Triton X-100/2 mm MgCl2/PBS, but without RNase A. After a 5-min incubation at room temperature, cells were fixed with 3.7% paraformaldehyde for 15 min, washed with PBS, incubated with 5% FBS for 1 h, and analyzed via immunofluorescence microscopy on a PerkinElmer RS3 Spinning Disk.
Detection of Newly Synthesized RNA and Protein in Cultured Cells
A nonisotopic labeling method for detecting newly synthesized RNA and protein relies on the incorporation of 5-ethynyluridine (EU) into RNA and l-homopropargylglycine (HPG) for protein. Subsequent copper (I)-catalyzed cycloaddition with fluorescent azide Alexa 488 was performed with the Click-iT® assay system (Invitrogen) (16). For EU signals measured via fluorescent microscopy, the background fluorescence was determined from the area outside the cells and subtracted from the cellular signal. Total cellular fluorescence was derived using the following formula: normalized total cell fluorescence = total cell fluorescence − (area of selected cell × mean fluorescence of selected background). Normalized fluorescence values are reported as “EU fluorescence” (Fig. 1C). For acquiring either EU or HPG incorporation profiles, we analyzed large cell populations (n ≥ 10,000) by flow cytometry. For the analysis of nascent RNA synthesis, cells treated with siRNA for 2 days were treated with 10 μg/ml α-amanitin for 1 h, labeled with 0.5 mm EU for 1 h, and then digested with trypsin to achieve a single cell suspension. For protein synthesis analysis, cells were grown in methionine- and cysteine-free medium for 1 h and then subjected to HPG labeling for 2 h. After pulse-labeling RNA or protein with either EU or HPG, cells were washed with PBS once and resuspended in 80% ethanol for 15 min on ice. After this fixation step, Alexa 488 conjugation and subsequent procedures were carried out as described by the supplier (Invitrogen). Labeled cells were resuspended in PBS for flow cytometry analysis on a BD LSRII Multi-Laser Analyzer.
Fig. 1.
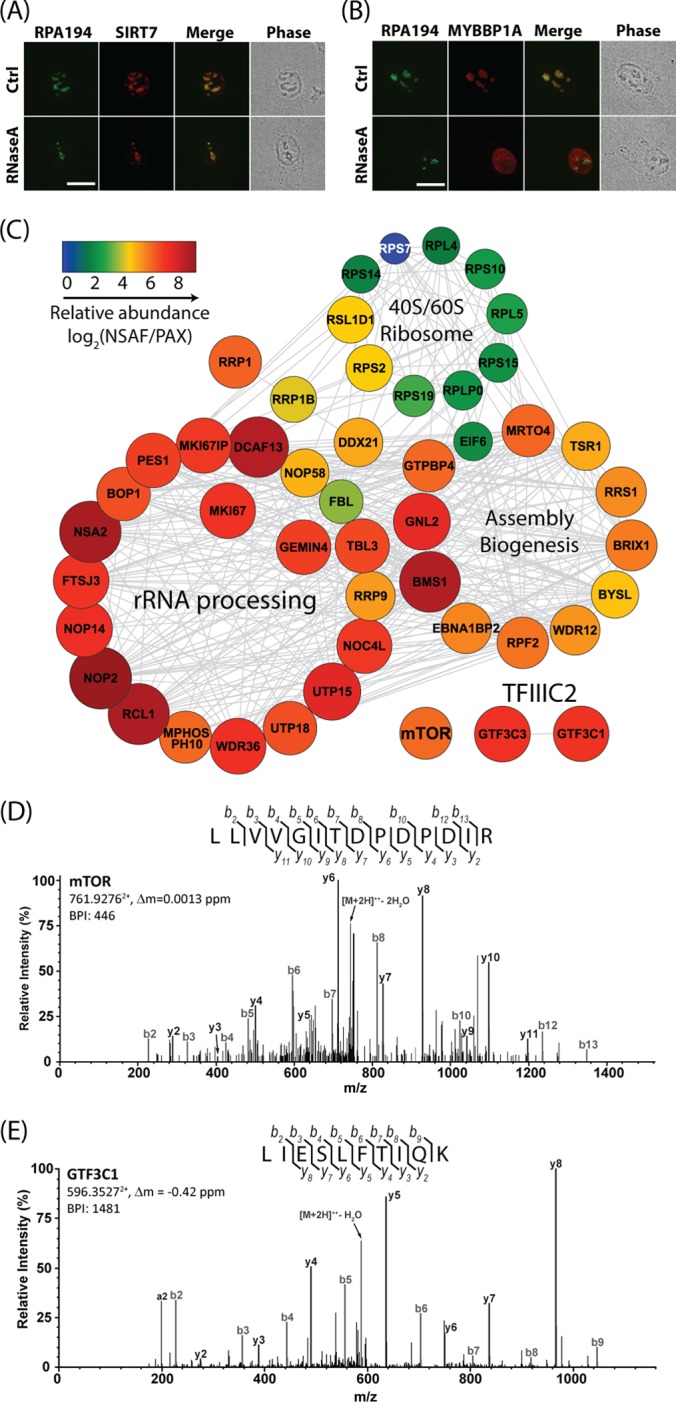
Nucleolar SIRT7 participates in multiple pathways in ribosomal biogenesis. A, B, HeLa cells treated with RNase A or buffer alone (Ctrl). Localizations of endogenous MYBBP1A, SIRT7, and RPA194 were detected via immunofluorescence microscopy. C, SIRT7 interacts with proteins involved in ribosome biogenesis. Relative abundances of SIRT7-interacting proteins specific to ribosome biogenesis are indicated by the logarithm of the ratio of NSAF/PAX values. Node color and size correlate with NSAF/PAX ratios. Protein networks were assembled by STRING and visualized by Cytoscape. D, E, representative collision-induced dissociation MS/MS spectra of doubly charged tryptic peptides from mTOR (D) and GTF3C1 (E). Assigned b and y ion sequence fragments and prominent neutral losses from the precursor are labeled. BPI, base peak intensity.
Immunoaffinity Purification of SIRT7-EGFP Protein Complexes
Isolation of SIRT7-interacting proteins via immunoaffinity purification from whole cell lysates of SIRT7-EGFP-expressing HEK293 was performed as previously described (8). Additionally, SIRT7-EGFP interactions were profiled from HEK293 isolated nuclei using cell fractionation. Briefly, for nuclei fractionation, ∼2 g of washed cell pellets from EGFP- and SIRT7-EGFP-expressing HEK293 cells were suspended in 10 mm HEPES, pH 7.4, 10 mm KCl, 1.5 mm MgCl2, 1 mm DTT, 0.5% Nonidet P-40, and protease inhibitors on wet ice for 10 min. Lysed cells were centrifuged at 1000 × g, and nuclei recovered in the pellet were washed with 2 × 10 ml ice-cold PBS. Isolation of EGFP and SIRT7-EGFP from the nuclear-enriched fraction was performed under the same conditions used for whole cell lysates; the samples were suspended in a buffer optimized for SIRT7 immunoaffinity purification (20 mm HEPES-KOH, pH 7.4, 0.1 m potassium acetate, 2 mm MgCl2, 0.1% Tween 20, 1 μm ZnCl2, 1 μm CaCl2, 0.5% Triton X-100, 250 mm NaCl, 4 μg/ml DNase, 1/100 (v/v) protease inhibitor cocktail (Sigma)), and the resulting lysate was incubated with magnetic beads (M270 Epoxy Dynabeads, Invitrogen) conjugated to in-house-developed rabbit polyclonal anti-GFP antibodies, as described (17).
Proteomic Analyses of SIRT7 Complexes
EGFP and SIRT7-EGFP immunoisolates were analyzed via SDS-PAGE and mass spectrometry (nLC-MS/MS) using a Dionex Ultimate 3000 RSLC coupled to an LTQ Orbitrap Velos (Thermo Fisher Scientific), as previously described (8). Briefly, proteins were partially resolved (∼2 cm) on 4–12% Bis-Tris NuPAGE gels and stained with SimplyBlue Coomassie stain (Invitrogen). Gel lanes were cut into 1-mm slices, pooled into six equal fractions per condition, destained, washed, and incubated with 10 μl of 12.5 ng/μl sequencing grade trypsin (Promega, Madison, WI) overnight at 37 °C. Peptides were extracted and concentrated by means of vacuum centrifugation to ∼10 μl, and half of the sample was analyzed via nLC-MS/MS. Peptides were desalted either online using a trap column (Magic C18 AQ, 3 μm, 100 μm × 2.5 cm, Michrom Bioresources, Inc., Auburn, CA) or offline using StageTips (18), as previously described (19), and were separated via reverse-phase chromatography (Acclaim PepMap RSLC, 1.8 μm, 75 μm × 25 cm) at a flow rate of 250 nl/min using a 90-min discontinuous gradient of acetonitrile as follows: 4% to 20% B over 50 min, and 20% to 40% B over 40 min (mobile phase A: 0.1% formic acid/0.1% acetic acid in water; mobile phase B: 0.1% formic acid/0.1% acetic acid in 97% acetonitrile). The mass spectrometer was operated in data-dependent acquisition mode with Fourier transform preview scan disabled and predictive automatic gain control and dynamic exclusion enabled (repeat count: 1; exclusion duration: 70 s; exclusion list size: 500). A single acquisition cycle comprised a single full-scan mass spectrum (m/z = 350–1700) in the Orbitrap (r = 30,000 at m/z = 400) followed by collision-induced dissociation fragmentation of the top 15 or 20 most intense precursor ions (minimum signal = 1E3) in the dual-pressure linear ion trap. The following instrument parameters were used: Fourier transform MS and ion trap MS/MS target values of 1E6 and 5E3, respectively; Fourier transform MS and ion trap MS/MS maximum injection time of 300 ms and 100 ms, respectively. Collision-induced dissociation fragmentation was performed at an isolation width of 2.0 m/z, normalized collision energy of 30, and activation time of 10 ms.
Data Processing and Functional Protein Analyses
MS/MS spectra from raw files corresponding to one condition (n = 6 fractions) were extracted by Proteome Discoverer (v. 1.3, Thermo Fisher Scientific) and submitted to SEQUEST (v. 1.20) for database searching against the UniProt Swiss-Prot sequence database (downloaded in November 2010) containing the subset of human, herpesvirus, and common contaminant sequences (21,570 entries). Spectra were searched against indexed peptide databases, generated from the forward and reverse protein sequence entries, using the following settings: full enzyme specificity of trypsin; maximum of two missed cleavages; parent and fragment ion mass tolerances of 10 ppm and 0.5 Da, respectively; static modification of carbamidomethylcysteine (+57.0215 Da); variable modifications of methionine oxidation (+15.9949 Da), phosphoserine, threonine, and tyrosine (+79.9663 Da). Peptide spectrum matches were loaded into Scaffold (v. 4.0.5, Proteome Software, Inc., Portland, OR) for post-search validation using the Bayesian-based LFDR algorithm and then re-searched by X!Tandem (GPM 2010.12.1.1) using the subset database parameter and additional variable modifications of deamidation of asparagine and glutamine (+0.9840 Da), pyro-Glu formation at peptide N-terminal glutamine and glutamate (−17.0265 and −18.0106 Da), and acetylation of lysine (+42.0106 Da). Peptide spectrum matches were assembled into protein groups according to rules of parsimony, with a minimum of three peptides per protein in at least one biological replicate, and then protein groups were assembled into protein clusters. Confidence filters were selected to reduce peptide and protein global false discovery rates to <1%. Proteins passing these filters were exported to Excel with their respective “weighted spectrum counts.” Spectrum count weighting of total spectral counts was performed using the number of unique spectra among protein groups versus shared peptide sequences.
A spectral-counting approach was performed to determine co-isolated proteins that were enriched in SIRT7-EGFP relative to the EGFP control. Weighted spectral counts from biological replicates were averaged, proteins with fewer than five average spectral counts in at least one condition were excluded. Proteins unique to SIRT7-EGFP or ≥3-fold and ≥2.5-fold enriched by spectral counts in SIRT7-EGFP cell lysates and nuclear isolation (relative to EGFP), respectively, were retained for further gene ontology and network analysis. For enriched co-isolated proteins identified from cellular lysates, proteins involved in ribosome biogenesis were classified through gene ontology biological process annotation (supplemental Tables S2–S4), and the gene names were submitted to STRING for network analysis (20). Gene ontology annotations and spectrum count information for proteins that were classified but not found within the STRING network are included in the supplemental material (supplemental Table S3). The relative protein abundances between co-isolated proteins were calculated using the normalized spectral abundance factor (NSAF) method (21). To account for the effect of intracellular abundance on immunoisolation protein abundance, the NSAF values were normalized by the estimated proteome abundance (PAX) (22) of the protein obtained from the PAX integrated database, then normalized to the protein with the lowest abundance (see supplemental Table S2) and expressed as log2 (NSAF/PAX). For enriched co-isolated proteins identified from nuclear immunopurifications, proteins that had RNA Polymerase III–related functional gene ontology and/or KEGG annotations (see supplemental Table S5) were retained and then analyzed by STRING as above, except only experimental interaction data were used for scoring. White nodes were allowed, reflecting proteins that were not co-isolated with SIRT7 but which facilitate connectivity and represent complex subunits. Relative protein abundance was calculated via the NSAF method as above and expressed as a percentage of the total abundance. STRING interaction networks and NSAF or NSAF/PAX values were imported into Cytoscape (version 3.0.1) for visualization.
ChIP Assay
HEK293 cells were washed with PBS containing 1 mm MgCl2 and then incubated with 1% formaldehyde at room temperature for 15 min. Cells were lysed in L1 buffer (50 mm Tris-HCl, pH 8.0, 2 mm EDTA, 0.1% IGEPAL® 630 (Sigma-Aldrich), 10% glycerol, 1 mm dithiothreitol, protease inhibitor mixture) for 15 min on ice. Nuclei were precipitated and resuspended in SDS lysis buffer (50 mm Tris-HCl, pH 8.0, 10 mm EDTA, 1% SDS). Chromatin was sonicated 10 times for 25 s each time at setting 3, with a 30-s break on ice between pulses, on a Fisher Scientific F 550 Sonic Dismembrator. Chromatin was then resuspended in ChIP buffer (250 mm NaCl, 10 mm HEPES, pH 7.4, 1% IGEPAL® 630, 10% glycerol, 1 mm DTT, 1× PIC, and 1 mm PMSF) and incubated overnight at 4 °C with primary antibody or control IgG. Magnetic protein A beads (Dynal, Carlsbad, CA) were added, and the chromatin-antibody solution was incubated for 4 h at 4 °C. Immunoprecipitates were washed twice with ChIP buffer, twice with high-salt buffer (500 mm NaCl, 0.1% SDS, 1% IGEPAL 630, 2 mm EDTA, 20 mm Tris-HCl, pH 8.0), once with LiCl buffer (0.25 m LiCl, 1% IGEPAL 630, 1% deoxycholate, 1 mm EDTA, 10 mm Tris-HCl, pH 8.0), and once with TE buffer (10 mm Tris-HCl, pH 8.0, 1 mm EDTA). Chromatin complexes were eluted with elution buffer (1% SDS, 0.1 m NaHCO3) at 60 °C for 15 min. Eluates were digested with proteinase K (10 mg/ml), and DNA was extracted with phenol-chloroform followed by ethanol precipitation. Pellets containing antibody-bound chromatin were washed in 70% ethanol and resuspended in TE buffer. Primers used for detecting the gene promoter region are listed in supplemental Table S1.
Validation of Interactions via Reciprocal Isolations
Reciprocal immunoaffinity purifications were performed using 0.1 g of cell pellet from SIRT7WT-EGFP-FLAG (wild type) expressing cells for each reaction and the lysis buffer (20 mm HEPES-KOH, pH 7.4, containing 0.1 m potassium acetate, 1 mm MgCl2, 0.1% Tween-20, 0.5% Triton X-100, 200 mm NaCl, 4 μg/ml DNase, 1/100 (v/v) Protease Inhibitor Mixture (Sigma)). Proteins were immunoisolated with 6 μg of antibody to either control IgG or identified SIRT7 protein interactions (i.e. GTF3C1 and mTOR) for 1 h, followed by 1 h of incubation with 40 μl of Protein A/G PLUS-Agarose beads (Santa Cruz Biotechnology, Santa Cruz, CA). The agarose beads were subsequently washed with 1x lysis buffer and 1x Dulbecco's phosphate buffered saline (Gibco), resuspended in 50 μl of 3x Laemmli sample buffer, and heated to 80 °C for 10 min. The co-isolated proteins were analyzed via Western blot analysis.
Microscopy
HEK293 cell lines stably expressing SIRT7-EGFP were cultured on glass-bottom dishes pretreated with poly-d-Lys (Sigma, St. Louis, MO). After 48 h, cells were fixed with 2% paraformaldehyde, washed with PBS, incubated with 1 μg/ml DAPI in PBS for 15 min, and visualized via confocal microscopy on a PerkinElmer RS3 Spinning Disk using a 60× oil immersion lens. For co-localization analysis, cells were cultured, fixed as above, permeabilized with 0.1% Triton X-100 in PBS for 15 min, and blocked in 2% (w/v) bovine serum albumin, 0.2% (v/v) Tween-20 in PBS at room temperature for 60 min. Incubation with primary antibody was performed at room temperature for 60 min in blocking buffer. The cells were then washed with 0.1% Triton X-100 in PBS and incubated with secondary antibodies conjugated to Alexa 546 or 633 (Invitrogen). Cells were incubated with 1 μg/ml TO-PRO-3 iodide (Invitrogen) in PBS for 15 min and then utilized for visualization experiments.
Polyribosome Profile Analysis
The distribution of ribosome proteins was analyzed by sucrose gradient following an established protocol (10). The cellular extracts were centrifuged on a gradient ranging from 7%–47%, and fractions were precipitated with trichloroacetic acid and washed with ice-cold acetone. The protein pellets were denatured by Laemmli sample buffer and analyzed via Western blotting.
ADP/ATP Ratio Assay
The assay was performed according to the instructions provided with the ApoSENSORTM ADP/ATP ratio assay kit (BioVision, San Francisco, CA). In brief, cells were seeded in 96-well plates and treated with siRNA for 2 days. ATP was released and converted to luminescence by luciferase. The luminescence signal indicating the level of ATP was detected by a luminometer. After the ATP was depleted, the ADP level was measured by converting ADP to ATP followed by luciferase reaction to luminescence.
Pulse-and-chase Measurements of RNA Stability
To measure the stability of newly synthesized RNA, HeLa cells were treated with control or SIRT7 siRNA for 2 days and then pulse-labeled with 0.5 mm EU for 1.5 h. The medium containing EU was removed and cells were chased with normal DMEM supplemented with 10% FBS for 0, 2, 4, 6, and 12 h. Samples from each time point were fixed with ethanol and analyzed using the Click-iT® assay with fluorescent azide Alexan 488. A flow cytometry assay was performed as described above.
RESULTS
SIRT7 Has an RNA-independent Nucleolar Localization and Interacts with Proteins Involved in Ribosome Biogenesis
Although it is established that SIRT7 localizes to nucleoli, organelles exhibiting active ribosome biogenesis, the mechanism by which this localization occurs is not well understood. Many nucleolar proteins, such as MYBBP1A, which we have previously shown to associate with SIRT7 (8), are RNA-binding proteins (15). Therefore, we asked whether the nucleolar localization of SIRT7 and its co-localization with the Pol I complex also rely on the presence of RNA. The nucleolus consists of three distinct substructures—the fibrillar center, the dense fibrillar component, and the granular component—and Pol I is known to localize to the fibrillar center (23). Consistent with previous observations (15), RNase A treatment resulted in the dispersion of MYBBP1A from nucleoli to nucleoplasm (Fig. 1B). Interestingly, the nucleolar co-localization of endogenous SIRT7 with RPA194 was not altered by RNase A treatment (Fig. 1A), indicating a tight association of SIRT7 within nucleoli partly through the Pol I complex.
To gain a broader perspective on the roles of SIRT7 in ribosome biogenesis, we performed a functional network analysis of SIRT7-interacting proteins identified using an affinity purification mass spectrometry approach (8, 24). Proteins involved in ribosome production were selected based on gene ontology annotations and related functions and were subsequently visualized with the STRING (20) and Cytoscape (25) programs in order to generate functional interaction networks (Fig. 1C and supplemental Table S2). The relative enrichment of co-isolated proteins was calculated using NSAF and PAX values, as described (8). Individual proteins forming no connections within the STRING network (see supplemental Table S3) were excluded from the depicted network, with the exception of mTOR, a known master regulator in ribosome biogenesis (6) (Fig. 1C). Within this functional network, SIRT7 associated with distinct groups of proteins, including ribosomal proteins and proteins with previously assigned roles in rRNA processing and ribosome assembly biogenesis. Interestingly, among the factors important in ribosome biogenesis, we found enriched interactions with mTOR and members of TFIIIC2, a Pol III transcription factor complex (26) (Figs. 1D and 1E). These results point to diverse functions for SIRT7 in ribosome biogenesis, in addition to its previously reported role in Pol I transcription (7).
SIRT7 Knockdown Negatively Regulates the Synthesis Rate of rRNA
After we found that SIRT7 associates with multiple proteins involved in the regulation of ribosome biogenesis, we next monitored rRNA synthesis rates. Pol I transcription accounts for the majority (∼70%) of RNA synthesis within the nucleus (9, 27), and Pol II activity can be inhibited by treatment with α-amanitin. Therefore, we approximated the rates of rRNA synthesis by measuring the nuclear signal of fluorescent RNA using pulse-labeling with the uridine analog EU, followed by conjugation of a fluorescence dye (Alexan 488) via Click-iT reaction. After pulse-labeling with EU, we found nascent RNA signals to be enriched in nucleoli (Fig. 2A) and that transcriptional activity was suppressed during mitosis (Fig. 2A, arrows), consistent with common features of rDNA transcription (16, 28).
Fig. 2.
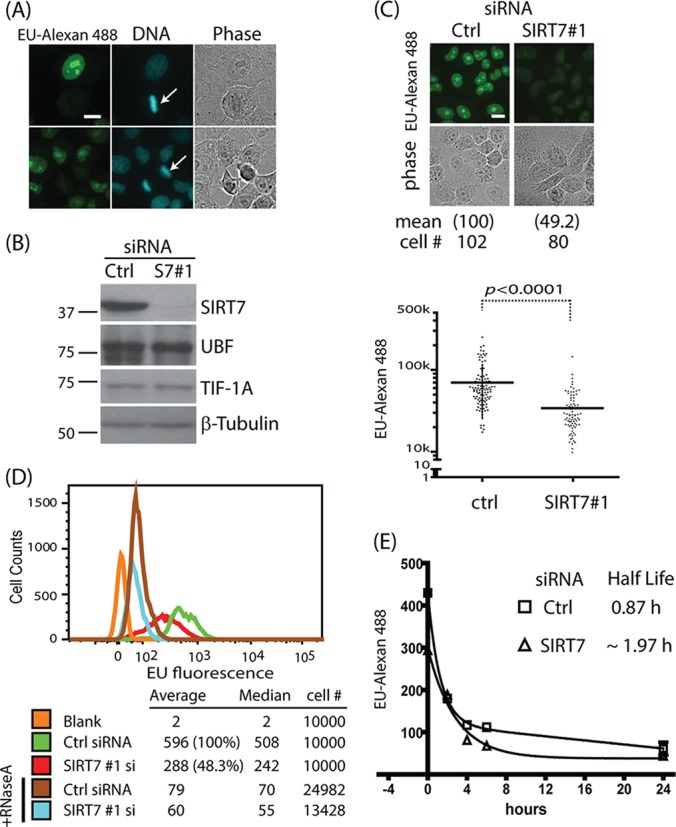
SIRT7 knockdown negatively regulates synthesis rate of rRNA. A, transcription inhibition in mitosis phase. Fluorescence microscopy shows EU incorporation (EU-Alexan 488) into RNA 1 h after pulse-labeling. Cells undergoing mitosis exhibit chromosome condensation (arrows). B, protein levels monitored via Western blotting following siRNA treatment (2 days). C, reduced synthesis rates of nascent RNA upon SIRT7 knockdown. Top: selected fluorescent images from EU-labeled HeLa cells treated with siRNA for 2 days. Relative EU levels, shown in parentheses, were calculated by normalization to the mean fluorescence value of control siRNA-treated cells. “Cell #” indicates the number of cells measured for each experiment. Bottom: normalized total cell fluorescence output from cells treated with siRNA targeting SIRT7. Mean fluorescence value (m) and standard deviations (S.D.) for each condition are as follows: ctrl, m = 69k, S.D. = 44k; SIRT7, m = 34k, S.D. = 21k. p values were calculated using Student's t test. Images were acquired using a 60× oil immersion lens; bar, 10 μm. D, EU fluorescence distribution following pulse-labeling in cells treated with siRNA (si), with or without RNaseA, as analyzed via flow cytometry. E, pulse-and-chase experiment for measuring RNA stability. HeLa cells were treated with control or SIRT7 siRNA for 2 days and then EU labeled for 1.5 h. Then the cells were chased with different time points.
To determine the effect of SIRT7 on rRNA synthesis, we performed siRNA-mediated knockdown and validated the efficiency of SIRT7 knockdown through a Western blotting (Fig. 2B). As controls, the transcription factor UBF and Pol I initiation factor TIF-IA did not show significant changes in protein levels following the SIRT7 siRNA treatment (Fig. 2B). Knockdown of SIRT7 led to suppressed EU-Alexan 488 signals (Fig. 2C, top) and a statistically significant reduction (∼50%) in mean transcriptional activity relative to treatment with non-targeting siRNA (Fig. 2C, bottom). To further account for the effect of focal plane selection on the observed EU-Alexan 488 signals, we measured the total cellular fluorescence using flow cytometry analysis for a population of n ≥ 10,000 cells for each siRNA treatment condition. As shown in Fig. 2D, cells treated with siRNA targeting SIRT7 (red) had an average EU signal that was reduced by ∼50% relative to the control siRNA (Fig. 2D, green), which is consistent with the microscopy results (Fig. 2C). As expected, the EU-Alexan 488 signal was sensitive to RNase A treatment (Fig. 2D, +RNaseA), confirming that the EU signal was indeed from RNA. Our results demonstrate that SIRT7 knockdown can suppress rRNA synthesis rates (8).
It is known that once rRNA is synthesized, it must be processed in order to generate mature rRNAs. Therefore, SIRT7 may also contribute to rRNA processing, affecting the function of the ribosome during protein synthesis. To test this possibility, we sought to monitor the processing steps by measuring rRNA stability. The decay rates of newly synthesized rRNA were measured using a pulse-and-chase experiment following EU labeling. Although the 5′ and 3′ external transcribed spacers of pre-rRNA are rapidly degraded within minutes right after transcription, the regions in the 5′ external transcribed spacer near 18S and in the internal transcribed spacer have longer half-lives (>30 min) (29). This enabled us to determine the half-life of newly synthesized rRNA in wild-type cells as ∼50 min (0.87 h) (Fig. 2E, Ctrl). We next asked whether SIRT7 knockdown affects rRNA stability. SIRT7 knockdown triggered an extension of the half-life to ∼2 h (1.97 h) (Fig. 2E). It has been reported that perturbations in rRNA processing steps can lead to the accumulation of pre-rRNA intermediates (30, 31), which could result in longer half-lives of the pre-rRNA intermediates like 5′ external transcribed spacer near 18S and internal transcribed spacer. However, we found that the steady state levels of rRNA measured by qPCR are decreased after SIRT7 knockdown (supplemental Fig. S1). These results indicate that the slight increase in rRNA half-life after siRNA knockdown could not compensate for the decreased RNA synthesis rate, which accounted for the overall reduced levels of rRNA. Therefore, cumulatively, our SIRT7 interaction studies and rRNA measurements suggest that SIRT7 plays an important role in ribosome biogenesis through the regulation of rRNA transcription.
SIRT7 Associates with the Ribosome and Regulates Protein Synthesis
As our results have shown that SIRT7 associates with a subset of ribosomal proteins from both 60S and 40S subunits (Fig. 1C) and that it has roles in rRNA synthesis and processing (Fig. 2), it is likely that SIRT7 may regulate ribosome function. To further investigate the association of SIRT7 with ribosomal proteins, we monitored the localizations of both SIRT7 and RPL11, a ribosomal protein that belongs to the 60S subunit and plays an important role in regulating cell cycle progression (11, 14). We observed co-localization of RPL11 with SIRT7 in cells transiently expressing a SIRT7-EGFP fusion protein (Fig. 3A). Furthermore, by using sucrose gradient analysis to examine the distribution of ribosomal proteins, we found that a pool of endogenous SIRT7 co-fractionates with RPL11 and RPL5 in the monoribosome region (Fig. 3B, “ctrl si,” arrow). Following SIRT7 knockdown, we observed a minor disturbance in RPL11 distribution in polyribosome regions (Fig. 3B, lanes 8–11). Because the ribosome is important to the function of the translational machinery, we also monitored the effect of SIRT7 on protein synthesis rates by measuring the incorporation of the amino acid analog HPG in cells treated with siRNA targeting SIRT7. We found that following SIRT7 knockdown, the protein synthesis activities were significantly suppressed relative to control siRNA or untreated cells (Fig. 3C).
Fig. 3.
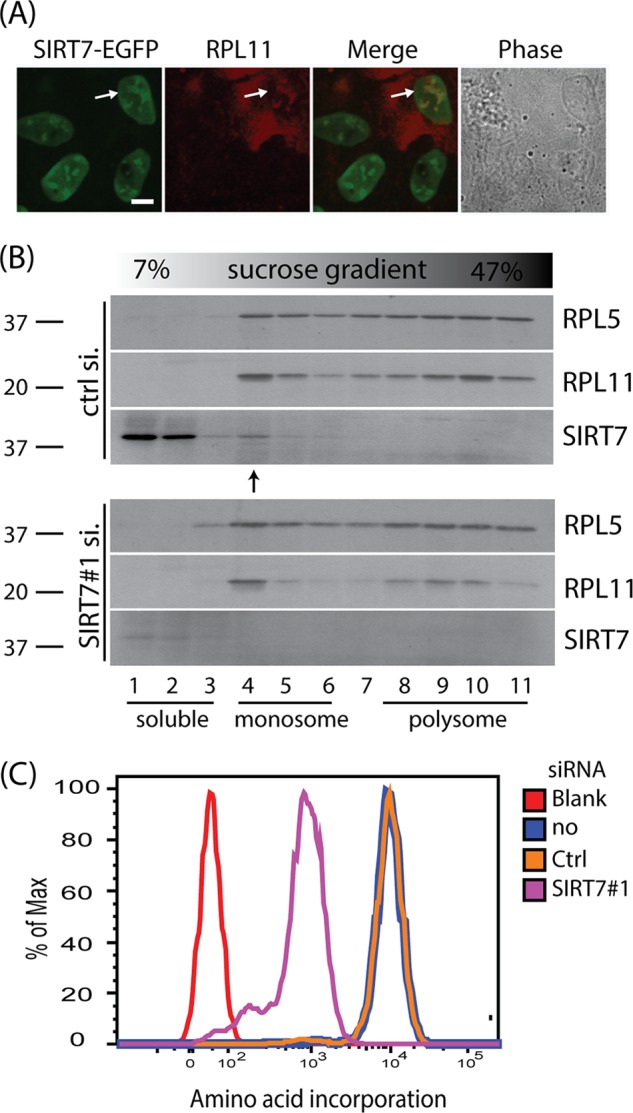
SIRT7 associates with ribosome units and regulates protein synthesis rate. A, co-localization of SIRT7-EGFP and RPL11 within nucleoli. A cell line stably expressing SIRT7-EGFP fusion protein was transfected with RPL11 cDNA and monitored via immunofluorescence microscopy with a 60× oil immersion lens; bar, 10 μm. B, co-fractionation of RPL5, RPL11, and SIRT7. Cells were treated with control and SIRT7 siRNA for 2 days. The distributions of ribosome proteins and SIRT7 were analyzed by sucrose gradient. Proteins from individual fractions were precipitated and analyzed via Western blotting. C, SIRT7 knockdown inhibits protein synthesis. Protein synthesis rates after siRNA treatment for 3 days were monitored via pulse l-homopropargylglycine labeling followed by Click-iT reaction with a fluorescent dye.
SIRT7 Knockdown Preferentially Suppresses Protein Synthesis
Given the robust effect of SIRT7 knockdown on protein synthesis, we next examined how these effects correlate with those on RNA transcription. Unlike the effect of RPA194 knockdown, which led to a similar reduction in protein and RNA synthesis rates, we found that SIRT7 knockdown had a stronger inhibitory effect on protein synthesis than on RNA transcription (∼3-fold) (Fig. 4A, p < 0.0001). This observation was consistent when using two different siRNAs against SIRT7 (S7#1 and S7#2). A less effective siRNA against SIRT7 (Fig. 4A, #3) is shown as an additional control. The knockdown efficiencies of different siRNAs used in this setting were confirmed by Western blotting (Fig. 4A, bottom). Interestingly, although SIRT7 knockdown efficiently suppressed protein synthesis, we found that the overexpression of SIRT7 by transient transfection was not sufficient to increase the protein synthesis rate (Fig. 4B, top). Similarly, unaltered protein synthesis levels were observed for the overexpression of SIRT7 wild type and SIRT7 deacetylation-impacted mutant (S111A), as well as for a control GFP overexpression (Fig. 4B, top). The overexpression levels of SIRT7 were confirmed by Western blotting (Fig. 4B, bottom). These results suggest that the overexpression of SIRT7 by itself is not sufficient to increase protein synthesis rates. SIRT7 could regulate ribosome biogenesis through multiple pathways that may not be reversible following SIRT7 knockdown. It is likely that, as suggested by our interactome studies (Fig. 1), SIRT7 carries out numerous functions by establishing interactions with other proteins and via recruitment to specialized protein complexes. Therefore, although its knockdown likely affects these interactions and the functions of these complexes, its overexpression may not necessarily provide the platform for the formation of an increased amount of these interactions/complexes.
Fig. 4.
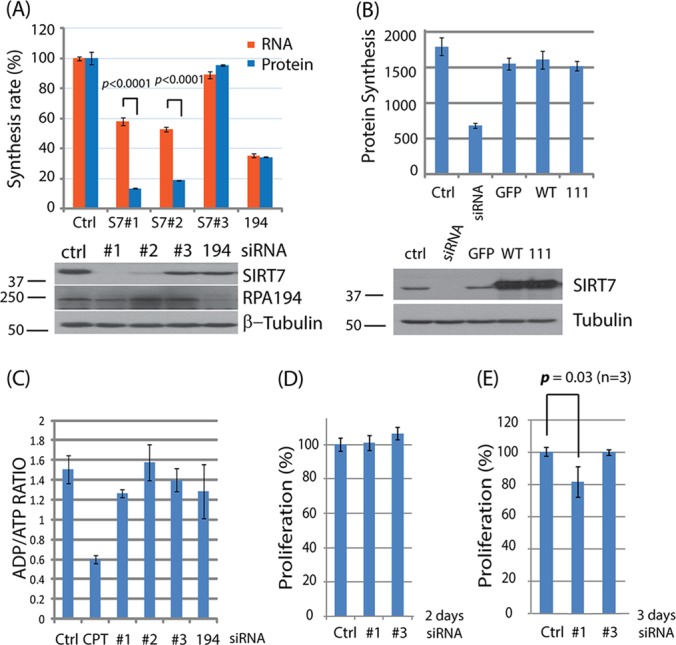
SIRT7 knockdown preferentially suppresses protein synthesis rates and inhibits proliferation. A, preferential inhibition of protein synthesis by SIRT7. Top: comparison of RNA and protein synthesis rates following siRNA treatment for 2 days. Bottom: knockdown efficiencies of individual siRNA were monitored via Western blotting. B, HeLa cells were transfected with SIRT7 siRNA and different plasmids (GFP, wild type, 111) for 2 days. The protein synthesis rates were measured using an HPG labeling method (top panel). The levels of SIRT7 were confirmed by Western blotting (bottom panel). WT: SIRT7 wild type; S111A: SIRT7 deacetylation-impacted mutant. GFP served as a control for overexpression. C, after siRNA treatment for 2 days, HeLa cells were treated with nucleotide releasing buffer for the detection of ATP levels. ADP levels were sequentially measured by adding ADP converting enzyme. The ratio of ADP to ATP in each condition was calculated. Camptothecin (CPT) was used as a control. D, E, cell proliferation rates following siRNA treatments for 2 and 3 days, respectively. p values were calculated using Student's t test.
To ensure that the inhibitory effects on protein and RNA synthesis were a direct consequence of SIRT7 knockdown and not due to altered cell fitness, we measured the ADP/ATP ratio as a general stress indicator (Fig. 4C). This ratio is correlated with a variety of cellular processes, such as cell growth, apoptosis, and cell arrest, and therefore it can inform on potential secondary effects triggered by SIRT7 knockdown. We observed a minor effect on the ADP/ATP ratio, suggesting that the effects on protein synthesis are specific to SIRT7 knockdown. Camptothecin was used as positive control for its known ability to arrest cells and induce DNA damage (Fig. 4C, CPT).
Reduced protein and RNA synthesis rates are known to have a negative effect on cell growth and proliferation. However, we did not observe a significant effect on proliferation after siRNA treatment for 2 days (Fig. 4D, #1), when both the RNA and protein synthesis rates were reduced (Fig. 4A). Therefore, it is unlikely that the reduced proliferation triggers the observed decrease in protein and RNA synthesis. Yet cells treated with siRNA against SIRT7 for 3 days exhibited reduced proliferation rates (Fig. 4E, #1). Treatment with siRNA #3, which is ineffective for SIRT7 knockdown, did not cause a reduction in either cell proliferation or protein and RNA synthesis (Figs. 4A, 4D, and 4E). Together, these results establish an effect of SIRT7 knockdown on protein and RNA synthesis rates.
SIRT7 Associates with a TFIIIC2-containing Complex and Modulates Pol III Functions
Our results from SIRT7 protein interactions and the effect of its knockdown on protein and RNA synthesis rates indicate that SIRT7 plays multiple roles in ribosome biogenesis. Among the SIRT7 interactions that were identified in our mass spectrometry studies were interactions with TFIIIC2 and mTOR (Figs. 1C–1E), proteins known to form a complex and play a crucial role in Pol III functions (32). The TFIIIC2 complex is known to be nuclear (26), and recent evidence showed that mTOR localizes within nucleoli (31). To further validate these interactions, we performed reciprocal isolations using antibodies against the endogenous proteins (Fig. 5A). Our results establish that SIRT7 specifically interacts with mTOR and members of the human TFIIIC2 complex. As SIRT7 was recently demonstrated to possess selective deacetylase activity (1), it is intriguing to determine whether the functions of these associations are connected to the enzymatic activity of SIRT7. We first tested whether increased acetylation levels could be detected on immunoaffinity-purified GTF3C1 and mTOR following SIRT7 knockdown, but we did not observe hyperacetylations (Figs. 5B and 5C). Next, we examined the overall effect of SIRT7 on the acetylation status of nucleolar and nuclear proteins. Isolated nuclei or nucleoli from wild-type cells and SIRT7 knockdown cells were resolved via SDS-PAGE, and the global acetylation status was assessed by Western blotting using an anti-acetyl lysine antibody. However, we did not observe significant changes in acetylation levels following SIRT7 knockdown (Fig. 5D). Our work may, of course, have been affected by the sensitivity of the antibody and its ability to detect low levels of acetylation. However, together, these results suggest that SIRT7 might not be involved in the deacetylation of numerous nucleolar or nuclear proteins (i.e. it is not a global deacetylase). In agreement with our observations from the interactome and protein synthesis studies, SIRT7 seems to carry out its functions through interactions with other proteins and recruitment to specialized protein complexes. This is in agreement with the current knowledge about other deacetylases that are known to carry out multiple functions though interactions with numerous proteins (33). For example, HDAC1 is part of different complexes with distinct functions (e.g. NuRD, Sin3A) and is not involved in the deacetylation of the other complex components. Overall, our results demonstrate that SIRT7 establishes specific interactions with mTOR and GTF3C1 but likely does not contribute to their acetylation status.
Fig. 5.
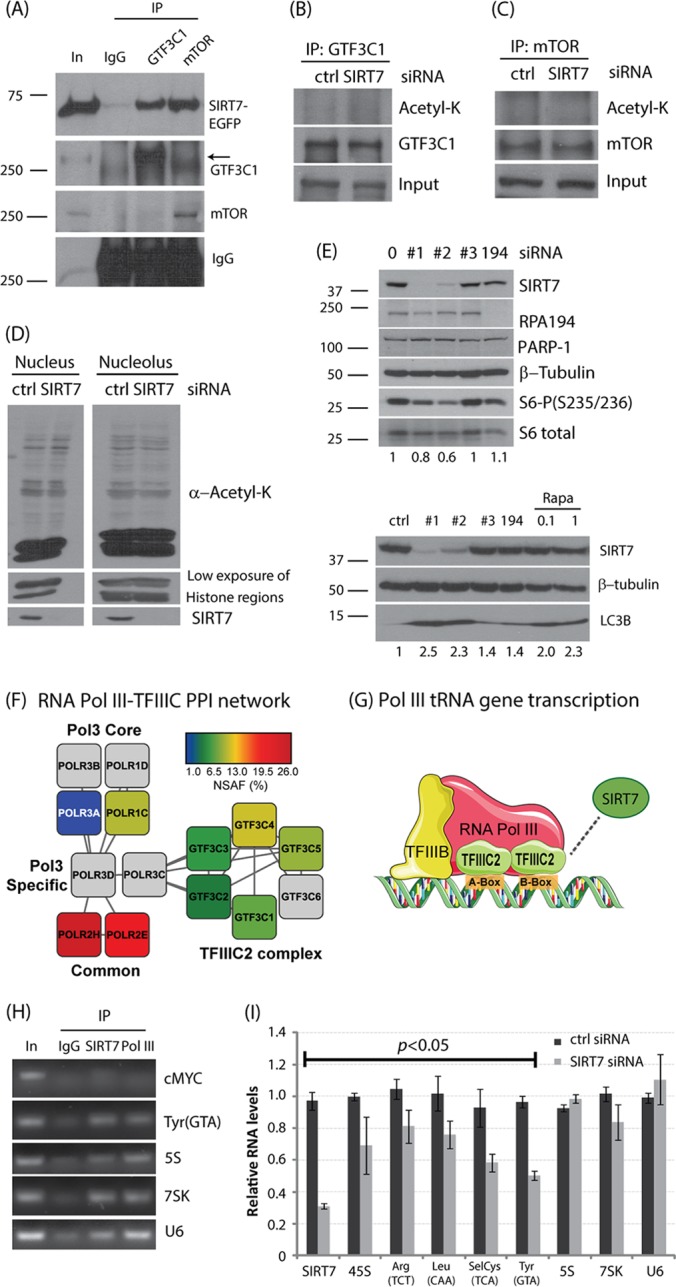
SIRT7 regulates the functions of mTOR and Pol III complexes. A, validation of SIRT7 interaction by reciprocal immunoprecipitation using antibodies against GTF3C1 and mTOR. B, C, after SIRT7 siRNA treatment for 2 days, GTF3C1 and mTOR were immunopurified and analyzed via Western blotting using anti-acetyl-Lys antibody. D, HeLa cells were treated with SIRT7 siRNA for 2 days. The nucleus and nucleolus were enriched and analyzed via Western blotting using antibody specific to acetyl-lysine (Acetyl-K). E, SIRT7 knockdown affects mTOR pathway. Phosphorylated S6 (top panel) and LC3B protein (bottom panel) abundances were monitored via Western blotting in cells treated with siRNA. Numbers represent S6-P/S6 total (top panel) and LC3B/tubulin (bottom panel) ratios. F, STRING network of protein–protein interactions between RNA Pol III subunits and TFIIIC2 complex members. Colored nodes, reflecting relative abundance (NSAF, %), represent proteins co-isolated with SIRT7-EGFP from purified nuclei. “White nodes” added by STRING were colored gray, depicting the connectivity between RNA Pol III and the TFIIIC2 complex. G, graphical representation of the RNA Pol III transcriptional machinery recruited to DNA (A- and B-boxes), which selectively promotes transcription of tRNA genes. TFIIIC2 is indicated as the putative target of SIRT7-dependent regulation of Pol II transcription. H, SIRT7 associates with Pol III–targeting genes. The promoter region association of SIRT7 was monitored via ChIP assay. I, SIRT7 knockdown reduces tRNA levels as measured by qPCR. The anticodon of each tRNA is labeled in parentheses.
Having validated the SIRT7 interaction with mTOR, we next tested whether SIRT7 knockdown affects the function of the mTOR pathway by monitoring the phosphorylation status of the downstream factor S6-P (S235/236) and the autophagy activity as indicated by LC3B-II levels. We found that SIRT7 knockdown resulted in a diminished level of S6-P but an increased signal of LC3B-II, similar to the effects of rapamycin treatment (Fig. 5E). For this SIRT7 knockdown there was no effect on cell proliferation (Fig. 4D, 2 days), suggesting that SIRT7 association with mTOR and its effect on S6 phosphorylation are not the result of reduced cell proliferation. Other siRNAs (ctrl, #3, 194) with less efficiency against SIRT7 showed no effects, indicating a SIRT7-dependent pathway (Fig. 5E). Together, these results suggest a physical and functional link between SIRT7 and mTOR.
Pol III is known to play an important role in ribosome biogenesis and the translational machinery (9). From our immunoaffinity purifications from whole cell lysates, we found that SIRT7 associates with GTF3C1 and GTF3C3 (Fig. 1C), members of the human TFIIIC2 complex, which is crucial for type I (5S rRNA) and type II (tRNA) Pol III-mediated gene transcription (Fig. 5G) (26). To further investigate the interaction with this complex, we performed cellular fractionation to purify nuclei and enrich for SIRT7 interactions. Using this approach we observed a strong enrichment for the TFIIIC2 complex, identifying five out of the known six complex members (Fig. 5F). Additionally, we observed four components of RNA Pol III, further supporting a possible role for SIRT7 in regulating Pol III functions (Fig. 5G). Given that TFIIIC2 associates with promoter regions (34), we next asked whether SIRT7 can target genetic regions transcribed by Pol III. Using chromatin immunoprecipitation, we found that both SIRT7 (S7) and Pol III associated with tRNA and 5S rRNA genetic regions (tRNA(Tyr) and 5S), but not with an upstream region of the Pol II gene (cMYC -400) (Fig. 5H). Although the role of TFIIIC2 in type III Pol III–mediated gene regulation is not clear, we also found that SIRT7 can bind to 7SK and U6 genetic regions (Fig. 5H). Following SIRT7 knockdown, we observed reduced levels of many tRNAs, suggesting that SIRT7 plays a role in regulating Pol III function (Fig. 5I). However, the effects of SIRT7 knockdown on the transcription of the 5S and U6 genes were less substantial. These effects could be due, in part, to the highly specific binding of TFIIIC2 complex to the B-box promoter element in tRNA genetic loci (26). Together, our results suggest physical and functional links between SIRT7 and Pol III complexes that in turn may contribute to the regulation of ribosome biogenesis.
DISCUSSION
Although SIRT7 has the potential to serve as a novel anticancer target (1–3), the mechanisms responsible for the antitumor effects in response to SIRT7 knockdown remain poorly understood. A key feature of cancer cells is uncontrolled proliferation that ultimately overcomes the intrinsic limit of mitotic cycles. However, tumor cells must achieve a critical cell mass before committing to another round of cell division in order to increase the tumor cell population. Ribosome synthesis is a key process necessary for fulfillment of the required cell mass. Here, we present the first experimental evidence that SIRT7 interacts with proteins involved in ribosome biogenesis, and that its levels are critical for regulating protein synthesis. Based on our accumulated evidence, we propose a model in which SIRT7 affects ribosome biogenesis and protein synthesis (Fig. 6), functions that may contribute to tumor cell proliferation.
Fig. 6.
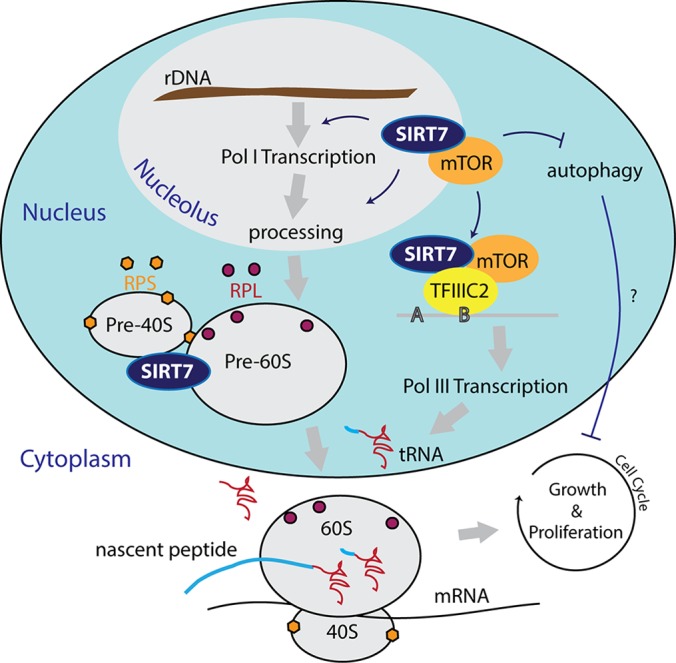
Model for potential roles of SIRT7 in ribosome biogenesis. Role of SIRT7 in Pol I, Pol III, and mTOR. SIRT7 majorly localizes within nucleoli and forms multiple complexes with ribosomes, mTOR, and TFIIIC2. Both mTOR and SIRT7 can interact with TFIIIC2 to regulate Pol III transcription. The SIRT7–mTOR complex may regulate an autophagy pathway that affects cell growth and proliferation.
We demonstrated that SIRT7 localizes in an RNA-independent manner within nucleoli, the cellular organelles responsible for rRNA synthesis and ribosome assembly (Fig. 1A). The nucleolar localization of SIRT7 is indeed connected to its functions in ribosome biogenesis, as indicated by our identification of numerous SIRT7 interacting proteins involved in this process (Fig. 1B). Functional analyses demonstrated that SIRT7 plays a role in several steps of ribosome biogenesis, including Pol I transcription and rRNA processing (Fig. 2), both of which can affect the production of the translational machinery (Fig. 6). In addition, our findings that SIRT7 co-localizes with ribosomal proteins and associates with ribosome subunits (Fig. 3) suggest a direct role in regulating the function of the translational machinery (Fig. 6). Furthermore, SIRT7 knockdown significantly suppressed protein synthesis rates (Fig. 3C). The significance of the connection between SIRT7 and ribosome complexes could go beyond the function of the translational machinery. Many ribosomal proteins are involved in signaling cell-cycle arrest in response to nucleolar stress when ribosome biogenesis is disrupted (11, 13, 14, 35). Therefore, SIRT7 may also serve as a checkpoint to hinder ribosomal proteins from triggering cell-cycle arrest. Indeed, several lines of evidence have shown that SIRT7 knockdown results in cell-cycle arrest in multiple cell types (1, 2).
In addition to Pol I, Pol III also plays an important role in ribosome biogenesis and protein synthesis (9) (Fig. 6). Functional network analysis and reciprocal immunopurifications (Fig. 5) suggested that SIRT7 regulates Pol III function through interaction with the TFIIIC2 complex (Fig. 6). This complex is essential for the recognition of B-box promoter elements and the recruitment of TFIIIB and Pol III for tRNA synthesis (Fig. 5G) (26). Our findings that SIRT7 binds to tRNA genes and that SIRT7 knockdown reduces tRNA levels also support this hypothesis (Fig. 5). The regulation of Pol III function on tRNA synthesis also provides one explanation for why SIRT7 knockdown preferentially suppresses protein synthesis over RNA synthesis when compared with Pol I knockdown (Fig. 4A). Interestingly, earlier reports showed that, in addition to its functions in tRNA synthesis, the TFIIIC2 complex is essential for 5S rRNA transcription (26). However, after SIRT7 knockdown, we did not observe reduced levels on 5S rRNA or U6 genes, which belong to different classes of Pol III–targeting genes than tRNA genes (Fig. 5I). This is likely due to the tight association between TFIIIC2 and TFIIIA, which is required for the 5S rRNA but dispensable for tRNA gene transcription (26). SIRT7 knockdown may disrupt the accessibility of TFIIIC2 for interaction with the tRNA promoter without interfering with the strong interaction between TFIIIC2 and TFIIIA. This is in agreement with our finding that SIRT7 binds specifically to TFIIIC2 (Fig. 5). It is likely that TFIIIC2 is not required for the transcription of type III Pol III–targeting genes (e.g. U6), whose promoters typically do not possess B-box elements and utilize a separate complement of transcription factors (34).
It is known that mTOR regulates all three classes of RNA polymerases to facilitate ribosome biogenesis (6) and that, similar to SIRT7, it can localize to nucleoli (31). Therefore, we propose that SIRT7 functions in ribosome biogenesis and protein synthesis are partly mediated by its association with mTOR (Fig. 6). This idea is supported by the observation that SIRT7 knockdown increases the level of LC3B-II (Fig. 5E), a specific autophagy marker that can be inhibited by mTOR activity. Although autophagy is considered a tumor suppressor mechanism (36), whether the activated autophagy pathway can play a role in suppressing tumor cell growth during SIRT7 knockdown requires further investigation (Fig. 6).
Our findings that SIRT7 has physical and functional links with both TFIIIC2-containing complexes and mTOR also present a possible mechanism by which SIRT7 regulates Pol III function and protein synthesis (Fig. 6). mTOR has been shown to associate with Pol III–targeting genes through interaction with TFIIIC2 complex (32, 37) and to activate transcription through the phosphorylation of Maf-1 repressor (32). It is possible that SIRT7 regulates Pol III function through a similar mechanism by recruiting mTOR kinase to the vicinity of tRNA genes (Fig. 6). In summary, our demonstration that SIRT7 knockdown reduces both RNA transcription and protein synthesis provides a foundation for future studies aimed at understanding the underlying mechanisms of SIRT7-dependent antitumor effects.
Supplementary Material
Acknowledgments
We are grateful to Amanda J. Guise for critical reading of the manuscript. We thank Dr. Izumi Horikawa (NCI, NIH) for the anti-SIRT7 antibodies, as well as J. Goodhouse and C. DeCoste (Microscopy and Flow Cytometry Core Facilities, Princeton University).
Footnotes
* This work was supported by National Institutes of Health grants (NIDA DP1DA026192 and NIAID R21AI102187) to I.M.C., HFSPO award RGY0079/2009-C to I.M.C., and an NJCCR 10-2409-CCR-EO postdoctoral fellowship awarded to Y.C.T.
 This article contains supplemental material.
1 The abbreviations used are:
- RNase A
- ribonuclease A
- EU
- 5′-ethynyluridine
- HEK293
- human embryonic kidney cell
- HPG
- l-homopropargylglycine
- NSAF
- normalized spectral abundance factor
- PAX
- proteome abundance estimate
- Pol I
- RNA polymerase I
- rRNA
- ribosomal RNA
- RPL
- ribosome protein, large subunit
- SIRT
- sirtuin.
REFERENCES
- 1. Barber M. F., Michishita-Kioi E., Xi Y., Tasselli L., Kioi M., Moqtaderi Z., Tennen R. I., Paredes S., Young N. L., Chen K., Struhl K., Garcia B. A., Gozani O., Li W., Chua K. F. (2012) SIRT7 links H3K18 deacetylation to maintenance of oncogenic transformation. Nature 487, 114–118 [DOI] [PMC free article] [PubMed] [Google Scholar]
- 2. Kim J. K., Noh J. H., Jung K. H., Eun J. W., Bae H. J., Kim M. G., Chang Y. G., Shen Q., Park W. S., Lee J. Y., Borlak J., Nam S. W. (2012) SIRT7 oncogenic potential in human hepatocellular carcinoma and its regulation by the tumor suppressors mir-125a-5p and mir-125b. Hepatology 57, 1055–1067 [DOI] [PubMed] [Google Scholar]
- 3. Frye R. (2002) “SIRT8” expressed in thyroid cancer is actually SIRT7. Br. J. Cancer 87, 1479. [DOI] [PMC free article] [PubMed] [Google Scholar]
- 4. Gotta M., Strahl-Bolsinger S., Renauld H., Laroche T., Kennedy B. K., Grunstein M., Gasser S. M. (1997) Localization of Sir2p: the nucleolus as a compartment for silent information regulators. EMBO J. 16, 3243–3255 [DOI] [PMC free article] [PubMed] [Google Scholar]
- 5. Michishita E., Park J. Y., Burneskis J. M., Barrett J. C., Horikawa I. (2005) Evolutionarily conserved and nonconserved cellular localizations and functions of human SIRT proteins. Mol. Biol. Cell 16, 4623–4635 [DOI] [PMC free article] [PubMed] [Google Scholar]
- 6. Mayer C., Grummt I. (2006) Ribosome biogenesis and cell growth: mTOR coordinates transcription by all three classes of nuclear RNA polymerases. Oncogene 25, 6384–6391 [DOI] [PubMed] [Google Scholar]
- 7. Ford E., Voit R., Liszt G., Magin C., Grummt I., Guarente L. (2006) Mammalian Sir2 homolog SIRT7 is an activator of RNA polymerase I transcription. Genes Dev. 20, 1075–1080 [DOI] [PMC free article] [PubMed] [Google Scholar]
- 8. Tsai Y. C., Greco T. M., Boonmee A., Miteva Y., Cristea I. M. (2012) Functional proteomics establishes the interaction of SIRT7 with chromatin remodeling complexes and expands its role in regulation of RNA polymerase I transcription. Mol. Cell. Proteomics 11, 60–76 [DOI] [PMC free article] [PubMed] [Google Scholar]
- 9. White R. J. (2005) RNA polymerases I and III, growth control and cancer. Nat. Rev. Mol. Cell Biol. 6, 69–78 [DOI] [PubMed] [Google Scholar]
- 10. Yuan X., Zhou Y., Casanova E., Chai M., Kiss E., Grone H. J., Schutz G., Grummt I. (2005) Genetic inactivation of the transcription factor TIF-IA leads to nucleolar disruption, cell cycle arrest, and p53-mediated apoptosis. Mol. Cell 19, 77–87 [DOI] [PubMed] [Google Scholar]
- 11. Fumagalli S., Di Cara A., Neb-Gulati A., Natt F., Schwemberger S., Hall J., Babcock G. F., Bernardi R., Pandolfi P. P., Thomas G. (2009) Absence of nucleolar disruption after impairment of 40S ribosome biogenesis reveals an rpL11-translation-dependent mechanism of p53 induction. Nat. Cell Biol. 11, 501–508 [DOI] [PMC free article] [PubMed] [Google Scholar]
- 12. Fumagalli S., Ivanenkov V. V., Teng T., Thomas G. (2012) Suprainduction of p53 by disruption of 40S and 60S ribosome biogenesis leads to the activation of a novel G2/M checkpoint. Genes Dev. 26, 1028–1040 [DOI] [PMC free article] [PubMed] [Google Scholar]
- 13. Zhang Y., Lu H. (2009) Signaling to p53: ribosomal proteins find their way. Cancer Cell 16, 369–377 [DOI] [PMC free article] [PubMed] [Google Scholar]
- 14. Sun X. X., Wang Y. G., Xirodimas D. P., Dai M. S. (2010) Perturbation of 60 S ribosomal biogenesis results in ribosomal protein L5- and L11-dependent p53 activation. J. Biol. Chem. 285, 25812–25821 [DOI] [PMC free article] [PubMed] [Google Scholar]
- 15. Kuroda T., Murayama A., Katagiri N., Ohta Y. M., Fujita E., Masumoto H., Ema M., Takahashi S., Kimura K., Yanagisawa J. (2011) RNA content in the nucleolus alters p53 acetylation via MYBBP1A. EMBO J. 30, 1054–1066 [DOI] [PMC free article] [PubMed] [Google Scholar]
- 16. Jao C. Y., Salic A. (2008) Exploring RNA transcription and turnover in vivo by using click chemistry. Proc. Natl. Acad. Sci. U.S.A. 105, 15779–15784 [DOI] [PMC free article] [PubMed] [Google Scholar]
- 17. Cristea I. M., Williams R., Chait B. T., Rout M. P. (2005) Fluorescent proteins as proteomic probes. Mol. Cell. Proteomics 4, 1933–1941 [DOI] [PubMed] [Google Scholar]
- 18. Rappsilber J., Mann M., Ishihama Y. (2007) Protocol for micro-purification, enrichment, pre-fractionation and storage of peptides for proteomics using StageTips. Nat. Protoc. 2, 1896–1906 [DOI] [PubMed] [Google Scholar]
- 19. Guise A. J., Greco T. M., Zhang I. Y., Yu F., Cristea I. M. (2012) Aurora B-dependent regulation of class IIa histone deacetylases by mitotic nuclear localization signal phosphorylation. Mol. Cell. Proteomics 11, 1220–1229 [DOI] [PMC free article] [PubMed] [Google Scholar]
- 20. Szklarczyk D., Franceschini A., Kuhn M., Simonovic M., Roth A., Minguez P., Doerks T., Stark M., Muller J., Bork P., Jensen L. J., von Mering C. (2011) The STRING database in 2011: functional interaction networks of proteins, globally integrated and scored. Nucleic Acids Res. 39, D561–D568 [DOI] [PMC free article] [PubMed] [Google Scholar]
- 21. Zybailov B., Mosley A. L., Sardiu M. E., Coleman M. K., Florens L., Washburn M. P. (2006) Statistical analysis of membrane proteome expression changes in Saccharomyces cerevisiae. J. Proteome Res. 5, 2339–2347 [DOI] [PubMed] [Google Scholar]
- 22. Wang M., Weiss M., Simonovic M., Haertinger G., Schrimpf S. P., Hengartner M. O., von Mering C. (2012) PaxDb, a database of protein abundance averages across all three domains of life. Mol. Cell. Proteomics 11, 492–500 [DOI] [PMC free article] [PubMed] [Google Scholar]
- 23. Shav-Tal Y., Blechman J., Darzacq X., Montagna C., Dye B. T., Patton J. G., Singer R. H., Zipori D. (2005) Dynamic sorting of nuclear components into distinct nucleolar caps during transcriptional inhibition. Mol. Biol. Cell 16, 2395–2413 [DOI] [PMC free article] [PubMed] [Google Scholar]
- 24. Miteva Y. V., Budayeva H. G., Cristea I. M. (2013) Proteomics-based methods for discovery, quantification, and validation of protein-protein interactions. Anal. Chem. 85, 749–768 [DOI] [PMC free article] [PubMed] [Google Scholar]
- 25. Smoot M. E., Ono K., Ruscheinski J., Wang P. L., Ideker T. (2011) Cytoscape 2.8: new features for data integration and network visualization. Bioinformatics 27, 431–432 [DOI] [PMC free article] [PubMed] [Google Scholar]
- 26. Lagna G., Kovelman R., Sukegawa J., Roeder R. G. (1994) Cloning and characterization of an evolutionarily divergent DNA-binding subunit of mammalian TFIIIC. Mol. Cell. Biol. 14, 3053–3064 [DOI] [PMC free article] [PubMed] [Google Scholar]
- 27. Moss T., Langlois F., Gagnon-Kugler T., Stefanovsky V. (2007) A housekeeper with power of attorney: the rRNA genes in ribosome biogenesis. Cell. Mol. Life Sci. 64, 29–49 [DOI] [PMC free article] [PubMed] [Google Scholar]
- 28. Klein J., Grummt I. (1999) Cell cycle-dependent regulation of RNA polymerase I transcription: the nucleolar transcription factor UBF is inactive in mitosis and early G1. Proc. Natl. Acad. Sci. U.S.A. 96, 6096–6101 [DOI] [PMC free article] [PubMed] [Google Scholar]
- 29. Lazdins I. B., Delannoy M., Sollner-Webb B. (1997) Analysis of nucleolar transcription and processing domains and pre-rRNA movements by in situ hybridization. Chromosoma 105, 481–495 [DOI] [PubMed] [Google Scholar]
- 30. Kufel J., Allmang C., Petfalski E., Beggs J., Tollervey D. (2003) Lsm Proteins are required for normal processing and stability of ribosomal RNAs. J. Biol. Chem. 278, 2147–2156 [DOI] [PubMed] [Google Scholar]
- 31. Iadevaia V., Zhang Z., Jan E., Proud C. G. (2012) mTOR signaling regulates the processing of pre-rRNA in human cells. Nucleic Acids Res. 40, 2527–2539 [DOI] [PMC free article] [PubMed] [Google Scholar]
- 32. Kantidakis T., Ramsbottom B. A., Birch J. L., Dowding S. N., White R. J. (2010) mTOR associates with TFIIIC, is found at tRNA and 5S rRNA genes, and targets their repressor Maf1. Proc. Natl. Acad. Sci. U.S.A. 107, 11823–11828 [DOI] [PMC free article] [PubMed] [Google Scholar]
- 33. Joshi P. G. T., Guise A. J., Luo Y., Yu F., Nesvizhskii A. I., Cristea I. M. (2013) The functional interactome landscape of the human histone deacetylase family. Mol. Syst. Biol. 9, 672. [DOI] [PMC free article] [PubMed] [Google Scholar]
- 34. Hu S., Wu J., Chen L., Shan G. (2012) Signals from noncoding RNAs: unconventional roles for conventional pol III transcripts. Int. J. Biochem. Cell Biol. 44, 1847–1851 [DOI] [PubMed] [Google Scholar]
- 35. Rubbi C. P., Milner J. (2003) Disruption of the nucleolus mediates stabilization of p53 in response to DNA damage and other stresses. EMBO J. 22, 6068–6077 [DOI] [PMC free article] [PubMed] [Google Scholar]
- 36. Gozuacik D., Kimchi A. (2004) Autophagy as a cell death and tumor suppressor mechanism. Oncogene 23, 2891–2906 [DOI] [PubMed] [Google Scholar]
- 37. Hsieh Y. J., Wang Z., Kovelman R., Roeder R. G. (1999) Cloning and characterization of two evolutionarily conserved subunits (TFIIIC102 and TFIIIC63) of human TFIIIC and their involvement in functional interactions with TFIIIB and RNA polymerase III. Mol. Cell. Biol. 19, 4944–4952 [DOI] [PMC free article] [PubMed] [Google Scholar]
Associated Data
This section collects any data citations, data availability statements, or supplementary materials included in this article.