

Abstract
Context:
Oxidative stress induced by reactive oxygen species (ROS) is involved in the development of pancreatic β-cell dysfunction.
Objective:
We determined the relationship between mononuclear cell (MNC)-derived ROS generation and p47phox protein content in response to glucose ingestion and β-cell function in women with polycystic ovary syndrome (PCOS).
Design:
This was a cross-sectional study.
Setting:
This study was conducted at an academic medical center.
Participants:
Twenty-nine normoglycemic women with PCOS (13 lean, 16 obese) and 25 ovulatory controls (16 lean, 9 obese) underwent a 3-h 75-g oral glucose tolerance test (OGTT).
Main Outcome Variables:
Pancreatic β-cell function was calculated as glucose-stimulated insulin secretion (insulin/glucose area under the curve0–30 min; GSIS) × Matsuda index-derived insulin sensitivity (ISOGTT). ROS generation was measured by chemiluminescence, and p47phox protein was quantified by Western blotting in MNC isolated from blood samples obtained at 0 and 2 hours of the OGTT.
Results:
Compared with controls, women with PCOS exhibited a higher percent change from baseline in ROS generation and p47phox protein in conjunction with greater GSIS and a tendency toward lower β-cell function. Lean women with PCOS exhibited a greater percent change from baseline in ROS generation and p47phox protein yet had similar GSIS responses compared with lean controls despite having lower ISOGTT. For the combined groups, β-cell function was inversely related to ROS generation and p47phox protein. GSIS was directly related to body mass index, central obesity, and circulating androgens.
Conclusion:
In normoglycemic women, obesity plays a role in exaggerating GSIS. However, MNC-derived oxidative stress is independent of obesity and may contribute to the decline in β-cell function in women with PCOS.
Polycystic ovary syndrome (PCOS) is the most common reproductive endocrine disorder of premenopausal women. Approximately 50% to 70% of women with PCOS exhibit insulin resistance compared with only 10% to 25% of individuals in the general population (1–3). A compensatory increase in pancreatic β-cell insulin secretion occurs in the presence of insulin resistance to maintain glucose homeostasis (4). In PCOS, this compensatory insulin hypersecretion is independent of body weight and the degree of insulin resistance (5–7). In contrast, a subset of obese women with PCOS who have a first-degree relative with type 2 diabetes mellitus (T2DM) demonstrates deficient insulin secretion suggesting a genetic predisposition for developing β-cell dysfunction that in turn, increases the risk for developing T2DM later in life (1, 8, 9). Thus, elucidating the cause of β-cell dysfunction in PCOS may contribute to therapeutic strategies for diabetes prevention in women with this disorder (10).
We and others have previously reported that in PCOS, hyperglycemia-induced oxidative stress is inversely related to insulin sensitivity (11–13). Glucose ingestion stimulates translocation of p47phox to the cell membrane of circulating mononuclear cells (MNC). This in turn activates nicotinamide adenine dinucleotide phosphate oxidase to generate superoxide, a reactive oxidative species (ROS). The ensuing oxidative stress promotes inflammation and insulin resistance (14–17) and has been implicated in the development of hyperinsulinemia and hyperandrogenism in PCOS (18, 19). However, the mechanism by which β-cell function declines in PCOS remains poorly understood. Work performed in vitro has shown that oxidative stress impairs the pancreatic release of insulin in response to glucose and leads to lipid peroxidation and DNA damage (20, 21). These studies raise the question of whether there is a relationship between in vivo pancreatic β-cell function and hyperglycemia-induced oxidative stress in PCOS. Therefore, the aim of the study was to evaluate the status of glucose-stimulated insulin secretion (GSIS) and β-cell function in women with PCOS compared with ovulatory controls of similar age and body mass index (BMI) and to examine the relationship between MNC-derived ROS generation and p47phox protein content. We anticipated that GSIS would be associated with elevated androgens based on previous studies (18, 19) and hypothesized that β-cell dysfunction would be associated with exaggerated ROS generation and p47phox protein content.
Subjects and Methods
Subjects
Twenty-nine women with PCOS (13 lean, 16 obese) and 25 ovulatory controls (16 lean, 9 obese) 18–40 years of age (Table 1) volunteered for this cross-sectional study. Some subjects in the current study were involved in our previous work on PCOS and insulin resistance (14). Additional subjects were recruited via newspaper advertisements and flyers within the Indiana University community in the years 2011 and 2012. Obesity was defined as a BMI between 30 and 40 kg/m2, whereas lean subjects had a BMI between 18 and 25 kg/m2. Women with PCOS were selected using the National Institutes of Health criteria. As such, the presence of oligomenorrhea (ie, intermenstrual intervals >35 days) and hyperandrogenemia (ie, testosterone >60 ng/dL; androstenedione >3 ng/mL; dehydroepiandrosterone sulfate [DHEA-S] >300 μg/dL) was required after excluding nonclassic congenital adrenal hyperplasia, Cushing's syndrome, hyperprolactinemia, and thyroid disease. All subjects with PCOS also exhibited polycystic ovaries on ultrasound and, thus, also met the European Society of Human Reproduction and Embryology/American Society for Reproductive Medicine and Androgen Excess and PCOS Society diagnostic criteria for PCOS. All control subjects had regular menses lasting 25 to 35 days and a luteal-range serum progesterone level consistent with ovulation (>5 ng/mL). All control subjects exhibited normal serum androgen levels and did not have any skin manifestations of androgen excess or polycystic ovaries on ultrasound. All subjects were also nonsmoking, weight stable (<2 kg weight loss in the previous 6 months), free of type 2 diabetes or cardiovascular disease, and not involved in habitual exercise for at least 6 months before entering the study. Subjects were excluded if they were taking supplements or medications known to influence glucose metabolism or immune responses. Subjects received both verbal and written information about the study before signing informed consent documents approved by our Institutional Review Board.
Table 1.
Age, Body Composition, Blood Pressure, and Circulating Androgensa
| Variable | All |
Pb | Pc | BMI 18–25 kg/m2 |
Pb | BMI 30–40 kg/m2 |
Pb | |||
|---|---|---|---|---|---|---|---|---|---|---|
| PCOS (n = 29) | Controls (n = 25) | PCOS (n = 13 ) | Controls (n = 16) | PCOS (n = 16) | Controls (n = 9) | |||||
| Age, y | 26.3 ± 0.9 | 29.4 ± 1.2 | .06 | .06 | 26.9 ± 1.3 | 28.5 ± 1.4 | .42 | 25.8 ± 1.3 | 31.2 ± 2.5 | .09 |
| Weight, kgd | 81.9 ± 3.8 | 71.6 ± 1.3 | .05 | <.01 | 62.1 ± 1.7 | 60.7 ± 1.6 | .55 | 98.1 ± 2.9 | 93.7 ± 4.2 | .40 |
| BMI, kg/m2d | 30.2 ± 1.3 | 26.3 ± 1.2 | .03 | 23.1 ± 0.6 | 22.5 ± 0.5 | .36 | 36.0 ± 0.7 | 34.1 ± 0.9 | .14 | |
| Fat-free mass, kg | 50.3 ± 1.3 | 45.6 ± 1.6 | .07 | <.01 | 43.0 ± 1.1 | 41.3 ± 1.2 | .30 | 56.1 ± 1.9 | 54.4 ± 3.2 | .65 |
| Fat mass (%) | 38.0 ± 1.4 | 35.9 ± 1.3 | .29 | .09 | 30.8 ± 1.3 | 32.8 ± 1.4 | .33 | 43.8 ± 0.9 | 42.2 ± 1.1 | .28 |
| Central fat (%)d | 38.1 ± 1.7 | 34.2 ± 1.5 | .18 | <.01 | 29.5 ± 1.9 | 30.4 ± 1.6 | .74 | 45.1 ± 0.9 | 41.8 ± 0.9 | .02 |
| Central/total fat | 48.3 ± 1.2 | 44.5 ± 0.9 | .01 | <.01 | 45.0 ± 2.2 | 42.9 ± 1.1 | .42 | 51.0 ± 1.0 | 47.4 ± 1.3 | .04 |
| WC, cm | 88.6 ± 3.1 | 87.8 ± 4.2 | .89 | .80 | 76.9 ± 2.1 | 73.8 ± 3.3 | .45 | 98.7 ± 3.8 | 101.8 ± 3.1 | .54 |
| WHR | 0.82 ± 0.02 | 0.84 ± 0.02 | .53 | .55 | 0.83 ± 0.02 | 0.78 ± 0.02 | .08 | 0.84 ± 0.04 | 86.0 ± 0.03 | .72 |
| SBP, mm Hg | 115.7 ± 2.7 | 111.0 ± 2.4 | .22 | .17 | 109.0 ± 2.1 | 107.4 ± 2.0 | .59 | 121.1 ± 4.3 | 118.2 ± 5.4 | .69 |
| DBP, mm Hg | 71.4 ± 2.3 | 65.0 ± 2.1 | .05 | .03 | 68.7 ± 2.6 | 60.7 ± 1.8 | .01 | 73.6 ± 3.6 | 73.8 ± 3.9 | .95 |
| LH, IU/mLd | 10.8 ± 0.8 | 3.6 ± 0.3 | <.01 | <.01 | 13.1 ± 1.08 | 4.2 ± 0.5 | <.01 | 9.0 ± 1.0 | 2.6 ± 4.2 | <.01 |
| Testosterone, ng/dL | 76.2 ± 4.5 | 39.0 ± 2.7 | <.01 | <.01 | 73.1 ± 6.5 | 43.3 ± 2.8 | <.01 | 78.8 ± 6.4 | 30.6 ± 4.8 | <.01 |
| DHEA-S, μg/dLd | 328.1 ± 28.8 | 172.9 ± 16.7 | <.01 | <.01 | 329.4 ± 39.3 | 180.0 ± 20.1 | <.01 | 327.0 ± 42.5 | 158.8 ± 31.3 | <.01 |
| Androstenedione, ng/mLd | 3.4 ± 0.1 | 1.5 ± 0.1 | <.01 | <.01 | 3.3 ± 0.2 | 1.4 ± 0.1 | <.01 | 3.5 ± 0.2 | 1.8 ± 0.1 | <.01 |
Abbreviations: DBP, diastolic BP; SBP, systolic BP; WC, waist circumference; WHR, waist to hip ratio.
Data are mean ± SEM. Statistically significant group differences were accepted as P < .05.
Independent-sample two-tailed t tests.
Logistic regression analyses adjusted for BMI if BMI differed between the groups.
Log-transformed for statistical analysis.
Oral glucose tolerance test
All subjects were provided standard meals consisting of ∼50% carbohydrate, 35% fat, and 15% protein for three consecutive days before undergoing an oral glucose tolerance test (OGTT). The OGTT was performed in the Clinical Research Center between days 5 tand 8 after the onset of menstruation and after a 10- to 12-hour overnight fast. Blood samples were collected from an antecubital vein while fasting and 30, 60, 90, 120, and 180 minutes after ingestion of a standard 75-g glucose load. Glucose and insulin area under the curve (AUC) was calculated by the trapezoidal method. Insulin sensitivity derived from the OGTT (ISOGTT), was estimated using the Matsuda index (10 000 divided by the square root of [fasting glucose × fasting insulin] × [mean glucose × mean insulin]) (22). GSIS was calculated by dividing plasma insulin by glucose AUC during the first 30 minutes of the OGTT, which has been correlated well with the iv glucose insulin response (23). However, the amount of insulin needed to maintain normoglycemia is influenced by the prevailing level of insulin sensitivity. As such, the product of GSIS and ISOGTT (ie, disposition index) was calculated to characterize pancreatic β-cell function (4, 24).
Body composition
Height was measured without shoes using a wall-mounted stadiometer to the nearest 1.0 cm, and body weight was recorded on a digital platform scale with subjects wearing a hospital gown to the nearest 0.1 kg. All subjects underwent dual-energy x-ray absorptiometry to determine total body fat percentage, central body fat, and fat-free mass using the QDR 4500 Elite model scanner (Hologic Inc). Central body fat was defined by demarcating regions of interest between the inferior costal margin and the iliac crests and was calculated as the amount of fat relative to the total mass of that area (25).
ROS generation assay
MNC were isolated from blood samples using polymorphonuclear cell isolation medium (Polymorphprep; Accurate Chemical and Scientific Corporation) from blood samples obtained during the OGTT at 0 and 120 minutes. The cells were washed twice with Hank's buffered saline solution, and reconstituted in Hank's buffered saline solution to a concentration of 4 × 10⁵ cells/mL. Respiratory burst activity of MNC was measured by detection of superoxide radical by chemiluminescence as previously described (26). Duplicate cuvettes containing 500 μL of MNC (400 cells/μL) were placed into a 2-channel lumi-aggregometer (Chronolog Corporation). Fifteen microliters of 10mM luminol followed by 1 μL of 10 mM formylmethionyl leucine phenylalanine were added to each cuvette. Chemilumunescence was recorded in mV by computer software (Chronolog Aggrolink).
p47phox Western blotting
The protein content of p47phox and actin in MNC was quantified as previously described using a monoclonal antibody against the p47phox subunit (Transduction Laboratories Inc) at a dilution of 1:500 or actin (Santa Cruz Biotechnology) at a dilution of 1:1000 (27). Densitometry was performed on scanned films using Caresteam Molecular imaging software version 5.02.30, and all values for p47phox were corrected for loading using those obtained for actin.
Plasma and serum measurements
Plasma glucose was determined immediately during the OGTT using a glucose oxidase assay (YSI 2300 STAT Plus). All remaining blood samples were centrifuged at 1000 rpm for 10 minutes at 4°C and stored at −80°C until analysis. Plasma insulin was measured by RIA (Millipore). Serum LH, testosterone, androstenedione, and DHEA-S concentrations were measured by RIA (Siemens Healthcare Diagnostics). All samples from each subject were measured in duplicate in the same assay to minimize variance.
Statistical analysis
Data were analyzed using the statistical program R (Leopard build 64-bit; The R Foundation). All values were initially examined for departure from normality, and the natural logarithm transformation was applied to nonnormally distributed data. Independent-sample two-tailed t tests were performed to compare group means between all PCOS and controls as well as each respective subgroup (ie, PCOS lean or obese vs control lean or obese). In the event BMI differed between PCOS and controls, logistic regression was used with BMI as a covariate. The percent change from baseline in MNC-derived oxidative stress markers in response to glucose ingestion was determined for each subject to account for intersubject variability. Pearson's product-moment correlation was used to examine the associations between ROS generation and p47phox content with insulin secretion and circulating androgen levels. Calculation for the difference between 2 independent correlation coefficients was assessed using the Fisher r-to-z transformation method (www.vassarstats.net/rdiff.html). Data are reported as mean ± SEM, and significance was accepted as P < .05.
Results
Subject characteristics
Women with PCOS were similar in age but exhibited significantly greater body weight, BMI, and central fat compared with control subjects (P < .05; Table 1). Subjects were grouped by body mass by design, such that body composition was similar when comparing lean controls with lean women with PCOS or obese controls with obese women with PCOS (Table 1). Women with PCOS had higher systolic and diastolic blood pressure compared with controls (P < .05). When subjects were grouped by body mass, lean women with PCOS had higher diastolic blood pressure compared with lean controls (P < .05). In either instance, mean blood pressure values were in the normotensive range. As expected, serum levels of LH, testosterone, androstenedione, and DHEA-S were significantly higher (P < .05) in women with PCOS compared with control subjects regardless of body weight.
Glucose regulation
Glucose levels at 0 and 120 minutes as well as glucose AUC of the OGTT were similar across groups regardless of body weight (Table 2). Compared with controls, women with PCOS had higher fasting and 120-minute insulin levels that were independent of body mass. Overall, women with PCOS exhibited greater GSIS compared with controls after adjusting for BMI (P < .01; Figure 1, A–C). GSIS was similar in lean women with PCOS compared with lean controls and was modestly higher in obese women with PCOS compared with obese controls with a trend toward significance (P = .11). GSIS was significantly (P < .001) greater in obese controls compared with lean controls (0.61 ± 0.13 vs 0.33 ± 0.05; P < .03). Overall, women with PCOS exhibited lower ISOGTT (P < .01; Figure 1, D–F) and a trend toward lower β-cell function (P = .08; Figure 2) compared with control subjects. When subjects were grouped by body mass, ISOGTT was significantly (P < .05) lower in lean women with PCOS compared with lean controls and modestly (P = .9) lower in obese women with PCOS compared with obese controls. However, β-cell function was not statistically different within and across weight-matched groups.
Table 2.
Glucose Metabolism and Oxidative Stress Markers During the OGTTa
| Variable | All |
Pb | Pc | BMI 18–25 kg/m2 |
Pb | BMI 30–40 kg/m2 |
Pb | |||
|---|---|---|---|---|---|---|---|---|---|---|
| PCOS (n = 29) | Controls (n = 25) | PCOS (n = 13 ) | Controls (n = 16) | PCOS (n = 16) | Controls (n = 9) | |||||
| FPG, mg/dLd | 87.3 ± 1.0 | 85.8 ± 1.5 | .41 | .41 | 86.5 ± 1.8 | 86.2 ± 1.1 | .87 | 87.9 ± 1.1 | 85.1 ± 4.1 | .53 |
| FPI, μU/mLd | 15.3 ± 1.4 | 8.3 ± 1.1 | <.01 | <.01 | 9.9 ± 1.1 | 5.6 ± 0.7 | <.01 | 19.8 ± 1.8 | 13.9 ± 2.1 | .05 |
| 2-h PG, mg/dL | 113.2 ± 4.7 | 112.2 ± 3.2 | .93 | .86 | 110.1 ± 6.2 | 110.1 ± 6.2 | .98 | 115.7 ± 0.7 | 116.7 ± 2.8 | .90 |
| 2-h PI, μU/mLd | 92.2 ± 13.6 | 39.4 ± 6.7 | <.01 | <.01 | 54.0 ± 7.8 | 28.2 ± 4.0 | <.01 | 123.3 ± 21.1 | 61.8 ± 16.4 | .03 |
| PGAUC, mg/dL −3 h × 10−3 | 16.3 ± 1.9 | 7.4 ± 1.0 | <.01 | <.01 | 10.4 ± 0.1 | 5.5 ± 0.6 | .01 | 21.2 ± 0.8 | 11.3 ± 0.2 | .02 |
| PIAUC, μU/mL −3 h × 10−3d | 16.3 ± 1.9 | 7.4 ± 1.0 | <.01 | <.01 | 10.4 ± 0.1 | 5.5 ± 0.6 | .01 | 21.2 ± 0.8 | 11.3 ± 0.2 | .02 |
| ROS generation, % | 110.2 ± 21.8 | 40.3 ± 16.1 | .01 | <.02 | 141.6 ± 30.5 | 8.2 ± 12.6 | <.01 | 84.7 ± 30.2 | 104.6 ± 31.7 | .66 |
| p47phox protein content, % | 30.0 ± 6.5 | 1.5 ± 5.6 | <.01 | <.01 | 26.3 ± 7.8 | 7.5 ± 4.0 | <.01 | 33.0 ± 10.0 | 19.8 ± 13.0 | .43 |
Abbreviations: FPG, fasting plasma glucose; FPI, fasting plasma insulin; PG, plasma glucose; PI, plasma insulin.
Data are mean ± SEM. Statistically significant group differences were accepted as P < .05.
Independent-sample two-tailed t tests.
Logistic regression analyses adjusted for BMI if BMI differed between the groups.
Log-transformed for statistical analysis.
Figure 1.
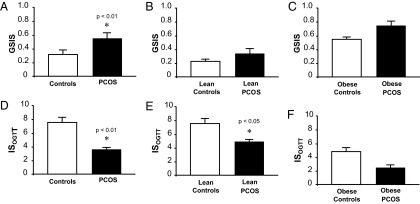
Effects of obesity and PCOS on GSIS and ISOGTT in the combined (A and D), lean (B and E), and obese (C and F) groups, respectively. GSIS was calculated as AUC for insulin divided by glucose during the first 30 minutes of the OGTT. GSIS was log-transformed for statistical analysis. Data for combined group analysis was adjusted for BMI. ISOGTT = Matsuda index as a measure of insulin sensitivity. Data are mean ± SEM. *, P < .05 compared with controls.
Figure 2.

Effects of obesity and PCOS on β-cell function in the combined (A), lean (B), and obese (C) groups, respectively. β-Cell function was calculated as GSIS × ISOGTT. Data are mean ± SEM. Data for combined group analysis was adjusted for BMI, and in the combined group, PCOS tended to have lower β-cell function than controls (P = .08).
Oxidative stress markers
Women with PCOS exhibited a greater percent change from baseline in ROS generation and p47phox protein content compared with control subjects (P < .05; Table 2). When subjects were grouped by body mass, the percent change from baseline in ROS generation and p47phox protein content was greater in lean women with PCOS compared with lean controls (P < .01; Table 2) but similar in obese women with PCOS compared with obese controls.
Correlations
Table 3 depicts the relationships between ROS generation, p47phox protein content, GSIS, and β-cell function. For the combined groups, β-cell function was negatively correlated with the percent change from baseline in ROS generation (r = −0.36, P < .01; Figure 3A) and p47phox protein content (r = −0.35, P < .01; Figure 3B). Moreover, GSIS was positively correlated with body fat and androstenedione and negatively correlated with ISOGTT. There were no statistical differences in the correlation coefficients (ie, r values) for GSIS or β-cell function between women with PCOS and controls for the combined groups or when subjects were grouped by body mass.
Table 3.
Relationships Between Insulin, Body Composition, and Circulating Androgensa
|
r Values |
||||||||||||
|---|---|---|---|---|---|---|---|---|---|---|---|---|
| ROS Generation |
p47phox Protein Content |
ISOGTT |
GSIS |
|||||||||
| All | Controls | PCOS | All | Controls | PCOS | All | Controls | PCOS | All | Controls | PCOS | |
| Insulin secretion | ||||||||||||
| Fasting insulin | 0.23 | 0.34 | −0.10 | 0.41c | 0.10 | 0.37b | −0.89d | −0.65d | −0.88d | 0.66d | 0.71d | 0.52c |
| 2-h insulin OGTT | 0.08 | 0.14 | −0.19 | 0.31b | 0.17 | 0.07 | −0.71d | −0.86d | −0.66d | 0.63d | 0.63d | 0.53c |
| AUC | 0.06 | 0.06 | −0.27 | 0.34c | 0.14 | 0.15 | −0.87d | −0.87d | −0.86d | 0.86d | 0.87d | 0.86d |
| GSIS | −0.13 | −0.12 | −0.34 | 0.12 | 0.08 | −0.07 | −0.74d | −0.84d | −0.68d | |||
| β-Cell function | −0.36c | −0.56c | −0.19 | −0.35c | 0.02 | −0.46c | 0.14 | −0.07 | 0.08 | 0.46d | 0.55c | 0.61d |
| Body composition | ||||||||||||
| BMI | 0.16 | 0.51c,e | −0.13 | 0.34c | 0.51c | 0.10 | −0.61d | −0.59c | −0.64d | 0.51d | 0.43b | 0.46c |
| Body fat, % | 0.07 | 0.44b,e | −0.15 | 0.14 | 0.30 | −0.03 | −0.40c | −0.39b | −0.49d | 0.39c | 0.33 | 0.39b |
| Central fat, % | 0.06 | 0.33 | −0.14 | 0.21 | 0.34 | 0.05 | −0.46d | −0.42b | −0.55d | 0.44d | 0.39b | 0.42b |
| Androgens | ||||||||||||
| LH | 0.17 | −0.36 | 0.03 | 0.27b | −0.04 | −0.08 | −0.27b | 0.50c | 0.22 | 0.07 | −0.34 | −0.27 |
| DHEA-S | 0.07 | −0.36 | −0.13 | 0.19 | 0.01 | −0.07 | −0.19 | 0.25 | 0.18 | 0.08 | −0.14 | −0.10 |
| Testosterone | 0.20 | −0.24 | 0.04 | 0.19 | −0.24 | −0.08 | −0.35c | 0.31 | 0.01 | 0.24 | −0.31 | 0.15 |
| Androstenedione | 0.23 | 0.32 | 0.04 | 0.32c | 0.25 | −0.08 | −0.61d | −0.30 | −0.09 | 0.43d | 0.30 | 0.31 |
Pearson's correlation was used to compare insulin secretion, body composition, and androgens with ROS generation. Fasting insulin, 120-minute insulin during OGTT, GSIS, central fat, LH, DHEA-S, and androstenedione were log-transformed for statistical analysis.
Statistically significant correlations: b P < .05; c P < .01; d P < .001.
Fisher r-to-z transformation was used to determine statistical differences between correlation coefficients (r): P < .05.
Figure 3.

Correlation between the change in MNC-derived ROS generation (A) and p47phox protein content (B) and β-cell function in the combined groups.
Discussion
Our data clearly show for the first time that MNC-derived oxidative stress in response to glucose ingestion is inversely related to an in vivo measure of β-cell function in women with or without PCOS. GSIS is exaggerated in obese individuals regardless of PCOS status. In contrast, ROS generation and p47phox protein content from MNC is elevated in women with PCOS independent of obesity. In addition, circulating androgens are directly related to GSIS and p47phox protein content from MNC. These associations provide evidence that MNC-derived oxidative stress may play a role in the development of hyperandrogenism and the attenuation of β-cell function in women with PCOS.
The compensatory hyperinsulinemia of insulin resistance may not promote hyperandrogenism in lean women with PCOS. GSIS is increased only in the obese groups and is directly related to circulating androgens in obese individuals and when all of the groups are combined. The concept that hyperinsulinemia promotes hyperandrogenism in PCOS was born from the observation that insulin is positively correlated with androgens in a study of obese women with PCOS (18). This observation was later perpetuated by reports of increased androgen production by insulin-exposed cultures of theca cells obtained from obese women with PCOS (19) and increases in circulating androgens in women with PCOS after insulin infusion in vivo (28). However, these responses could be elicited only by using supraphysiological insulin concentrations (19, 28). As such, it is theorized that insulin under physiological circumstances serves as a co-gonadotropin to increase LH-induced androgen synthesis (13, 29). In contrast, a direct relationship between p47phox protein content and circulating androgens is observed in the combined groups. These latter findings are consistent with our previous reports demonstrating a link between circulating androgen elevations and MNC-derived oxidative stress and inflammation in lean women with PCOS (12, 30, 31). Furthermore, cytochrome P450 17α, the steroidogenic enzyme responsible for androgen production is up-regulated in theca cells by pro-oxidant stimuli and inhibited by antioxidants such as resveratrol (32). Theca cell proliferation in rat and human polycystic ovaries is also stimulated by TNFα and suppressed by statins (33, 34). Thus, excess ovarian androgen production may be the result of hyperinsulinemia acting in concert with a local inflammatory response to glucose-stimulated oxidative stress from MNC recruited into the polycystic ovary. Nevertheless, our data suggest that increased GSIS in PCOS is predominantly an obesity-related phenomenon.
Suppression of postprandial ROS generation and p47phox in lean controls likely represents a protective effect to coordinate GSIS with glucose disposal in these young normoglycemic women. In contrast, the increases in ROS generation and p47phox in response to glucose ingestion in lean women with PCOS compared with lean controls is consistent with our previous work (31) and that of others in individuals with T2DM (35). This is important because it illustrates that in PCOS, feeding alone in the absence of obesity is capable of stimulating oxidative stress, which is a phenomenon known to trigger proinflammatory responses capable of impairing insulin action (36). Because increased β-cell mass is typically associated with obesity, the rise in GSIS in obese controls compared with lean controls may reflect the continuum in which β-cell mass and physiology become abnormal (ie, compensation, dysfunction, and failure) (37). Lean women with PCOS would also be expected to have compensated β-cell function given that they exhibit an equivalent degree of insulin resistance to obese controls. In contrast to previous reports (5–7), GSIS is similar in the lean women with PCOS in our study cohort compared with lean controls consistent with a failure to exhibit a significant compensatory increase in GSIS. Although the exact mechanism responsible for this impaired GSIS is unclear, this observation suggests that β-cell decompensation can occur in PCOS before the development of obesity and highlights ROS generation from MNC as a potential trigger for the blunted insulin release (35–37).
Although our correlative data do not prove causation, they support the concept that MNC-derived ROS generation plays an important role in the development of pancreatic β-cell dysfunction. Moreover, our findings are consistent with previous work demonstrating that macrophages derived from circulating MNC infiltrate pancreatic islets of humans with T2DM (38). Consequently, aggravation of MNC-derived macrophages in response to glucose may potentiate oxidative stress to generate inflammatory responses that impair β-cell function. Indeed, we have previously demonstrated increased activation of the proinflammatory transcription factor, nuclear factor-κB from MNC of lean women with PCOS in response to glucose ingestion (12). The inflammatory load in excess adipose tissue may account for the greater insulin resistance and higher BP in obese women with PCOS. Moreover, MNC-derived macrophages present in excess adipose tissue are known to be a major source of TNFα and are capable of inducing further TNFα production in adipocytes. Excess abdominal adiposity in particular has been linked with insulin resistance (1, 7), with secondary effects on β-cell function. This is corroborated by the observation in our study that central body fat is inversely related to insulin sensitivity and directly related to GSIS. Excess abdominal adiposity is also linked to the release of plasma mediators of inflammation (eg, TNFα and IL-6) known to promote β-cell dysfunction. Reductions in oxidative stress and inflammation by antioxidant therapies provide further support for the hypothesis that glucose-stimulated ROS generation is a causal factor in β-cell dysfunction (35, 36, 37, 39, 40).
In conclusion, glucose-stimulated MNC-derived oxidative stress is inversely related to β-cell function in young normoglycemic women with or without PCOS. Obese women with PCOS exhibit increased GSIS in the face of MNC-derived oxidative stress and insulin resistance indicative of β-cell compensation to preserve insulin-stimulated glucose uptake in peripheral tissues. However, lean women with PCOS exhibit impaired GSIS in the face of MNC-derived oxidative stress and insulin resistance to suggest that β-cell decompensation can occur in PCOS before the development of obesity. Further work is merited to elucidate the mechanism by which MNC-derived oxidative stress interacts with the pancreas and skeletal muscle to regulate insulin action. Collectively, these data implicate MNC-derived oxidative stress as a contributor to β-cell dysfunction and the well-known risk of developing glucose intolerance related to PCOS per se (2).
Acknowledgments
This work was supported by National Institutes of Health Grants HD048535 (to F.G.), RO1 AG-12834 (to J.P.K.), and NIH T32 DK007319 (to S.K.M.).
This paper was presented at the 95th Annual Meeting of The Endocrine Society, San Francisco, California, June 15–18, 2013.
S.K.M conceptualized the study, and J.P.K and F.G contributed to the study design. C.L.S and F.G. performed the laboratory measurements. S.K.M and F.G. wrote the manuscript. All authors assisted with study organization, data analysis, and manuscript editing.
Disclosure Summary: The authors report no conflict of interest.
Footnotes
- AUC
- area under the curve
- BMI
- body mass index
- DHEA-S
- dehydroepiandrosterone sulfate
- GSIS
- glucose-stimulated insulin secretion
- ISOGTT
- insulin sensitivity derived from the OGTT
- MNC
- mononuclear cells
- OGTT
- oral glucose tolerance test
- PCOS
- polycystic ovary syndrome
- ROS
- reactive oxidative species
- T2DM
- type 2 diabetes mellitus.
References
- 1. Ovalle F, Azziz R. Insulin resistance, polycystic ovary syndrome, and type 2 diabetes mellitus. Fertil Steril. 2002;77(6):1095–1105 [DOI] [PubMed] [Google Scholar]
- 2. Ciampelli M, Leoni F, Cucinelli F, et al. Assessment of insulin sensitivity from measurements in the fasting state and during an oral glucose tolerance test in polycystic ovary syndrome and menopausal patients. J Clin Endocrinol Metab. 2005;90(3):1398–1406 [DOI] [PubMed] [Google Scholar]
- 3. DeUgarte CM, Bartolucci AA, Azziz R. Prevalence of insulin resistance in the polycystic ovary syndrome using the homeostasis model assessment. Fertil Steril. 2005;83(5):1454–1460 [DOI] [PubMed] [Google Scholar]
- 4. Kahn SE, Prigeon RL, McCulloch DK, et al. Quantification of the relationship between insulin sensitivity and β-cell function in human subjects: evidence for a hyperbolic function. Diabetes. 1993;42(11):1663–1672 [DOI] [PubMed] [Google Scholar]
- 5. Holte J, Bergh T, Berne C, Berglund L, Lithell H. Enhanced early insulin response to glucose in relation to insulin resistance in women with polycystic ovary syndrome and normal glucose tolerance. J Clin Endocrinol Metab. 1994;78(5):1052–1058 [DOI] [PubMed] [Google Scholar]
- 6. Ciampelli M, Fulghesu AM, Cucinelli F, et al. Heterogeneity in β-cell activity, hepatic insulin clearance and peripheral insulin sensitivity in women with polycystic ovary syndrome. Hum Reprod. 1997;12(9):1897–1901 [DOI] [PubMed] [Google Scholar]
- 7. Ciampelli M, Fulghesu AM, Cucinelli F, et al. Impact of insulin and body mass index on metabolic and endocrine variables in polycystic ovary syndrome. Metabolism. 1999;48(2):167–172 [DOI] [PubMed] [Google Scholar]
- 8. Dunaif A, Finegood DT. β-Cell dysfunction independent of obesity and glucose intolerance in the polycystic ovary syndrome. J Clin Endocrinol Metab. 1996;81(3):942–947 [DOI] [PubMed] [Google Scholar]
- 9. Ehrmann DA, Sturis J, Byrne MM, Karrison T, Rosenfield RL, Polonsky KS. Insulin secretory defects in polycystic ovary syndrome: relationship to insulin sensitivity and family history of non-insulin-dependent diabetes mellitus. J Clin Invest. 1995;96(1):520–527 [DOI] [PMC free article] [PubMed] [Google Scholar]
- 10. DeFronzo RA, Abdul-Ghani MA. Preservation of ß-cell function: the key to diabetes prevention. J Clin Endocrinol Metab. 2011;96(8):2354–2366 [DOI] [PubMed] [Google Scholar]
- 11. González F, Nair KS, Daniels JK, Basal E, Schimke JM, Blair HE. Hyperandrogenism sensitizes leukocytes to hyperglycemia to promote oxidative stress in lean reproductive-age women. J Clin Endocrinol Metab. 2012;97(8):2836–2843 [DOI] [PMC free article] [PubMed] [Google Scholar]
- 12. González F, Sia CL, Shepard MK, Rote NS, Minium J. Hyperglycemia-induced oxidative stress is independent of excess abdominal adiposity in normal-weight women with polycystic ovary syndrome. Hum Reprod. 2012;27(12):3560–3568 [DOI] [PMC free article] [PubMed] [Google Scholar]
- 13. Barbieri RL, Ryan KJ. Hyperandrogenism, insulin resistance, and acanthosis nigricans syndrome: a common endocrinopathy with distinct pathophysiologic features. Obstet Gynecol. 1983;147(1):90–101 [DOI] [PubMed] [Google Scholar]
- 14. González F, Rote NS, Minium J, Kirwan JP. Reactive oxygen species-induced oxidative stress in the development of insulin resistance and hyperandrogenism in polycystic ovary syndrome. J Clin Endocrinol Metab. 2006;91(1):336–340 [DOI] [PubMed] [Google Scholar]
- 15. Chanock SJ, el Benna J, Smith RM, Babior BM. The respiratory burst oxidase. J Biol Chem. 1994;269(40):24519–24522 [PubMed] [Google Scholar]
- 16. González F, Nair KS, Daniels JK, Basal E, Schimke JM, Blair HE. Hyperandrogenism sensitizes mononuclear cells to promote glucose-induced inflammation in lean reproductive-age women. Am J Physiol Endocrinol Metab. 2012;302(3):E297–E306 [DOI] [PMC free article] [PubMed] [Google Scholar]
- 17. Kirwan JP, Krishnan RK, Weaver JA, Del Aguila LF, Evans WJ. Human aging is associated with altered TNF-α production during hyperglycemia and hyperinsulinemia. Am J Physiol Endocrinol Metab. 2001;281(6):E1137–E1143 [DOI] [PubMed] [Google Scholar]
- 18. Burghen GA, Givens JR, Kitabchi AE. Correlation of hyperandrogenism with hyperinsulinism in polycystic ovarian disease. J Clin Endocrinol Metab. 1980;50(1):113–116 [DOI] [PubMed] [Google Scholar]
- 19. Nestler JE, Jakubowicz DJ, de Vargas AF, Brik C, Quintero N, Medina F. Insulin stimulates testosterone biosynthesis by human thecal cells from women with polycystic ovary syndrome by activating its own receptor and using inositolglycan mediators as the signal transduction system. J Clin Endocrinol Metab. 1998;83(6):2001–2005 [DOI] [PubMed] [Google Scholar]
- 20. Saadeh M, Ferrante TC, Kane A, Shirihai O, Corkey BE, Deeney JT. Reactive oxygen species stimulate insulin secretion in rat pancreatic islets: Studies using mono-oleoyl-glycerol. PLoS ONE. 2012;7(1):e30200–e30200 [DOI] [PMC free article] [PubMed] [Google Scholar]
- 21. El-Assaad W, Buteau J, Peyot ML, et al. Saturated fatty acids synergize with elevated glucose to cause pancreatic β-cell death. Endocrinology. 2003;144(9):4154–4163 [DOI] [PubMed] [Google Scholar]
- 22. Matsuda M, DeFronzo RA. Insulin sensitivity indices obtained from oral glucose tolerance testing: comparison with the euglycemic insulin clamp. Diabetes Care. 1999;22(9):1462–1470 [DOI] [PubMed] [Google Scholar]
- 23. Phillips DI, Clark PM, Hales CN, Osmond C. Understanding oral glucose tolerance: Comparison of glucose or insulin measurements during the oral glucose tolerance test with specific measurements of insulin resistance and insulin secretion. Diabetic Med. 1994;11(3):286–292 [DOI] [PubMed] [Google Scholar]
- 24. Gastaldelli A, Ferrannini E, Miyazaki Y, Matsuda M, DeFronzo RA. β-Cell dysfunction and glucose intolerance: results from the San Antonio metabolism (SAM) study. Diabetologia. 2004;47(1):31–39 [DOI] [PubMed] [Google Scholar]
- 25. Clasey JL, Bouchard C, Teates D, et al. The use of anthropometric and dual-energy x-ray absorptiometry (DXA) measures to estimate total abdominal and abdominal visceral fat in men and women. Obesity. 1999;7:256–264 [DOI] [PubMed] [Google Scholar]
- 26. Thusu K, Abdel-Rahman E, Dandona P. Measurement of reactive oxygen species in whole blood and mononuclear cells using chemiluminescence. Methods Mol Biol. 1998;108:57–62 [DOI] [PubMed] [Google Scholar]
- 27. Aljada A, Ghanim H, Dandona P. Translocation of p47phox and activation of NADPH oxidase in mononuclear cells. Methods Mol Biol. 2002;196:99–103 [DOI] [PubMed] [Google Scholar]
- 28. Tosi F, Negri C, Perrone F, et al. Hyperinsulinemia amplifies GnRH agonist stimulated ovarian steroid secretion in women with polycystic ovary syndrome. J Clin Endocrinol Metab. 2012;97(5):1712–1719 [DOI] [PubMed] [Google Scholar]
- 29. Franks S, Gilling-Smith C, Watson H, Willis D. Insulin action in the normal and polycystic ovary. Endocrinol Metab Clin North Am. 1999;28(2):361–378 [DOI] [PubMed] [Google Scholar]
- 30. González F, Sia CL, Shepard MK, Rote NS, Minium J. Inflammation in response to glucose ingestion is independent of excess abdominal adiposity in normal-weight women with polycystic ovary syndrome. J Clin Endocrinol Metab. 2012;97(11):4071–4079 [DOI] [PMC free article] [PubMed] [Google Scholar]
- 31. González F, Minium J, Rote NS, Kirwan JP. Hyperglycemia alters tumor necrosis factor-α release from mononuclear cells in women with polycystic ovary syndrome. J Clin Endocrinol Metab. 2005;90(9):5336–5342 [DOI] [PubMed] [Google Scholar]
- 32. Wong DH, Villanueva JA, Cress AB, Sokalska A, Ortega I, Duleba AJ. Resveratrol inhibits the mevalonate pathway and potentiates the antiproliferative effects of simvastatin in rat theca-interstitial cells. Fertil Steril. 2011;96(5):1252–1258 [DOI] [PubMed] [Google Scholar]
- 33. Spaczynski RZ, Arici A, Duleba AJ. Tumor necrosis factor-α stimulates proliferation of rat ovarian theca-interstitial cells. Biol Reprod. 1999;61(4):993–998 [DOI] [PubMed] [Google Scholar]
- 34. Sokalska A, Piotrowski PC, Rzepczynska IJ, Cress A, Duleba AJ. Statins inhibit growth of human theca-interstitial cells in PCOS and non-PCOS tissues independently of cholesterol availability. J Clin Endocrinol Metab. 2010;95(12):5390–5394 [DOI] [PMC free article] [PubMed] [Google Scholar]
- 35. Ceriello A, Bortolotti N, Motz E, et al. Meal-generated oxidative stress in type 2 diabetic patients. Diabetes Care. 1998;21(9):1529–1533 [DOI] [PubMed] [Google Scholar]
- 36. Evans JL, Goldfine ID, Maddux BA, Grodsky GM. Oxidative stress and stress-activated signaling pathways: A unifying hypothesis of type 2 diabetes. Endocr Rev. 2002;23(5):599–622 [DOI] [PubMed] [Google Scholar]
- 37. Robertson RP. β-Cell deterioration during diabetes: what's in the gun? Trends Endocrinol Metab. 2009;20(8):388–393 [DOI] [PMC free article] [PubMed] [Google Scholar]
- 38. Ehses JA, Perren A, Eppler E, et al. Increased number of islet-associated macrophages in type 2 diabetes. Diabetes. 2007;56(9):2356–2370 [DOI] [PubMed] [Google Scholar]
- 39. Ceriello A, Testa R. Antioxidant anti-inflammatory treatment in type 2 diabetes. Diabetes Care. 2009;32(Suppl 2):S232–S236 [DOI] [PMC free article] [PubMed] [Google Scholar]
- 40. Tang C, Han P, Oprescu AI, et al. Evidence for a role of superoxide generation in glucose-induced β-cell dysfunction in vivo. Diabetes. 2007;56(11):2722–2731 [DOI] [PubMed] [Google Scholar]