

Abstract
Background
The performance of a continuous glucose monitoring (CGM) system in the early stage of development was assessed in an inpatient setting that simulates daily life conditions of people with diabetes. Performance was evaluated at low glycemic, euglycemic, and high glycemic ranges as well as during phases with rapid glucose excursions.
Methods
Each of the 30 participants with type 1 diabetes (15 female, age 47 ± 12 years, hemoglobin A1c 7.7% ± 1.3%) wore two sensors of the prototype system in parallel for 7 days. Capillary blood samples were measured at least 16 times per day (at least 15 times per daytime and at least once per night). On two subsequent study days, glucose excursions were induced. For performance evaluation, the mean absolute relative difference (MARD) between CGM readings and paired capillary blood glucose readings and precision absolute relative difference (PARD), i.e., differences between paired CGM readings were calculated.
Results
Overall aggregated MARD was 9.2% and overall aggregated PARD was 7.5%. During induced glucose excursions, MARD was 10.9% and PARD was 7.8%. Lowest MARD (8.5%) and lowest PARD (6.4%) were observed in the high glycemic range (euglycemic range, MARD 9.1% and PARD 7.4%; low glycemic range, MARD 12.3% and PARD 12.4%).
Conclusion
The performance of this prototype CGM system was, particularly in the hypoglycemic range and during phases with rapid glucose fluctuations, better than performance data reported for other commercially available systems. In addition, performance of this prototype sensor was noticeably constant over the whole study period. This prototype system is not yet approved, and performance of this CGM system needs to be further assessed in clinical studies.
Keywords: accuracy, continuous glucose monitoring systems, hypoglycemia, POCT05-A, precision
Introduction
Several studies have shown that continuous glucose monitoring (CGM) systems have a beneficial impact on glycemic control, i.e., improved hemoglobin A1c and reduced frequency and intensity of glucose excursions.1–3
However, patients can achieve the best benefit from the use of CGM systems only if the systems are reliable and the results are accurate across the whole clinically relevant blood glucose (BG) range. Published data show that these requirements have been only partly fulfilled by the currently available CGM systems; measurements, especially in the low BG range or during phases with rapid glucose fluctuations, were often not reliable or accurate.4–6
Recommendations for performance evaluation of CGM systems are described in detail in the Clinical and Laboratory Standards Institute POCT05-A guideline.7 According to this guideline, performance of CGM systems should also be evaluated during induced glucose excursions to provide sufficient number of data in the low and high BG range as well as during rapid changes in glycemia. In addition, the sensor lifetime defined by the manufacturer of the CGM system should be sufficiently covered. The adequate criteria and study design for performance evaluation of CGM systems, including the assessment of intersensor variation, are discussed in detail by Obermaier and coauthors in this issue of Journal of Diabetes Science and Technology.8 In the present study, performance of a CGM system in the early stage of development was assessed. The study was performed in an inpatient setting, which simulates daily life conditions of people with diabetes. Performance evaluation included different BG concentration ranges as well as phases with rapid glucose excursions. In addition, sensor-to-sensor precision of two sensors used simultaneously in the same patient was assessed.
Methods
The study was conducted between June and October 2012 at the Institute for Diabetes Technology GmbH in Ulm, Germany, in compliance with the German Medical Devices Act and the Good Clinical Practice provisions of the Declaration of Helsinki. The study protocol was approved by the responsible ethics committee and the competent authority. Informed consent forms were signed by all subjects before beginning study procedures.
Study Population
The evaluation presented here included 30 subjects with type 1 diabetes [15 female, 15 male; age 47 ± 12 years (mean ± standard difference), range 21 to 63 years]. Time since their diabetes was diagnosed 23 ± 13 years (2 to 47 years), body mass index was 26.8 ± 4.4 kg/m2 (21.6 to 41.4 kg/m2), and hemoglobin A1c was 7.7% ± 1.3% (5.8% to 11.7%). Twenty-two subjects were treated with continuous subcutaneous insulin infusion, whereas 8 were treated with multiple daily injections.
Continuous Glucose Monitoring System
A prototype CGM system with a sensor in an early development phase (Roche Diagnostics GmbH, Mannheim, Germany) was evaluated.9 The prototype system consisted of the following components: the electrochemical sensor, the body mount (including a small battery), and the transmitter that contains the electronic components for measurement, data storage, and data transmission. After affixing the body mount to the skin of the abdomen with an integrated plaster, the sensor was inserted with the system-specific insertion device. Next, the transmitter was attached to the body mount, and the measurement process was initiated. The prototype system does not have a display. Therefore, raw data were downloaded wirelessly to a study computer multiple times per day. The CGM system was used according to the instructions in the investigators brochure provided by the manufacturer.
Study Procedure
After the subjects arrived at the study site, a short physical examination and a blood withdrawal were performed by a physician to exclude the risk of any undetected inflammation prior to CGM application. Subsequently, two sensors of the prototype system were applied by a physician to each subject to enable investigation of the sensor-to-sensor precision of the system in the same subject. The sensors were inserted into the periumbilical subcutaneous tissue of the abdomen. For each subject, each sensor of the prototype system was labeled with a unique identification. The sensor application sites were checked by a physician at least once per day. The two sensors ran simultaneously in each patient for 7 days before removal by a physician.
For assessment of the CGM system performance, glucose concentrations in capillary blood samples were measured with a commercially available BG system for self-testing (Accu-Chek® Aviva, Roche Diagnostics GmbH). Blood glucose levels were measured in duplicate (two measurements taken from one finger prick) at least 16 times per day (at least 15 times per daytime and at least once per night). The BG measurement results were considered valid if the difference between the two BG readings was ≤10% for BG values ≥100 mg/dl and ≤10 mg/dl for BG values <100 mg/dl. Otherwise, a third measurement was performed. The BG values were stored in the BG meter and downloaded to the study computer once daily.
For technical reasons, a prospective (or online) calibration was not feasible in this study, because the prototype systems do not display CGM data. Instead, the transmitter stored the sensor output data, and these data were read out at least twice per day. After day 7 of the study, the CGM sensor data and the BG data were matched and the CGM data were calibrated retrospectively. However, the applied algorithm for retrospective calibration was a simulation of a prospective calibration. For calibration of a CGM data segment between two calibrations, the current and up to three previous calibration BG values were used.
The BG values used for calibration of the prototype CGM system were those obtained with the BG meter. The system was calibrated approximately 2 h after sensor insertion (first calibration), approximately 8 h after sensor insertion (second calibration), and approximately every 12 h afterward (one calibration in the morning and one calibration in the evening of each study day). For both CGM devices, the first value of a valid double measurement was used.
The capillary BG measurement results were also used for the subjects’ diabetes management.
In order to induce glucose excursions on study days 2 and 3, a breakfast (approximately 80% carbohydrates, 20% of daily caloric need) with rapidly absorbable carbohydrates was served. The corresponding insulin doses were calculated by a study physician based on the subjects’ individual factors, with an increase in dose of approximately 15% and a delay in insulin administration of approximately 15 min. During the induced glucose excursions, capillary BG measurements were performed every 15 min for 5 h.
In addition, capillary blood samples were obtained twice per day (approximately 7:00 am and approximately 9:00 pm) for analysis with the hexokinase method (cobas 6000 c501, Roche Diagnostics, Mannheim, Germany).
Data Analysis
For data analysis, two periods of time were defined:
complete experiment (7 days, including days with induced glucose excursions)
induced glucose excursions (approximately 5 h each on two subsequent study days)
Figure 1 shows representative data of one subject over the study period of 7 days.
Figure 1.
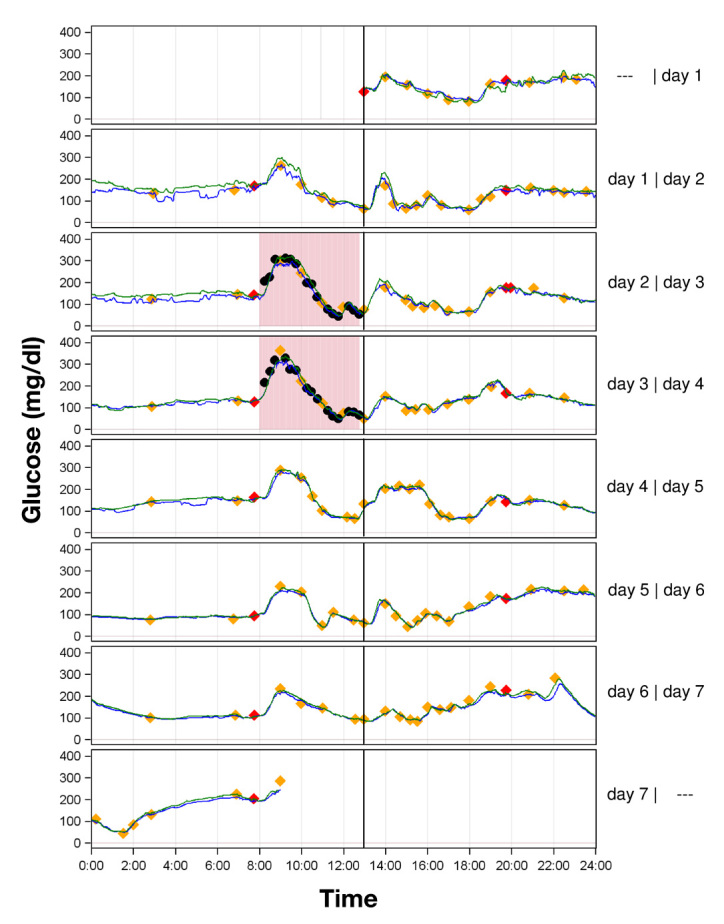
Representative experiment curves of two sensors (sensor 1, green line; sensor 2, blue line) in one subject. Study day 1 (24 h) started with the first valid sensor reading; the beginning of each study day is indicated as a black line. Calibrations with capillary BG values are displayed in red diamonds; valid duplicate capillary BG measurements are displayed in yellow diamonds. Induced glucose excursions on day 2 and day 3 are marked with light red rectangles. For analysis of the complete experiment, only one capillary BG value per hour during induced glucose excursions was included; unused capillary BG values, which were only included in evaluation of induced glucose excursions, are marked as black circles.
For the analysis according to period 1, only one capillary BG reading per hour during induced glucose excursions was included in the analysis to avoid over-representation of these excursions and to provide similar numbers of BG readings on each day. This one BG reading per hour was chosen based on the time of the last premeal BG reading, which usually was the BG at meal time. Then 1, 2, 3, 4, and 5 h were added to this time, and the BG readings with a time stamp closest to these calculated times were selected. With this approach, the times of the BG readings were similar to days without excursion. Capillary BG readings that were used for calibration of the device were excluded from the analysis.
For evaluation of the numerical accuracy of the CGM system during periods 1 and 2, the mean absolute relative difference (MARD) and precision absolute relative difference (PARD) were calculated.8 The MARD quantifies the agreement between the CGM readings and the capillary BG measurement results (i.e., accuracy). The PARD quantifies the closeness of agreement between the two CGM sensors running simultaneously in one patient (i.e., sensor-to-sensor precision). Average and aggregated MARD and PARD values were calculated. Average MARD and PARD values were calculated by taking the average of MARD and PARD results across all experiments [n = 59 for MARD, two results per subject; n = 29 for PARD, one result per subject (one sensor experiment was excluded because of malfunctioning after 2 days)]. Aggregated MARD and PARD values were calculated as aggregated mean of all paired data points. MARD could be calculated only if corresponding capillary BG measurement results were available; PARD could be calculated for the majority of the CGM recordings.
Assuming that each subject mean was calculated from exactly the same number of individual data points, then the mean average and mean aggregated results would be identical—only standard deviation would differ. However, given that the number of individual data points is not necessarily the same from subject to subject, then slight discrepancies were to be expected. This differentiation is especially important for analysis separated by glucose concentration, because it was very likely that the different subjects spent different amounts of time in each glucose concentration.
MARD is the average of the absolute differences between paired capillary BG values and CGM readings expressed as a percentage of the corresponding capillary BG values: absolute relative difference = |(CGM - BG)|/BG.
For pairing to respective CGM readings, the first value of a valid duplicate capillary BG measurement was used and paired with the CGM reading with the same time stamp (the CGM devices recorded one reading per minute), thus linear interpolation of CGM readings was not performed. Each of the two sensors per subject was analyzed separately.
The PARD was calculated as described in other studies.10,11 Instead of sensor-to-BG differences, the sensor-to-sensor differences were calculated as the difference between sensor readings divided by the average of the sensors readings.
Categorization of single absolute relative differences into the glucose ranges <70, 70–180, and >180 mg/dl was performed based on the corresponding capillary BG value for MARD or based on the average of the corresponding sensor readings for PARD. The BG readings were not suitable for assignment to glycemic range for PARD, because they were available only for a few time points.
Calculation of MARD and PARD broken down by glucose rate of change was not performed. For a suitable evaluation broken down by rate of change, one would require longer phases of high-frequency glucose measurements and an appropriate percentage of results within each rate-of-change category. This would have made the study design more complex, because more phases with glucose excursions and high-frequency data collection would have been necessary. This evaluation focused on more general statements about performance during times of fast rates of glucose change.
The MARD was also calculated based on the hexokinase method results. The CGM reading that was recorded at blood sampling time was used for pairing. For this analysis, it has to be taken into account that, besides accuracy, which is higher for hexokinase method than for BG meter, a possible systematic measurement error between hexokinase method and BG meter may influence the analysis, because the CGM system was calibrated against BG meter results.
An evaluation of the clinical accuracy of the CGM system was performed for the complete experiments using Clarke error grid analysis.12 For this analysis, the agreement between an individual CGM measurement result and the respective mean value of a valid duplicate capillary BG measurement result is plotted in a scatter plot. The plot is divided into five zones with different clinical relevance.
Results
In total, 6801 capillary BG measurement results were paired to CGM results obtained from 59 sensor experiments with approximately 9% of these being in the low glycemic range (<70 mg/dl), approximately 64% in the euglycemic range (70–180 mg/dl), and approximately 27% in the high glycemic range (>180 mg/dl). Sensor-to-sensor pairing were performed for 281,394 measurement results obtained from 58 sensors (29 sensor pairs), with approximately 7% in the low glycemic range, approximately 71% in the euglycemic range, and approximately 21% in the high glycemic range (Table 1).
Table 1.
Mean Absolute Relative Difference and Precision Absolute Relative Difference (Mean ± Standard Deviation)a
| Average MARD (%) n = 59 | Aggregated MARD (%) | Average PARD (%) n = 29 | Aggregated PARD (%) | ||
|---|---|---|---|---|---|
| Complete experiment (day 1–day 7) | Overall | 9.2 ± 2.1 | 9.2 ± 8.1 n = 6801 | 7.6 ± 2.3 | 7.5 ± 8.3 n = 281,394 |
| Day 1 | 10.4 ± 3.6 | 10.4 ± 8.9 n = 928 | 10.3 ± 4.3 | 10.3 ± 9.8 n = 41,760 | |
| Day 2 | 10.4 ± 3.4 | 10.5 ± 9.0 n = 1028 | 9.5 ± 2.9 | 9.5 ± 8.2 n = 41,760 | |
| Day 3 | 9.8 ± 2.9 | 9.8 ± 8.4 n = 1037 | 7.9 ± 3.1 | 7.9 ± 8.2 n = 41,760 | |
| Day 4 | 8.7 ± 3.2 | 8.7 ± 7.6 n = 1074 | 6.5 ± 2.8 | 6.5 ± 7.8 n = 41,760 | |
| Day 5 | 8.2 ± 3.2 | 8.3 ± 7.7 n = 1057 | 5.4 ± 3.1 | 5.4 ± 6.7 n = 41,760 | |
| Day 6 | 7.9 ± 2.8 | 7.9 ± 6.7 n = 1003 | 6.0 ± 3.8 | 6.0 ± 7.4 n = 41,760 | |
| Day 7 | 9.0 ± 4.1 | 9.0 ± 8.0 n = 674 | 7.1 ± 4.7 | 7.0 ± 8.7 n = 30,834 | |
| <70 mg/dl | 13.6 ± 5.6 | 12.3 ± 9.6 n = 594 | 12.1 ± 5.1 | 12.4 ± 13.7 n = 20,236 | |
| 70 – 180 mg/dl | 9.2 ± 2.3 | 9.1 ± 8.1 n = 4370 | 7.5 ± 2.3 | 7.4 ± 8.1 n = 200,982 | |
| >180 mg/dl | 8.3 ± 2.8 | 8.5 ± 7.2 n = 1837 | 6.4 ± 2.2 | 6.4 ± 5.9 n = 60,176 | |
| Induced glucose excursions | 10.9 ± 3.1 | 10.9 ± 9.2 n = 2220 | 7.8 ± 2.7 | 7.8 ± 6.7 n = 16,588 |
For calculation of the average, MARD data from all 59 recordings were used, whereas aggregated MARD and PARD calculations are based on individual absolute relative differences of the two CGM systems carried by each of the 29 patients with type 1 diabetes studied. n, number of data pairs.
The MARD and PARD results (mean ± standard deviation) for all complete experiments and the induced glucose excursions are shown in Table 1. Over the 7 days of the study period, aggregated MARD ranged from 10.5% ± 9.0% (day 2) to 7.9% ± 6.7% (day 6) and aggregated PARD ranged from 10.3% ± 9.8% (day 1) to 5.4% ± 6.7% (day 5; Table 1, Figures 2 and 3).
Figure 2.
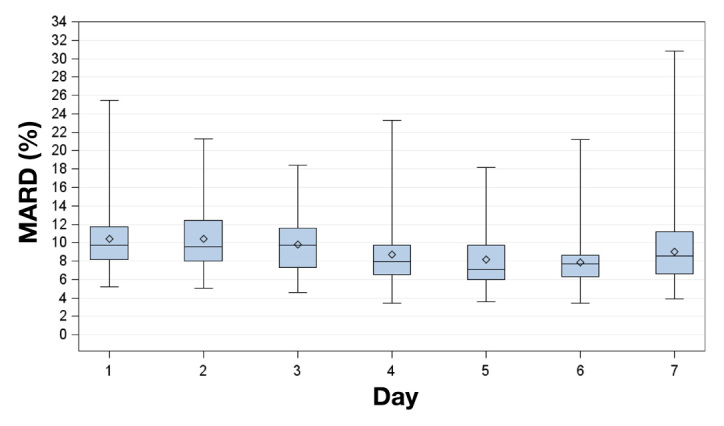
Box plots for MARD on successive study days. Displayed are mean (diamonds), median (horizontal lines within boxes), 25th and 75th percentiles (lower and upper edge of the boxes), and minimum and maximum values (antennae).
Figure 3.
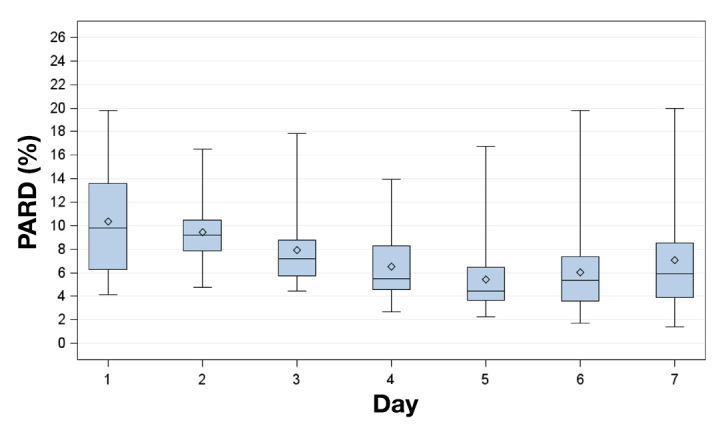
Box plot for PARD on successive study days. Displayed are mean (diamonds), median (horizontal lines within boxes), 25th and 75th percentiles (lower and upper edge of the boxes), and minimum and maximum values (antennae).
Regarding MARD and PARD for the three different BG ranges separately, the lowest MARD (8.5% ± 7.2%) and the lowest PARD (6.4% ± 5.9%) were observed in the high glycemic range. In the low glycemic range (<70 mg/dl), MARD (12.3% ± 9.6%) and PARD (12.4% ± 13.7%) were higher.
During induced glucose excursions, the average MARD was higher (10.9% ± 9.2%) compared with the complete experiments (9.2% ± 8.1%). However, average PARD was not different between the complete experiments and the induced glucose excursions (7.5% ± 8.3% versus 7.8% ± 6.7%).
High rates of change of glycemia were observed during induced glucose excursions, with 13% of rates of change of glycemia ≤-3 or >3 mg/dl/min and 42% between -1 and 1 mg/dl/min (Figure 4).
Figure 4.
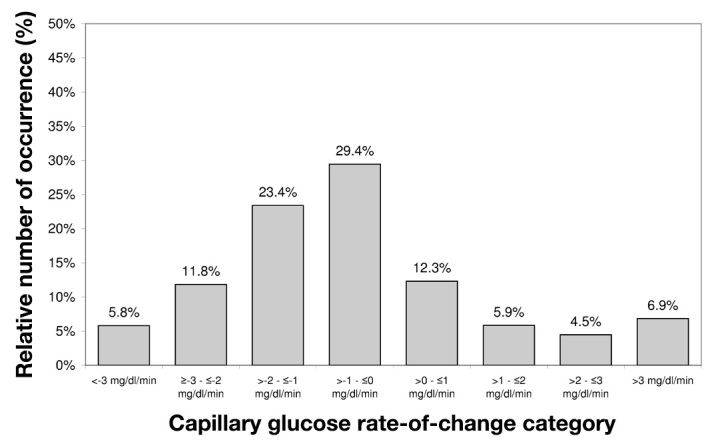
Relative number of occurrence of capillary glucose rates of change during induced glucose excursions. Capillary glucose measurements were performed every 15 min.
The MARD between the hexokinase measurement results and CGM readings (664 data points) was 8.4% ± 7.4%.
Clarke error grid analysis showed that 83.4% of the CGM system results are in zone A, 15.3% in zone B, and 1.3% in zone D (Figure 5).
Figure 5.
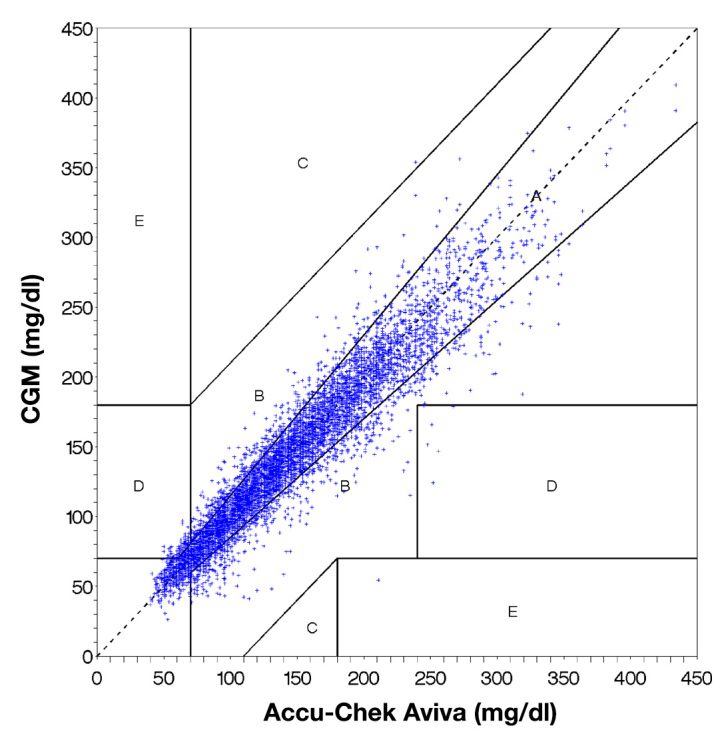
Clarke error grid analysis of the paired values obtained with the CGM system and a comparison measurement with a BG meter (Accu-Chek Aviva). Clinically accurate or acceptable readings are presented as dots in the zones A and B.
The percentage of CGM readings with differences of <5%, <10%, <20%, and <30% from the corresponding capillary BG values are shown in Table 2. The percentage of CGM readings with <30% deviation was similar in the low glycemic, euglycemic, and high glycemic range (94.9–98.3%). In the low glycemic range, the percentage of deviations <10% (50.3%) and <5% (26.6%) was lower than in the euglycemic and high glycemic range (<10%, 65.6% and 66.7%; <5%, 37.5% and 38.1%).
Table 2.
Cumulative Percentage of Continuous Glucose Monitoring Readings within 5%, 10%, 20%, and 30% Deviation of Capillary Comparison Readings for Complete Experiments
| Within 5% | Within 10% | Within 20% | Within 30% | |
|---|---|---|---|---|
| Overall | 36.7 | 64.5 | 90.8 | 97.4 |
| <70 mg/dl | 26.6 | 50.3 | 79.3 | 94.9 |
| 70–180 mg/dl | 37.5 | 65.6 | 91.3 | 97.3 |
| >180 mg/dl | 38.1 | 66.7 | 93.6 | 98.3 |
Discussion
This evaluation study was performed in an inpatient setting that simulates daily life conditions of people with diabetes. Performance evaluation included different BG concentration ranges as well as phases with rapid glucose excursions.7,8 In addition, sensor-to-sensor precision of two sensors used simultaneously in the same patient was assessed.8 However, it should be mentioned that the study procedure did not closely follow the POCT05-A guideline, and some recommendations, e.g., evaluation of three data collection segments, including glucose fluctuations and assessment of clinical accuracy using the continuous glucose error grid analysis, were not taken into account.
Performance of the prototype CGM system evaluated in this study showed a reliability and accuracy that is at least similar to or even better than reported data from currently marketed CGM systems.6,13–16 Some of the reported performance data of available CGM systems were obtained with similar procedures under similar conditions, thus allowing for an appropriate comparison to the results presented here.6,16
The observed improvement in CGM performance over the usage period has already been reported for other CGM systems.6,10,16,17 However, performance of the proto-type sensor was noticeably constant over the study period. In this study, performance peaked on days 5 and 6, and both MARD and PARD showed higher mean values and higher variances afterward. However, the results of days 6 and 7 were still similar to the average results.
One important aspect to consider regarding the clinical utility of CGM systems in the daily life of people with diabetes is the system’s ability to detect hypoglycemic events adequately. Detection of unrecognized hypoglycemia prior to the onset of major symptoms can help people with diabetes become aware of impending hypoglycemic events and apply appropriate therapeutic action.
However, suboptimal performance of CGM systems in the hypoglycemic range is a frequently discussed problem that limits applicability of CGM systems.5,18,19 The sensor investigated in this study also showed its poorest performance in the low glycemic range. However, compared with currently available CGM systems, the sensor’s performance in this range was remarkably better.5,6,13–17
One factor that potentially affects the performance of CGM systems is the time delay of these systems, particularly during rapid changes in glycemia.20,21 Such time delays are caused by two factors: (1) a physiological delay between changes in BG and interstitial glucose and (2) device-dependent delays in measurement.20,22 In this evaluation, the MARD and the PARD were remarkably better during induced glucose fluctuations compared with available CGM systems.6,16 This suggests a decreased device-dependent time delay, as the physiological delay is assumed to be constant/comparable among CGM systems.
Conclusion
Performance data of the prototype CGM system evaluated in this study are at least comparable to currently available CGM systems; however, particularly in the low glycemic range and during phases with rapid glucose fluctuations, it outperforms other CGM systems. Nevertheless, this prototype system is not yet approved, and performance of this CGM system needs to be further assessed in clinical studies.
Acknowledgments
We thank Prof. Dr. Lutz Heinemann and Dr. Volker Lodwig for their valuable input. Scientific writing was supported by Roche Diagnostics GmbH, Mannheim, Germany.
Glossary
- (BG)
blood glucose
- (CGM)
continuous glucose monitoring
- (MARD)
mean absolute relative difference
- (PARD)
precision absolute relative difference
Funding
This study was funded by a grant from Roche Diagnostics GmbH, Mannheim, Germany.
Disclosures
Guido Freckmann is general manager of the Institute for Diabetes Technology Research and Development GmbH at Ulm University, which conducts studies that evaluate BG meters and medical devices for diabetes therapy on behalf of various companies. Guido Freckmann/the Institute for Diabetes Technology Research and Development GmbH at Ulm University received speakers’ honoraria from Abbott, Bayer, Berlin Chemie, Roche Diagnostics, Ypsomed, and Sanofi. Karin Obermaier, Michael Schoemaker, Monika Strasser, Gerhard Frisch, and Günther Schmelzeisen-Redeker are employees of Roche Diagnostics GmbH, Mannheim, Germany.
References
- 1.Garg SK, Schwartz S, Edelman SV. Improved glucose excursions using an implantable real-time continuous glucose sensor in adults with type 1 diabetes. Diabetes Care. 2004;27(3):734–738. doi: 10.2337/diacare.27.3.734. [DOI] [PubMed] [Google Scholar]
- 2.Battelino T, Phillip M, Bratina N, Nimri R, Oskarsson P, Bolinder J. Effect of continuous glucose monitoring on hypoglycemia in type 1 diabetes. Diabetes Care. 2011;34(4):795–800. doi: 10.2337/dc10-1989. [DOI] [PMC free article] [PubMed] [Google Scholar]
- 3.Pickup JC, Freeman SC, Sutton AJ. Glycaemic control in type 1 diabetes during real time continuous glucose monitoring compared with self monitoring of blood glucose: meta-analysis of randomised controlled trials using individual patient data. BMJ. 2011;343:d3805. doi: 10.1136/bmj.d3805. [DOI] [PMC free article] [PubMed] [Google Scholar]
- 4.Wentholt IM, Hoekstra JB, DeVries JH. Continuous glucose monitors: the long-awaited watch dogs? Diabetes Technol Ther. 2007;9(5):399–409. doi: 10.1089/dia.2007.0215. [DOI] [PubMed] [Google Scholar]
- 5.Zijlstra E, Heise T, Nosek L, Heinemann L, Heckermann S. Continuous glucose monitoring: quality of hypoglycaemia detection. Diabetes Obes Metab. 2013;15(2):130–135. doi: 10.1111/dom.12001. [DOI] [PubMed] [Google Scholar]
- 6.Freckmann G, Pleus S, Link M, Zschornack E, Klötzer HM, Haug C. Performance evaluation of three continuous glucose monitoring systems: comparison of six sensors per subject in parallel. J Diabetes Sci Technol. 2013;7(4):842–853. doi: 10.1177/193229681300700406. [DOI] [PMC free article] [PubMed] [Google Scholar]
- 7. Clinical and Laboratory Standards Institute. Performance metrics for continuous interstitial glucose monitoring; approved guideline. http://shopping.netsuite.com/c.1253739/site/Sample_pdf/POCT05A__sample.pdf. Accessesd on June 14, 2013.
- 8.Obermaier K, Schmelzeisen-Redeker G, Schoemaker M, Kloetzer HM, Kirchsteiger H, Eikmeier H. Performance evaluations of continuous glucose monitoring systems: precision absolute relative difference is part of the assessment. J Diabetes Sci Technol. 2013;7(4):824–832. doi: 10.1177/193229681300700404. [DOI] [PMC free article] [PubMed] [Google Scholar]
- 9.Schmelzeisen-Redeker G, Staib A, Strasser M, Müller U, Schoemaker M. Overview of a novel sensor for continuous glucose monitoring. J Diabetes Sci Technol. 2013;7(4):808–814. doi: 10.1177/193229681300700402. [DOI] [PMC free article] [PubMed] [Google Scholar]
- 10.Zisser HC, Bailey TS, Schwartz S, Ratner RE, Wise J. Accuracy of the SEVEN continuous glucose monitoring system: comparison with frequently sampled venous glucose measurements. J Diabetes Sci Technol. 2009;3(5):1146–1154. doi: 10.1177/193229680900300519. [DOI] [PMC free article] [PubMed] [Google Scholar]
- 11.Bailey T, Zisser H, Chang A. New features and performance of a next-generation SEVEN-day continuous glucose monitoring system with short lag time. Diabetes Technol Ther. 2009;11(12):749–755. doi: 10.1089/dia.2009.0075. [DOI] [PubMed] [Google Scholar]
- 12.Clarke WL, Cox D, Gonder-Frederick LA, Carter W, Pohl SL. Evaluating clinical accuracy of systems for self-monitoring of blood glucose. Diabetes Care. 1987;10(5):622–628. doi: 10.2337/diacare.10.5.622. [DOI] [PubMed] [Google Scholar]
- 13.Garg SK, Smith J, Beatson C, Lopez-Baca B, Voelmle M, Gottlieb PA. Comparison of accuracy and safety of the SEVEN and the Navigator continuous glucose monitoring systems. Diabetes Technol Ther. 2009;11(2):65–72. doi: 10.1089/dia.2008.0109. [DOI] [PubMed] [Google Scholar]
- 14.Weinstein RL, Schwartz SL, Brazg RL, Bugler JR, Peyser TA, McGarraugh GV. Accuracy of the 5-day FreeStyle Navigator Continuous Glucose Monitoring System: comparison with frequent laboratory reference measurements. Diabetes Care. 2007;30(5):1125–1130. doi: 10.2337/dc06-1602. [DOI] [PubMed] [Google Scholar]
- 15.Damiano ER, El-Khatib FH, Zheng H, Nathan DM, Russell SJ. A comparative effectiveness analysis of three continuous glucose monitors. Diabetes Care. 2013;36(2):251–259. doi: 10.2337/dc12-0070. [DOI] [PMC free article] [PubMed] [Google Scholar]
- 16.Pleus S, Schmid C, Link M, Zschornack E, Klötzer HM, Haug C, Freckmann G. Performance evaluation of a continuous glucose monitoring system under conditions similar to daily life. J Diabetes Sci Technol. 2013;7(4):833–841. doi: 10.1177/193229681300700405. [DOI] [PMC free article] [PubMed] [Google Scholar]
- 17.Luijf YM, Avogaro A, Benesch C, Bruttomesso D, Cobelli C, Ellmerer M, Heinemann L, Mader JK, DeVries JH, AP@home consortium Continuous glucose monitoring accuracy results vary between assessment at home and assessment at the clinical research center. J Diabetes Sci Technol. 2012;6(5):1103–1106. doi: 10.1177/193229681200600514. [DOI] [PMC free article] [PubMed] [Google Scholar]
- 18.Hermanides J, Phillip M, DeVries JH. Current application of continuous glucose monitoring in the treatment of diabetes: pros and cons. Diabetes Care. 2011;34(Suppl 2):S197–S201. doi: 10.2337/dc11-s219. [DOI] [PMC free article] [PubMed] [Google Scholar]
- 19.Ramchandani N, Arya S, Ten S, Bhandari S. Real-life utilization of real-time continuous glucose monitoring: the complete picture. J Diabetes Sci Technol. 2011;5(4):860–870. doi: 10.1177/193229681100500407. [DOI] [PMC free article] [PubMed] [Google Scholar]
- 20.Wei C, Lunn DJ, Acerini CL, Allen JM, Larsen AM, Wilinska ME, Dunger DB, Hovorka R. Measurement delay associated with the Guardian RT continuous glucose monitoring system. Diabet Med. 2010;27(1):117–122. doi: 10.1111/j.1464-5491.2009.02887.x. [DOI] [PMC free article] [PubMed] [Google Scholar]
- 21.Monsod TP, Flanagan DE, Rife F, Saenz R, Caprio S, Sherwin RS, Tamborlane WV. Do sensor glucose levels accurately predict plasma glucose concentrations during hypoglycemia and hyperinsulinemia? Diabetes Care. 2002;25(5):889–893. doi: 10.2337/diacare.25.5.889. [DOI] [PubMed] [Google Scholar]
- 22.Keenan DB, Mastrototaro JJ, Voskanyan G, Steil GM. Delays in minimally invasive continuous glucose monitoring devices: a review of current technology. J Diabetes Sci Technol. 2009;3(5):1207–1214. doi: 10.1177/193229680900300528. [DOI] [PMC free article] [PubMed] [Google Scholar]