

Abstract
Background
This study aimed at evaluating and comparing the performance of a new generation of continuous glucose monitoring (CGM) system versus other CGM systems, under daily lifelike conditions.
Methods
A total of 10 subjects (7 female) were enrolled in this study. Each subject wore two Dexcom G4™ CGM systems in parallel for the sensor lifetime specified by the manufacturer (7 days) to allow assessment of sensor-to-sensor precision. Capillary blood glucose (BG) measurements were performed at least once per hour during daytime and once at night. Glucose excursions were induced on two occasions. Performance was assessed by calculating the mean absolute relative difference (MARD) between CGM readings and paired capillary BG readings and precision absolute relative difference (PARD), i.e., differences between paired CGM readings.
Results
Overall aggregate MARD was 11.0% (n = 2392). Aggregate MARD for BG <70 mg/dl was 13.7%; for BG between 70 and 180 mg/dl, MARD was 11.4%; and for BG >180 mg/dl, MARD was 8.5%. Aggregate PARD was 7.3%, improving from 11.6% on day 1 to 5.2% on day 7.
Conclusions
The Dexcom G4 CGM system showed good overall MARD compared with results reported for other commercially available CGM systems. In the hypoglycemic range, where CGM performance is often reported to be low, the Dexcom G4 CGM system achieved better MARD than that reported for other CGM systems in the hypoglycemic range. In the hyperglycemic range, the MARD was comparable to that reported for other CGM systems, whereas during induced glucose excursions, the MARD was similar or slightly worse than that reported for other CGM systems. Overall PARD was 7.3%, improving markedly with sensor life time.
Keywords: accuracy, continuous glucose monitoring, diabetes management, hypoglycemia
Introduction
Continuous glucose monitoring (CGM) systems provide a complete view of glycemic control over time, e.g., minute-by-minute snapshots of glucose values and their excursions, compared with isolated measurements in self-monitoring of blood glucose (SMBG). Continuous glucose monitoring provides information to people with diabetes at times when SMBG is not feasible (e.g., when sleeping), and CGM decreases hemoglobin A1c in adult patients with type 1 diabetes who use the devices frequently, e.g., by incorporating a low-glucose insulin pump suspension or by motivating patients to behavioral changes.1–5
Continuous glucose monitoring systems typically consist of a sensor that is applied on the body to measure glucose concentrations in the interstitial fluid, a transmitter that is attached to the sensor, and a receiver that communicates wirelessly with the transmitter and on which glucose data are displayed. Most CGM systems provide onscreen glucose graphs that also indicate the direction and rate of glucose change, and typically, alarms can be set for high and low glucose values.
Accuracy of the glucose measurements and reliability of the CGM system are relevant factors in the use of CGM systems by people with diabetes. In 2008, the Clinical and Laboratory Standards Institute (Wayne, PA) published the POCT05-A, “Performance Metrics for Continuous Interstitial Glucose Monitoring; Approved Guideline.”6 This guideline provides recommendations for performance evaluation of CGM systems with respect to study design and parameters of interest. The study presented here was designed to fulfill these recommendations in part. Specifically, segments with high-frequency blood glucose (BG) measurements, fast rates of glucose change, and a suitable number of measurement results below 70 mg/dl and above 180 mg/dl should be achieved.
Numerous studies about performance of CGM systems have been published,7–24 but only one employed the recommendations of POCT05-A,18 and none of these studies investigated the CGM system used here.
Purpose of Study
The aim of this study was to investigate the performance of a CGM system that has been introduced into the market (Dexcom G4™; Dexcom, San Diego, CA) in a setting resembling daily life but also incorporating parts of the POCT05-A guideline. Performance was assessed by sensor-to-BG differences. For the additional evaluation of sensor-to-sensor differences, participants used two sensors simultaneously.
Methods
The study was conducted in October 2012 in compliance with the German Medical Devices Act and the Good Clinical Practice provisions of the Declaration of Helsinki at the Institute for Diabetes-Technology GmbH in Ulm, Germany. The study protocol was approved by the responsible ethics committee (Landesärztekammer (state board of physicians) Baden-Württemberg) and the competent authority (Bundesinstitut für Arzneimittel und Medizinprodukte, Federal Institute for Drugs and Medical Devices). Informed consent forms were signed by all subjects before beginning study procedures.
Study Population
All 10 subjects who were screened were eligible for study participation; there were no screening failures or dropouts. All study participants (7 female, 3 male) had type 1 diabetes; 9 were treated with continuous subcutaneous insulin infusion, and 1 was treated with multiple daily injections that were applied with an insulin pen [one injection per day for basal insulin (insulin glargine) and insulin aspart for meal and correction doses]. The subjects’ age was 49 ± 7 years (mean ± standard deviation; range 39 to 63 years); duration of diabetes was 32 ± 12 years (16 to 47 years); body mass index was 27.0 ± 5.8 kg/m2 (21.6 to 41.4 kg/m2); and hemoglobin A1c was 8.0% ± 1.5% (6.8 to 11.7%).
Some subjects had used CGM systems prior to, but not while, participating in the study.
Continuous Glucose Monitoring Systems
In this study, the Dexcom G4 stand-alone CGM system was evaluated; all parts of the system were purchased on the German market. According to the local distributor, the Dexcom G4 stand-alone system is identical to the Dexcom G4 Platinum system sold in the United States.
The system was used according to manufacturer’s labeling, especially with regard to sensor location on the body (discussed later), calibration intervals, and wear time of the sensor (7 days).
Study Procedure
The subjects stayed at the study site once for approximately 7 days and used two G4 systems in parallel (i.e., two sensors, two transmitters, two receivers). For evaluation purposes, the study days were aligned to the G4 usage time so that day 1 started with the first calibration of the CGM system (i.e., input of a SMBG value for actual display of BG values on the receiver; approximately 5:00 pm of the first calendar day; Figure 1).
Figure 1.
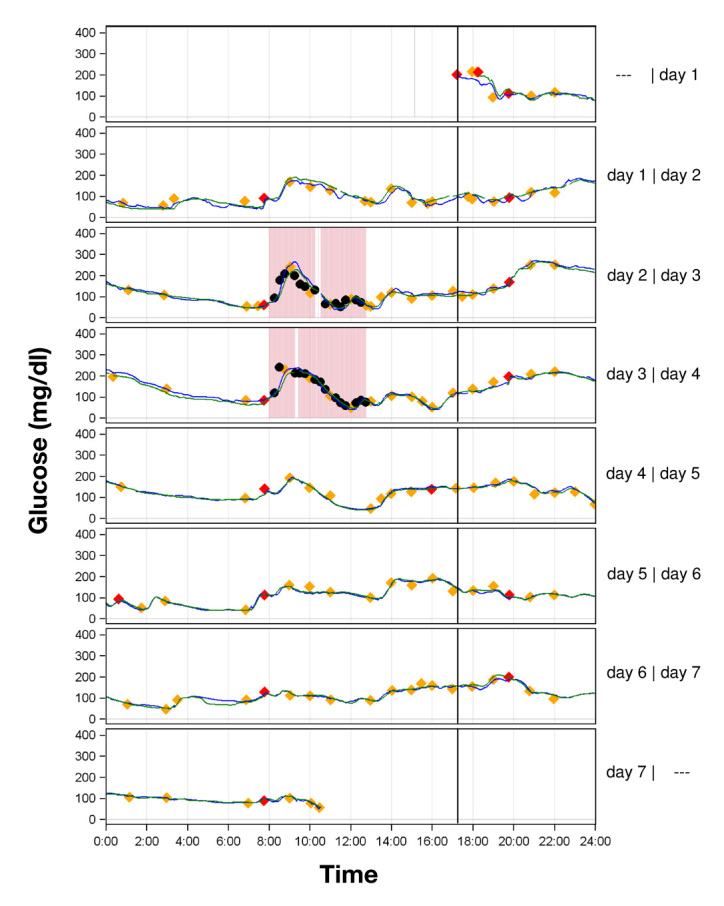
Parallel CGM recordings in one patient with type 1 diabetes with two G4 CGM systems (green and blue line). The marked time periods on days 2 and 3 are those in which pronounced glucose excursions were induced. Red diamonds represent results of capillary BG measurements used for calibration of the CGM system; orange diamonds represent results from capillary BG measurements used for calculation of the MARD for complete experiments and, if they lie within the red rectangles, for induced glucose excursions. Black circles represent results from BG measurements that were only included in the evaluation of induced glucose excursions.
Subjects arrived at the study site in the morning of the first calendar day and underwent a short physical examination. Afterward, a physician inserted the two CGM sensors into each subject. The sensors were inserted into the subjects’ periumbilical subcutaneous tissue of the abdomen using the system-specific insertion device. The G4 transmitters and receivers of the two systems provided to each subject were labeled “A” or “B” to provide unique identification of each system. Sensors were removed by a physician between breakfast and lunch on calendar day 8 so that the maximum sensor usage time was marginally below the lifetime of 7 days specified by the manufacturer. Sensor survival rate was 100%. However, on one occasion, the transmitter of a CGM system had to be replaced directly after sensor insertion, because it could not be connected to the CGM receiver.
Calibration of the G4 systems was performed according to manufacturer labeling: 2 h after sensor insertion and then every 12 h. Subjects were allowed to calibrate their systems under supervision of study staff.
Throughout the study, subjects were allowed to move around the study site freely and to leave the study site on their own, except, for safety reasons, on days with induced glucose excursions. Subjects had to be present for breakfast, lunch, and dinner, which were served at 8:00 am, 1:00 pm, and 6:00 pm, respectively. Apart from the breakfasts used for inducing glucose excursions, meal size and composition were unrestricted. Because the subjects were also wearing another, nonwaterproof device, they were not allowed to shower or bathe.
During the entire study, capillary BG was measured at least once per hour between 6:00 am and 10:00 pm and at least once at night with a BG meter (ACCU-CHEK® Aviva; Roche Diagnostics GmbH, Mannheim, Germany). Measurements were performed in duplicate (two measurements taken from one finger prick). If the deviation between the two BG measurement results was >10% for BG values ≥100 mg/dl or >10 mg/dl for BG values <100 mg/dl, a third measurement was performed to provide a valid duplicate measurement (composed of those two measurements that showed the lowest difference). The capillary BG readings were performed without checking the current CGM reading.
The BG meter readings were also used for calibration of the G4 sensors. For both CGM systems (A and B), the first value of a valid double measurement (discussed earlier) was used. For the first calibration (2 h after insertion), which requires input of two BG values, both values of a valid double BG measurement were used.
For evaluation of CGM system performance according to the POCT05-A guideline, glycemic excursions with values in the hyperglycemic and hypoglycemic range and with rapid changes in glycemia were induced on study days 2 and 3 (Figure 1). Hypoglycemia and hyperglycemia were defined as BG values below 70 mg/dl and above 250 mg/dl, respectively, and rapid changes in glycemia were defined following POCT05-A. To induce such excursions, breakfasts with high glycemic indexes were served to the subjects and the corresponding insulin doses were varied at the physician’s discretion.
The breakfast had a composition of approximately 80% carbohydrates, 10% protein, and 10% fat with a caloric content of a maximum of 20% of the subject’s daily caloric demand to limit the resulting insulin dose that had to be applied.
The physician calculated the prandial insulin bolus based on the capillary BG value measured prior to the start of meal and the subject’s therapeutic data. To induce pronounced postprandial excursions, the calculated insulin bolus was increased by approximately 15% and applied with a delay of approximately 15 min. With this procedure, early postprandial hyperglycemia and late postprandial hypoglycemia were achieved. Apart from this insulin bolus adjustment, subjects followed their regular diabetes therapy.
The high-frequency BG measurements during postprandial glycemic excursions stopped after approximately 5 h independent from the current BG values or rate of glucose change, changing back to the regular measurement frequency. During such experimental phases with induced changes in glycemia, additional capillary measurements were performed in 15 min intervals to closely monitor changes in the subjects’ BG levels. The main reason for the increased measurement frequency was subject safety, but it also provided the POCT05-A-recommended segments with high-frequency BG sampling. Regulation of the insulin boluses and monitoring of the BG levels during these phases was performed by the study physician.
On the last study day, the CGM systems were removed and the study physician examined the sensor insertion sites and performed a final physical examination.
Figure 1 shows two representative data of one subject.
Data Analysis
The CGM system recorded glucose readings only between 40 and 400 mg/dl; readings outside this range were recorded as “low” or “high” (i.e., no numerical value was assigned) and therefore excluded from data analysis. For evaluation, the CGM readings, which were recorded with rates of one reading per 5 min, were interpolated linearly to one reading per minute. Missing values were not interpolated.
The first value of a valid duplicate capillary BG measurement result was used for pairing to interpolated CGM readings to imitate the behavior of a CGM end user who typically does perform single BG measurements.
For data analysis, the following time frames were defined:
Complete experiment (7 days). In this analysis, the number of capillary BG readings during the induced glycemic excursions was limited to one per hour in order to provide similar numbers of readings for each study day.
Induced glucose excursions. This subanalysis was restricted to the two periods in which glycemic excursions were induced (i.e., approximately 10 h per subject). In this subanalysis, all capillary BG readings obtained were included in the analysis.
Mean absolute relative difference (MARD) and precision absolute relative difference (PARD) were calculated to assess numerical accuracy.25
For calculation of MARD, the mean of the duplicate capillary BG readings were paired to interpolated CGM readings. Then the absolute of the difference between CGM reading and mean of the duplicate BG reading was divided by the mean of the duplicate capillary BG measurement results. These relative differences were evaluated as averages across all the experiments’ MARD results (n = 20) and as aggregated mean over single absolute relative differences. For calculation of MARD in the glucose ranges <70, 70–180, and >180 mg/dl, the absolute relative differences were categorized depending on the corresponding capillary BG reading. Each of the two CGM systems per subject was analyzed separately.
The PARD was calculated in a similar fashion; interpolated CGM readings of one system were subtracted from interpolated CGM readings of the other system, and this difference was divided by the average of the interpolated CGM readings of the two sensors.13,14 Again, the average across all experiment PARD results (n = 10) and aggregated mean over single relative differences were calculated. Categorization of single absolute relative differences into one of the three glucose ranges mentioned before was performed based on the average of the corresponding sensor readings.
The Clarke error grid analysis (EGA) was used for clinical evaluation of point accuracy.26
Results
Complete Experiments
Results for the MARD and PARD are displayed in Table 1.
Table 1.
Mean Absolute Relative Difference and Precision Absolute Relative Difference of the Dexcom G4 CGM System (Mean ± Standard Deviation)a
| Average MARD, % (n = 20) | Aggregated MARD, % | Average PARD, % (n = 10) | Aggregated PARD, % | ||
| Complete experiment (days 1–7) | Overall | 10.9 ± 1.5 | 11.0 ± 10.0 n = 2392 | 7.3 ± 1.9 | 7.3 ± 8.1 n = 96430 |
| Day 1 | 15.1 ± 6.5 | 15.5 ± 14.4 n = 325 | 11.7 ± 4.8 | 11.6 ± 11.5 n = 14037 | |
| Day 2 | 12.4 ± 3.5 | 12.6 ± 11.0 n = 370 | 7.3 ± 3.4 | 7.3 ± 7.3 n = 14305 | |
| Day 3 | 10.7 ± 3.3 | 10.7 ± 9.5 n = 340 | 8.7 ± 4.0 | 8.7 ± 8.4 n = 14232 | |
| Day 4 | 9.6 ± 2.7 | 9.6 ± 8.3 n = 367 | 6.0 ± 2.7 | 6.0 ± 6.2 n = 14299 | |
| Day 5 | 10.5 ± 2.5 | 10.6 ± 8.7 n = 374 | 6.8 ± 2.9 | 6.8 ± 7.5 n = 14190 | |
| Day 6 | 8.7 ± 2.0 | 8.7 ± 7.6 n = 363 | 5.2 ± 1.9 | 5.2 ± 5.9 n = 14334 | |
| Day 7 | 8.4 ± 2.2 | 8.6 ± 7.2 n = 253 | 5.2 ± 3.3 | 5.2 ± 6.3 n = 11033 | |
| <70 mg/dl | 13.1 ± 4.1 | 13.7 ± 10.4 n = 210 | 13.6 ± 5.6 | 14.2 ± 12.2 n = 6987 | |
| 70–180 mg/dl | 11.5 ± 1.7 | 11.4 ± 10.6 n = 1648 | 7.3 ± 1.7 | 7.3 ± 7.8 n = 69061 | |
| >180 mg/dl | 8.4 ± 1.3 | 8.5 ± 7.2 n = 534 | 5.2 ± 2.0 | 5.0 ± 5.4 n = 20382 | |
| Induced glucose excursions | Analysis versus capillary ACCU-CHEK Aviva | 17.0 ± 3.7 | 17.0 ± 12.8 n = 743 | 9.3 ± 4.2 | 9.3 ± 8.9 n = 5675 |
For calculation of the average MARD, data from all 20 recordings were used, whereas aggregated MARD and PARD calculations are based on individual absolute relative differences of the two CGM systems carried by each of the 10 patients with type 1 diabetes studied (n = number of data pairs).
Aggregate MARD for the G4 systems was 11.0%, based on all individual paired data points from 20 recordings from 10 subjects (n = 2392); the measurement quality improved with time, starting at 15.5% on day 1 and ending at 8.6% on day 7 (Table 1; Figure 2). In the low BG range (<70 mg/dl), 9% of all capillary BG readings were in this range; the aggregate MARD was 13.7%. The aggregate MARD in the euglycemic and hyperglycemic ranges was 11.4% (69% of readings) and 8.5% (22% of readings), respectively.
Figure 2.
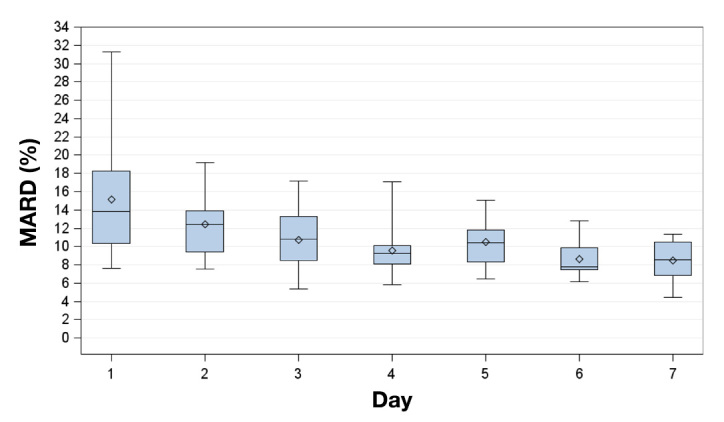
Box plots for the MARD on successive study days. Displayed are mean (diamonds), median (horizontal lines within boxes), 25th and 75th percentiles (lower and upper edge of the boxes), and minimum and maximum values (antennae).
Aggregate PARD was 7.3% (n = 96,430), improving from 11.6% on day 1 to 5.2% on day 7 (Figure 3). Compared with the euglycemic and hyperglycemic ranges (7.3% and 5.0%, respectively), the aggregate PARD was higher in the hypo-glycemic range (14.2%).
Figure 3.
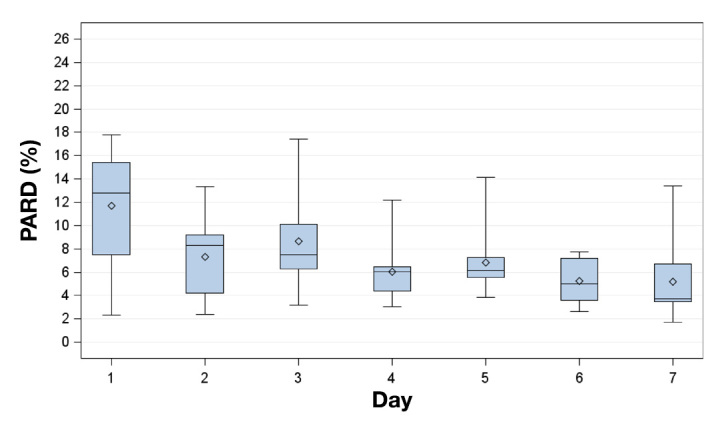
Box plot for PARD on successive study days. Displayed are mean (diamonds), median (horizontal lines within boxes), 25th and 75th percentiles (lower and upper edge of the boxes), and minimum and maximum values (antennae).
The EGA yielded 76.3%, 22.3%, 0.0%, 1.3%, and 0.0% of paired measurement results in zones A, B, C, D, and E, respectively (n = 2392; Figure 4).
Figure 4.
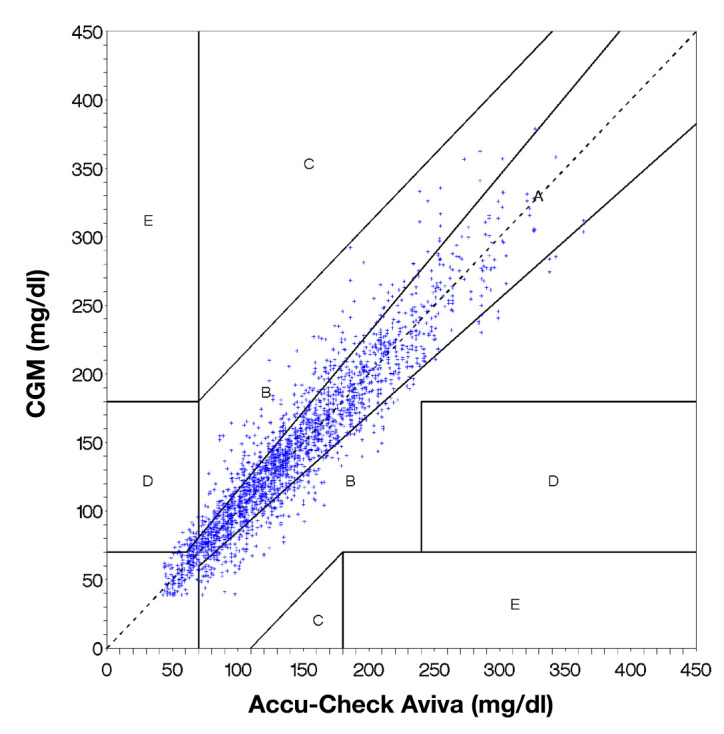
Clarke EGA of the paired values obtained with a CGM system (Dexcom G4) and a reference measurement with a BG meter (ACCU-CHEK Aviva). Clinically accurate or acceptable readings are represented by dots in the zones A and B.
Cumulative percentage of CGM readings within 5%, 10%, 20%, and 30% deviation of the capillary BG readings are provided in Table 2. In the low glucose range (<70 mg/dl), the percentage of readings <5% and <10% deviation was markedly smaller than for the higher glucose ranges. However, the percentage of readings within 30% deviation was only slightly smaller compared with the other ranges.
Table 2.
Cumulative Percentage of Continuous Glucose Monitoring Readings within 5%, 10%, 20%, and 30% Deviation of Capillary Blood Glucose Readingsa
| Within 5% | Within 10% | Within 20% | Within 30% | |
|---|---|---|---|---|
| Overall | 32.0% | 58.4% | 85.6% | 94.5% |
| <70 mg/dl | 21.0% | 46.2% | 77.6% | 91.0% |
| 70–180 mg/dl | 31.6% | 56.8% | 83.7% | 93.8% |
| >180 mg/dl | 37.8% | 68.2% | 94.8% | 98.1% |
Displayed are results for complete experiments.
Induced Glucose Excursions
The MARD during induced glucose excursions (17.0%) was higher than for the complete experiments (11.0%), while the PARD was only slightly higher (9.3% versus 7.3%).
High rates of change of glycemia were observed during induced glucose excursions. A total of 12% of rates of change of glycemia were <-3 or >3 mg/dl/min, and 45% were between −1 and 1 mg/dl/min (Figure 5).
Figure 5.
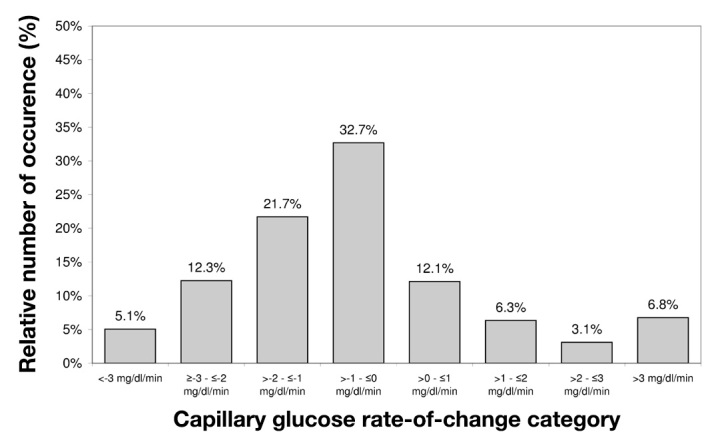
Histogram of capillary BG rates of change during induced glucose excursions. Blood glucose measurements were performed every 15 min (n = 743).
Discussion
In a clinical setting similar to daily life, in which parts of the recommendations of Clinical and Laboratory Standards Institute guideline POCT05-A were incorporated, the CGM system investigated showed good performance. The overall MARD and PARD results obtained are comparable or lower (i.e., better) than what is reported for other CGM systems.7–15,17,21–23 Continuous glucose monitoring performance often was reported to be poor in the low glucose range.8,10,12,17,19,23 For G4, however, the MARD was only slightly worse (i.e., higher) than in the other concentration ranges, and it was markedly lower than that of other CGM devices.8,13,17,27 When compared with three CGM systems investigated in a very similar setting [the G4’s predecessor SEVEN® Plus system (Dexcom, San Diego, CA), FreeStyle Navigator™ (Abbott Diabetes Care, Alameda, CA), and Guardian® REAL-Time (Medtronic MiniMed, Northridge, CA)],27 an improved performance can be noted. Apart from induced glucose excursions, where the G4’s performance was similar to that of the SEVEN Plus, the G4 shows markedly better performance than its predecessor. Compared with the FreeStyle Navigator, the G4’s performance is worse in the induced glucose excursions but much better in the hypoglycemic range. In comparison with the Guardian REAL-Time system, the G4 shows better performance in all parameters analyzed.
Comparing CGM readings with capillary BG readings obtained with a SMBG meter is common for assessment of CGM performance, although this does not allow the assessment of absolute CGM performance, only performance relative to the SMBG. Additionally, the results are influenced by a composition of errors inherent to the SMBG meter and errors inherent to the CGM meter. The SMBG measurements were performed at least in duplicate to minimize the influence of SMBG meter errors.
The improved performance of this CGM system in the hypoglycemic range is of clinical relevance as it enables a more reliable detection of low glucose values. Based on the improved accuracy and precision in the hypoglycemic range, it is likely that the number of false positive and false negative alarms is reduced compared with other devices. It also allows more reliable performance when used in an artificial pancreas system.23
Improving measurement performance of the CGM system during the usage period (i.e., the MARD and PARD decreased over the course of the study) is a finding that was also observed with its predecessor system and other CGM systems.13,22,27
In a more clinically oriented analysis, the EGA, evaluation of the G4’s performance resulted in a high number of acceptable measurement results; these data are comparable with or slightly better than what is reported for other CGM systems.8,13,14,17,18,21–23,27–29
Results from the induced glucose excursions show that the sensor-to-sensor differences in the parameters calculated to describe CGM system performance were more or less similar to those of the complete experiments. However, the CGM-to-BG differences were higher. This is consistent with time lag, composed of physiological lag, caused by measuring in two different compartments, and technical lag, i.e., time lost in the CGM system between measurement and display of glucose values. When comparing the G4 system’s results with the performance of other CGM systems during similar induced glucose excursions,27 the technical lag of the G4 system seems to be more pronounced, as the physiological lag presumably is similar.
Conclusions
In conclusion, the G4 CGM system showed good and reliable MARD and PARD results, both in comparison with other commercially available CGM systems and with its predecessor. For hyperglycemia and euglycemia, the G4 system achieved similar results in comparison with other systems, whereas during induced glucose excursions, the MARD was similar or slightly worse than what is reported for other CGM systems. In the low BG range, in which the performance of other CGM systems is worse when compared with higher glycemic ranges, the G4 also showed good performance.
Acknowledgments
We thank Prof. Dr. Lutz Heinemann and Dr. Volker Lodwig for their valuable input.
Glossary
- (BG)
blood glucose
- (CGM)
continuous glucose monitoring
- (EGA)
error grid analysis
- (MARD)
mean absolute relative difference
- (PARD)
precision absolute relative difference
- (SMBG)
self-monitoring of blood glucose
Funding
This study was funded by a grant from Roche Diagnostics GmbH, Mannheim, Germany. Scientific writing was supported by Roche Diagnostics GmbH, Mannheim, Germany.
Disclosures
Guido Freckmann is general manager of the Institute for Diabetes Technology Research and Development GmbH at Ulm University, which performs studies evaluating BG meters and medical devices for diabetes therapy on behalf of various companies. Guido Freckmann/the Institute for Diabetes Technology Research and Development GmbH at Ulm University has received speakers’ honoraria from Abbott, Bayer, Berlin Chemie, Roche Diagnostics, Ypsomed, and Sanofi. Hans-Martin Klötzer was contracted by Roche Diagnostics, Germany, to perform data evaluations for this study.
References
- 1.Bergenstal RM, Tamborlane WV, Ahmann A, Buse JB, Dailey G, Davis SN, Joyce C, Peoples T, Perkins BA, Welsh JB, Willi SM, Wood MA, STAR 3 Study Group Effectiveness of sensor-augmented insulin-pump therapy in type 1 diabetes. N Engl J Med. 2010;363(4):311–320. doi: 10.1056/NEJMoa1002853. [DOI] [PubMed] [Google Scholar]
- 2.Bergenstal RM, Tamborlane WV, Ahmann A, Buse JB, Dailey G, Davis SN, Joyce C, Perkins BA, Welsh JB, Willi SM, Wood MA; STAR 3 Study Group Sensor-augmented pump therapy for A1C reduction (STAR 3) study: Results from the 6-month continuation phase. Diabetes Care. 2011;34(11):2403–2405. doi: 10.2337/dc11-1248. [DOI] [PMC free article] [PubMed] [Google Scholar]
- 3.Danne T, Kordonouri O, Holder M, Haberland H, Golembowski S, Remus K, Blasig S, Wadien T, Zierow S, Hartmann R, Thomas A. Prevention of hypoglycemia by using low glucose suspend function in sensor-augmented pump therapy. Diabetes Technol Ther. 2011;13(11):1129–1134. doi: 10.1089/dia.2011.0084. [DOI] [PubMed] [Google Scholar]
- 4.Hermanides J, Norgaard K, Bruttomesso D, Mathieu C, Frid A, Dayan CM, Diem P, Fermon C, Wentholt IM, Hoekstra JB, DeVries JH. Sensor-augmented pump therapy lowers HbA(1c) in suboptimally controlled Type 1 diabetes; a randomized controlled trial. Diabet Med. 2011;28(10):1158–1167. doi: 10.1111/j.1464-5491.2011.03256.x. [DOI] [PubMed] [Google Scholar]
- 5.Block JM. Continuous glucose monitoring: changing diabetes behavior in real time and retrospectively. J Diabetes Sci Technol. 2008;2(3):484–489. doi: 10.1177/193229680800200320. [DOI] [PMC free article] [PubMed] [Google Scholar]
- 6.Clinical and Laboratory Standards Institute Performance metrics for continuous interstitial glucose monitoring; approved guideline. http://shopping.netsuite.com/c.1253739/site/Sample_pdf/POCT05A__sample.pdf. Accessed June 20, 2013. [Google Scholar]
- 7.Clarke WL, Anderson S, Farhy L, Breton M, Gonder-Frederick L, Cox D, Kovatchev B. Evaluating the clinical accuracy of two continuous glucose sensors using continuous glucose-error grid analysis. Diabetes Care. 2005;28(10):2412–2417. doi: 10.2337/diacare.28.10.2412. [DOI] [PubMed] [Google Scholar]
- 8.Weinstein RL, Schwartz SL, Brazg RL, Bugler JR, Peyser TA, McGarraugh GV. Accuracy of the 5-day FreeStyle Navigator Continuous Glucose Monitoring System: comparison with frequent laboratory reference measurements. Diabetes Care. 2007;30(5):1125–1130. doi: 10.2337/dc06-1602. [DOI] [PubMed] [Google Scholar]
- 9.Wilson DM, Beck RW, Tamborlane WV, Dontchev MJ, Kollman C, Chase P, Fox LA, Ruedy KJ, Tsalikian E, Weinzimer SA, DirecNet Study Group The accuracy of the FreeStyle Navigator continuous glucose monitoring system in children with type 1 diabetes. Diabetes Care. 2007;30(1):59–64. doi: 10.2337/dc06-1407. [DOI] [PMC free article] [PubMed] [Google Scholar]
- 10.Mastrototaro J, Shin J, Marcus A, Sulur G, STAR 1 Clinical Trial Investigators The accuracy and efficacy of real-time continuous glucose monitoring sensor in patients with type 1 diabetes. Diabetes Technol Ther. 2008;10(5):385–390. doi: 10.1089/dia.2007.0291. [DOI] [PubMed] [Google Scholar]
- 11.Diabetes Research in Children Network (DirecNet) Study Group The accuracy of the Guardian RT continuous glucose monitor in children with type 1 diabetes. Diabetes Technol Ther. 2008;10(4):266–272. doi: 10.1089/dia.2007.0279. [DOI] [PMC free article] [PubMed] [Google Scholar]
- 12.Kovatchev B, Anderson S, Heinemann L, Clarke W. Comparison of the numerical and clinical accuracy of four continuous glucose monitors. Diabetes Care. 2008;31(6):1160–1164. doi: 10.2337/dc07-2401. [DOI] [PMC free article] [PubMed] [Google Scholar]
- 13.Zisser HC, Bailey TS, Schwartz S, Ratner RE, Wise J. Accuracy of the SEVEN continuous glucose monitoring system: comparison with frequently sampled venous glucose measurements. J Diabetes Sci Technol. 2009;3(5):1146–1154. doi: 10.1177/193229680900300519. [DOI] [PMC free article] [PubMed] [Google Scholar]
- 14.Bailey T, Zisser H, Chang A. New features and performance of a next-generation SEVEN-day continuous glucose monitoring system with short lag time. Diabetes Technol Ther. 2009;11(12):749–755. doi: 10.1089/dia.2009.0075. [DOI] [PubMed] [Google Scholar]
- 15.Kamath A, Mahalingam A, Brauker J. Analysis of time lags and other sources of error of the Dexcom SEVEN continuous glucose monitor. Diabetes Technol Ther. 2009;11(11):689–695. doi: 10.1089/dia.2009.0060. [DOI] [PubMed] [Google Scholar]
- 16.Nielsen JK, Freckmann G, Kapitza C, Ocvirk G, Koelker KH, Kamecke U, Gillen R, Amann-Zalan I, Jendrike N, Christiansen JS, Koschinsky T, Heinemann L. Glucose monitoring by microdialysis: performance in a multicentre study. Diabet Med. 2009;26(7):714–721. doi: 10.1111/j.1464-5491.2009.02750.x. [DOI] [PubMed] [Google Scholar]
- 17.Garg SK, Smith J, Beatson C, Lopez-Baca B, Voelmle M, Gottlieb PA. Comparison of accuracy and safety of the SEVEN and the Navigator continuous glucose monitoring systems. Diabetes Technol Ther. 2009;11(2):65–72. doi: 10.1089/dia.2008.0109. [DOI] [PubMed] [Google Scholar]
- 18.Valgimigli F, Lucarelli F, Scuffi C, Morandi S, Sposato I. Evaluating the clinical accuracy of GlucoMen®Day: a novel microdialysis-based continuous glucose monitor. J Diabetes Sci Technol. 2010;4(5):1182–1192. doi: 10.1177/193229681000400517. [DOI] [PMC free article] [PubMed] [Google Scholar]
- 19.Morrow L, Hompesch M, Tideman AM, Matson J, Dunne N, Pardo S, Parkes JL, Schachner HC, Simmons DA. Evaluation of a novel continuous glucose measurement device in patients with diabetes mellitus across the glycemic range. J Diabetes Sci Technol. 2011;5(4):853–859. doi: 10.1177/193229681100500406. [DOI] [PMC free article] [PubMed] [Google Scholar]
- 20.Adolfsson P, Ornhagen H, Eriksson BM, Cooper K, Jendle J. Continuous glucose monitoring--a study of the Enlite sensor during hypo- and hyperbaric conditions. Diabetes Technol Ther. 2012;14(6):527–532. doi: 10.1089/dia.2011.0284. [DOI] [PubMed] [Google Scholar]
- 21.Facchinetti A, Sparacino G, Guerra S, Luijf YM, DeVries JH, Mader JK, Ellmerer M, Benesch C, Heinemann L, Bruttomesso D, Avogaro A, Cobelli C, AP@home Consortium Real-time improvement of continuous glucose monitoring accuracy: the smart sensor concept. Diabetes Care. 2013;36(4):793–800. doi: 10.2337/dc12-0736. [DOI] [PMC free article] [PubMed] [Google Scholar]
- 22.Luijf YM, Avogaro A, Benesch C, Bruttomesso D, Cobelli C, Ellmerer M, Heinemann L, Mader JK, DeVries JH, AP@home Consortium Continuous glucose monitoring accuracy results vary between assessment at home and assessment at the clinical research center. J Diabetes Sci Technol. 2012;6(5):1103–1106. doi: 10.1177/193229681200600514. [DOI] [PMC free article] [PubMed] [Google Scholar]
- 23.Zijlstra E, Heise T, Nosek L, Heinemann L, Heckermann S. Continuous glucose monitoring: quality of hypoglycaemia detection. Diabetes Obes Metab. 2013;15(2):130–135. doi: 10.1111/dom.12001. [DOI] [PubMed] [Google Scholar]
- 24.Damiano ER, El-Khatib FH, Zheng H, Nathan DM, Russell SJ. A comparative effectiveness analysis of three continuous glucose monitors. Diabetes Care. 2013;36(2):251–259. doi: 10.2337/dc12-0070. [DOI] [PMC free article] [PubMed] [Google Scholar]
- 25.Obermaier K, Schmelzeisen-Redeker G, Schoemaker M, Kloetzer HM, Kirchsteiger H, Eikmeier H. Performance evaluations of continuous glucose monitoring systems: precision absolute relative difference is part of the assessment. J Diabetes Sci Technol. 2013;7(4):824–832. doi: 10.1177/193229681300700404. [DOI] [PMC free article] [PubMed] [Google Scholar]
- 26.Clarke WL, Cox D, Gonder-Frederick LA, Carter W, Pohl SL. Evaluating clinical accuracy of systems for self-monitoring of blood glucose. Diabetes Care. 1987;10(5):622–628. doi: 10.2337/diacare.10.5.622. [DOI] [PubMed] [Google Scholar]
- 27.Freckmann G, Pleus S, Link M, Zschornack E, Klötzer HM, Haug C. Performance evaluation of three continuous glucose monitoring systems: comparison of six sensors per subject in parallel. J Diabetes Sci Technol. 2013;7(4):842–853. doi: 10.1177/193229681300700406. [DOI] [PMC free article] [PubMed] [Google Scholar]
- 28.Garg S, Zisser H, Schwartz S, Bailey T, Kaplan R, Ellis S, Jovanovic L. Improvement in glycemic excursions with a transcutaneous, real-time continuous glucose sensor: a randomized controlled trial. Diabetes Care. 2006;29(1):44–50. doi: 10.2337/diacare.29.01.06.dc05-1686. [DOI] [PubMed] [Google Scholar]
- 29.Garg S, Jovanovic L. Relationship of fasting and hourly blood glucose levels to HbA1c values: safety, accuracy, and improvements in glucose profiles obtained using a 7-day continuous glucose sensor. Diabetes Care. 2006;29(12):2644–2649. doi: 10.2337/dc06-1361. [DOI] [PubMed] [Google Scholar]