

Abstract
Background
Developing a round-the-clock artificial pancreas requires accurate and stable continuous glucose monitoring. The most widely used continuous glucose monitors (CGMs) are percutaneous, with the sensor residing in the interstitial space. Inaccuracies in percutaneous CGM readings during periods of lying on the devices (e.g., in various sleeping positions) have been anecdotally reported but not systematically studied.
Methods
In order to assess the impact of sleep and sleep position on CGM performance, we conducted a study in human subjects in which we measured the variability of interstitial CGM data at night as a function of sleeping position. Commercially available sensors were placed for 4 days in the abdominal subcutaneous tissue in healthy, nondiabetic volunteers (four sensors per person, two per side). Nocturnal sleeping position was determined from video recordings and correlated to sensor data.
Results
We observed that, although the median of the four sensor readings was typically 70–110 mg/dl during sleep, individual sensors intermittently exhibited aberrant glucose readings (>25 mg/dl away from median) and that these aberrant readings were strongly correlated with subjects lying on the sensors. We expected and observed that most of these aberrant sleep-position-related CGM readings were sudden decreases in reported glucose values, presumably due to local blood-flow decreases caused by tissue compression. Curiously, in rare cases, the aberrant CGM readings were elevated values.
Conclusions
These findings highlight limitations in our understanding of interstitial fluid physiology in the subcutaneous space and have significant implications for the utilization of sensors in the construction of an artificial pancreas.
Keywords: blood flow, continuous glucose monitor, night time hypoglycemia, nocturnal hypoglycemia, pressure, sleep
Introduction
Patients with type 1 diabetes mellitus (T1DM) will experience dramatic improvements in their quality of life and life expectancy when therapies for tight glycemic control are perfected. Advances in glucose sensing and insulin delivery have led to trials of glucose-control systems (artificial pancreas), including some closed-loop implementations. Although continuous glucose monitoring has been shown to improve glycemic control in patients with T1DM,1 a particular challenge for this technology is during sleep, when T1DM patients undergoing aggressive insulin therapy can experience dramatic and prolonged episodes of hypoglycemia. Some of these episodes can cause cognitive impairment, seizure, coma, or even death. Even nocturnal hypoglycemia (NH) episodes that are asymptomatic2–5 can increase the risk of long-term sequelae such as cognitive impairment and subsequent severe episodes.6–8 Serious NH episodes occur at a significant rate among T1DM patients, and there are some data to suggest that the rate and duration of these episodes may be higher among younger patients.5
Nocturnal hypoglycemia is particularly dangerous because autonomic dysfunction in T1DM can prevent diabetes patients from waking up during these episodes.9,10 Severe NH can be deadly (so-called “dead-in-bed” syndrome).11 Continuous glucose monitors (CGMs) have the potential to mitigate the risks of NH, (1) by providing real-time data that enables triggering of alarms to wake patients in order to address the low glucose levels; (2) by providing retrospective data on nighttime glucose levels (and thus identifying patients most at risk); and, ultimately, (3) by serving as the sensory component of an artificial pancreas that achieves euglycemia during sleep as well as wakefulness.1,12–16 Current CGMs, however, have a high rate of false alarms (25–61%),17–19 thus conditioning some patients to have the tendency to ignore alarms. Even while using CGMs, patients may not respond to alarms and may experience severe episodes of NH, which may result in seizures.20,21
There are specific examples in the literature of CGM performance being affected by both prolonged and transient pressure.22 As biomechanical forces are applied to the sensor, sensor output can be altered because of physiological changes in the tissue as it reacts to the pressure.23 Studies in healthy, nondiabetic children support the reports of sensor inaccuracies toward hypoglycemic readings, particularly at night.24–26 Transient CGM sensor inaccuracy at night has also been reported in patients with diabetes4,27 but has not been studied systematically with respect to sleeping position in order to disambiguate this effect from other nocturnal influences on interstitial glucose concentrations physiology.
Our hypothesis is that normal body-position changes that occur during sleep result in the application of prolonged pressure to interstitial sensors, which induces physiological changes in the interstitial space (e.g., decreased local tissue perfusion, decreases in local oxygen tension, increases in temperature) and results in inaccurate sensor readings. In this study, we tracked nocturnal sleeping position throughout the night and made systematic comparisons to glucose measurements made with commercially available interstitial CGM sensors.
Methods
We performed a naturalistic sleep study in four nondiabetic nonobese (body mass index 20–27) adult male volunteers, using a protocol approved by an external institutional review board. Subjects all had fasting glucose levels between 70 and 100 mg/dl and were also nondiabetic at follow-up 2 years after the conduct of this study. Commercially available wireless Dexcom Seven sensors were placed for 4 days and 4 nights in the abdominal subcutaneous tissue, using standard clinical technique for sensor placement. Each subject was implanted with quadruplicate sensors at the suprailiac site (two on the left side, two on the right; for each side, there was a “top” sensor placed 8 cm above the “bottom” sensor). Each sensor transmitted interstitial-space glucose estimates every 5 min. Calibrations were made according to the manufacturer instructions by obtaining capillary blood samples using the OneTouch Ultra 2 glucose meter. Starting 48 h after placement (to allow time for sensor wetting), complete nocturnal sleep sessions were video recorded, and the sleeping positions of the subjects for each night were transcribed at 5 min intervals by raters reviewing and annotating the videotapes. Raters were blind to sensor readings and categorized each position as being either supine, prone, on right side, or on left side.
Results
During sleep sessions, the median of the four sensor readings was fairly stable throughout the nights (Figure 1), staying within the range of normal blood glucose levels (70–110 mg/dl) consistent with healthy homeostasis of blood glucose levels in the fasting state in nondiabetic adults. By contrast, the reading from each individual sensor occasionally exhibited substantial deviations from the stable median, lasting for up to 90 min. Figure 2 shows the data from all four sensors in a subject during a complete night of sleep. Twice in this sleep session, the lower left sensor exhibited a downward excursion of ∼40 mg/dl compared with the other sensors, lasting for 30–60 min. Later in the night, the upper left sensor behaved in a similar manner, to a lesser degree. In both cases, the excursions began at the beginning of the subject sleeping on the same side as the sensor (left) and returned toward the values of the other sensors after the subject changed to the supine position.
Figure 1.
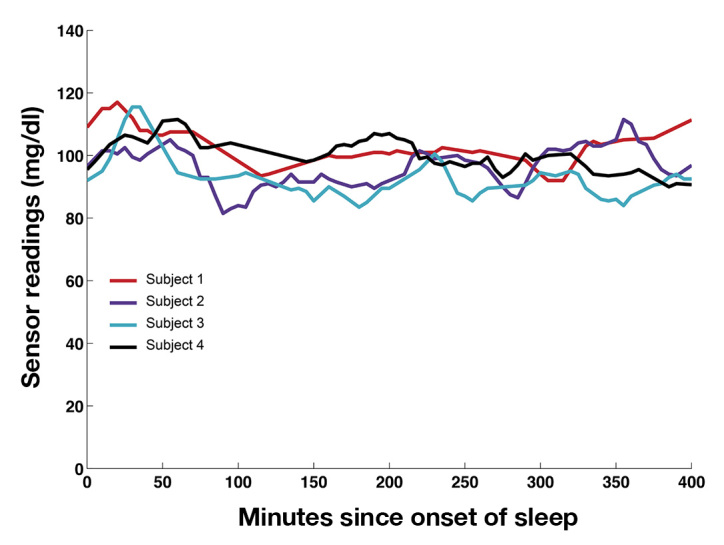
Median glucose readings of all four sensors in each subject on the second night of sleep. Data were collected and are displayed in 5 min intervals (see Methods). The global mean across all sensor recordings and all nights for the entire study was 87 mg/dl.
Figure 2.
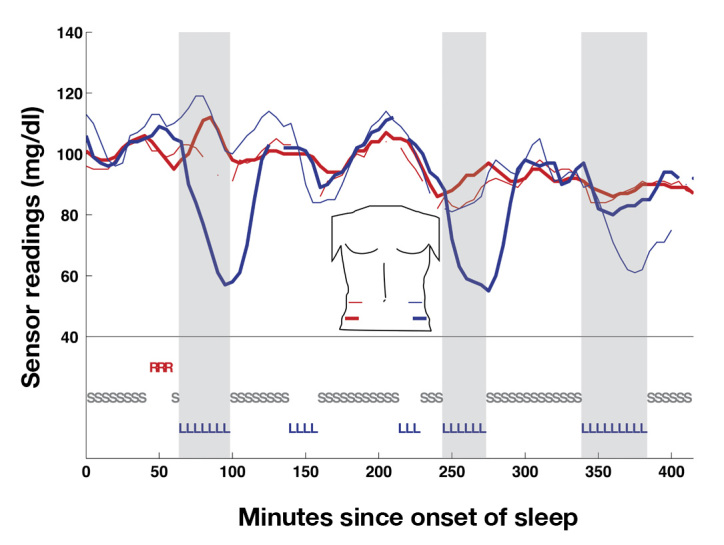
Sensor readings and sleep position for a complete night of sleep (subject 2, night 1). Sleep position is indicated on the bottom (R, sleeping on right side; L, left side; S, supine). Sensors are color-labeled similarly, as per the torso map in the center (red = right, left = blue, with the bold curve indicating the bottom sensor of the pair on that side and the thin curve indicating the top sensor, e.g., red bold is right bottom). Note, three excursions of >20 mg/dl in the left-sided sensors were associated with sleeping on the left side (gray zones). No excursions of equivalent magnitude were associated with other sleeping positions. Gaps in the curves indicate that the receiver for that sensor did not receive a signal during that time period.
Large upward excursions were also observed. Figure 3 illustrates upward excursions (from a different subject) also associated with sleeping on the side of the sensor.
Figure 3.
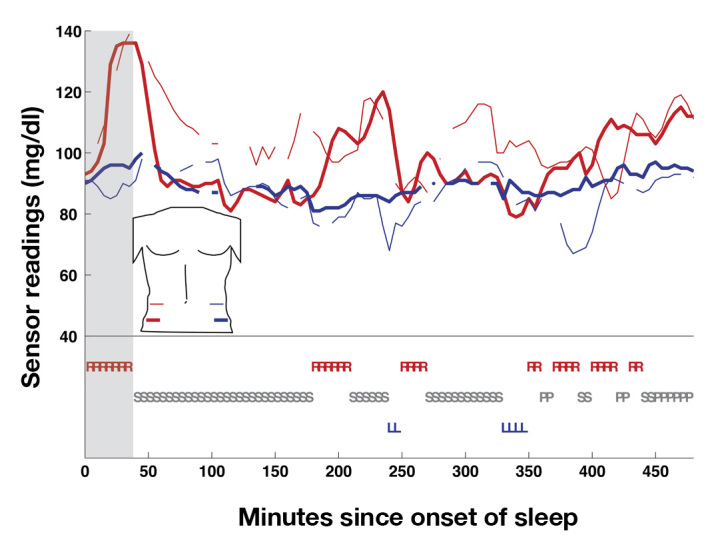
Sensor readings and sleep position for a complete night of sleep (subject 3, night 2). Sleep position and sensors are labeled as in Figure 2. Note, a large upward excursion on both right-sided sensors is associated with sleeping on the right side (gray zone). R, sleeping on right side; L, left side; S, supine; P, prone.
Two lines of analysis were performed on the full data set. In one line, for each time point (at 5 min intervals; see Methods), we looked at each sensor’s readings compared with the median of the other three sensors in the same subject. “Median of the other three sensors” was chosen as the most stable comparison measure for an individual sensor, because this statistic is insensitive to one of the other three sensors also exhibiting an aberrant reading at the same time point (which would not be true for “mean of the other three sensors”). This line of analysis was used in Figure 4 and Tables 1 and 2 (described later). In the second line of analysis (used in Figure 5), no such definitions were applied—instead sensor readings were analyzed with respect to each other in a non-parametric fashion.
Figure 4.
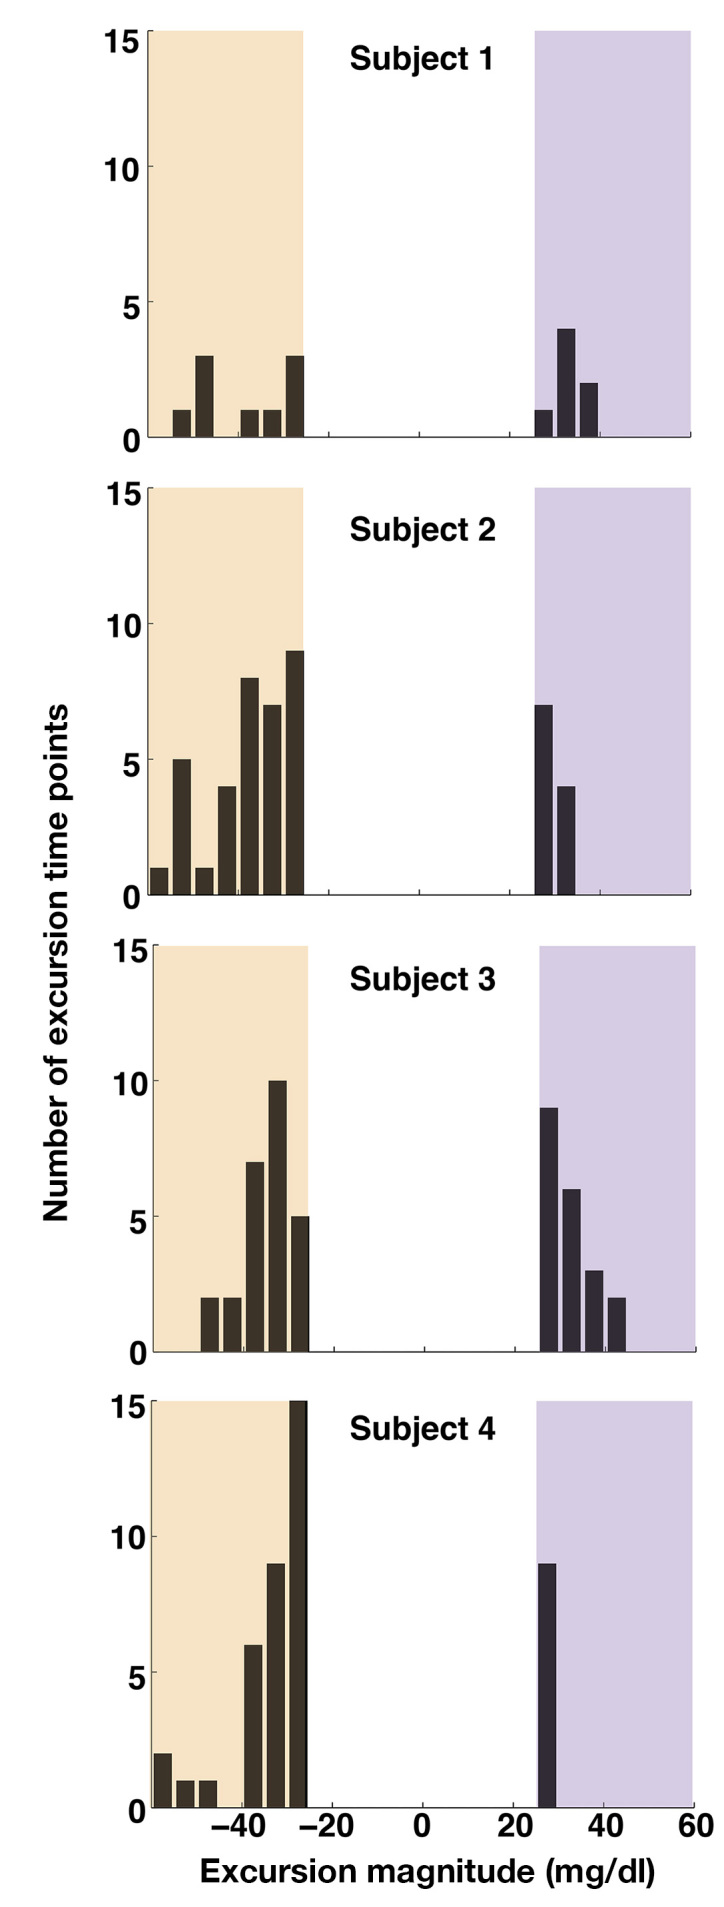
Prevalence of excursions of subcutaneous CGM readings on a subject-by-subject basis. As in Figures 1–3, the raw data analyzed was at 5 min intervals. For each time point, any sensor reading more than 25 mg/dl away from the median of the other three sensors was tabulated into the histograms shown. Excursions of greater than +25 mg/dl (violet zone, on the right of each distribution) indicate aberrantly high readings, where negative excursions (tan zone, on the left of each distribution) indicate aberrantly low readings. For each subject, data from all three nights of sleep are included. Bins are 5 mg/dl wide.
Table 1.
Relationship between Side (Left/Right) of Sleep Position and Excursion of a Sensor >25 mg/dl from the Median of the Other Three Sensors
| No excursion | Excursion of left-sided sensor | Excursion of right-sided sensor | |
|---|---|---|---|
| Sleeping on neither left nor right | 229a | 27 | 15 |
| Sleeping on left | 173 | 56 | 10 |
| Sleeping on right | 143 | 23 | 18 |
| Total | 545 | 106 | 43 |
All data were collected in 5 min intervals. Numbers shown are total number of data points observed for each condition out of all sleep sessions in all subjects.
Table 2.
Relationship between Side (Left/Right) of Sleep Position and Excursion of a Sensor >35 mg/dl from the Median of the Other Three Sensors
| No excursion | Excursion of left-sided sensor | Excursion of right-sided sensor | |
|---|---|---|---|
| Sleeping on neither left nor right | 259a | 9 | 1 |
| Sleeping on left | 208 | 22 | 1 |
| Sleeping on right | 168 | 6 | 6 |
| Total | 635 | 37 | 8 |
All data were collected in 5 min intervals. Numbers shown are total number of data points observed for each condition out of all sleep sessions in all subjects.
Figure 5.
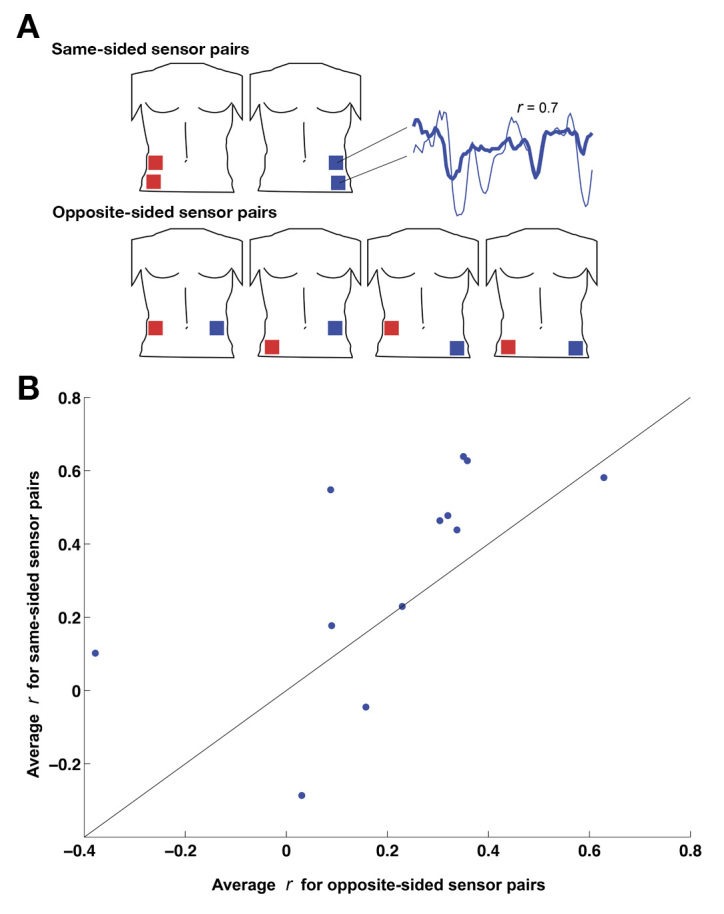
Comparison of correlation coefficients between same-sided sensor pairs and opposite-sided sensor pairs. (A) For each night of sleep in each subject, correlation coefficients were computed for all permutations of sensor pairs, as follows. The six possible permutations were divided into “same-sided” pairs (top left and bottom left, top right and bottom right, depicted in the top part of A) and “opposite-sided” pairs (top left and top right, top left and bottom right, bottom left and top right, bottom left and bottom right, depicted in the bottom part of A). For each pair, the correlation coefficient between the two sensors in the pair was computed for the entire night of sleep, as a measure of their tendency to increase and decrease together throughout the night (see inset at right). (B) Each data point represents one night of sleep in one subject: its x-axis value is the average of the four correlation coefficients from the four opposite-sided sensor pairs, and its y-axis value is the average of the two correlation coefficients from the two same-sided sensor pairs. Points above/left of the diagonal line indicate sleep sessions in which the same-sided sensors were more correlated with each other than the opposite-sided sensors. Points below/left of the diagonal indicate the converse.
Looking across the complete data set, we observed that individual sensors commonly exhibited large excursions away from the readings of the other three. Of the 16 sensors placed in the four subjects, 14 of them exhibited excursions of greater than 25 mg/dl; 25 mg/dl was chosen as an initial “excursion threshold” for the first analysis because an aberrant reading of that magnitude would be significant for artificial pancreas applications (for example, in the ASPIRE study,28 insulin delivery was paused for 2 h whenever a glucose reading below 70 mg/dl was recorded—given our global mean of 87 mg/dl, a 25 mg/dl excursion downward would typically trip this 70 mg/dl threshold). However, analyses were also performed with an excursion threshold of 35 mg/dl instead, as well as nonparametrically (both presented later), and none of the conclusions were dependent on the choice of this threshold. Excursions of greater than 25 mg/dl in both the positive and the negative directions were observed in all four subjects (Figure 4). Across all sleep sessions, we observed 149 sensor excursion time points greater than 25 mg/dl compared with 545 time points with no excursions (Table 1, bottom row), indicating that individual sensor excursions occurred quite commonly (21% of all time points).
Sensor excursions were strongly correlated with sleeping on the side of the sensor. For example when not sleeping on the left side, left-sided sensor excursions occurred for 13.4% of time points (50 out of 372; Table 1, rows 1 and 3), whereas when sleeping on the left side, left-sided sensor excursions occurred for 32.4% of time points (56 out of 173; Table 1, row 2). Using Fisher’s exact test on the contingency table, this correlation is significant (p < .001). Correspondingly, right-sided sensor excursions were much more common when sleeping on the right side [18 out of 143 (12.6%) time points] than when not sleeping on the right side [25 out of 402 (6.2%) time points; p < .001].
Analyzing the data instead with a higher “excursion threshold” of 35 mg/dl, 10 of the 16 sensors (and at least one in each subject) still exhibited excursions during the experiment. Correlation of these larger excursions with sleep position was even stronger, as indicated in Table 2. The correlations between sleep position and sensor excursions were not perfect—for example, for some time points, the excursed sensor was on the opposite side relative to sleep position. In many cases, this occurred during the recovery phase of an excursion, in which the subject switched sleeping position (rapidly, relative to the 5 min sampling time) but the excursed sensor took 15–30 min to return to baseline.
In a separate line of analysis, we took advantage of the simple assumption that an ideal CGM should provide accurate estimates of blood glucose independent of sensor location. Because we were collecting data from four sensors, we assessed local/lateral effects by looking at all pairwise intersensor correlations. The null hypothesis of ideal CGM performance would predict that intersensor correlations would not depend on how close together the two sensors are. Permuting across four sensors yields six unique sensor pairs. Two of these pairs (top left/bottom left and top right/bottom right) are same sided, and the remaining four are translateral (see Figure 5A). Looking at all readings from individual sleep sessions, same-sided pairs were more correlated (n = 24 sleep-session pairs; mean r = 0.33 ± 0.07 standard error of the mean) than opposite-sided pairs (n = 48; mean r = 0.21 ± 0.05 standard error of the mean). In Figure 5B, we condensed this comparison into a single data point for each sleep session by averaging the correlation coefficients from the two same-sided pairs and comparing this with the average of the correlation coefficients from the four opposite-sided pairs. The majority of the points falling above the line indicates that the sensors on the same side of the body are more correlated with each other (p < .02, Wilcoxon signed-rank test) than opposite-sided sensor pairs.
Discussion
The present results confirm our hypothesis of subcutaneous CGM vulnerability during normal sleep behavior. Specifically, we found that subcutaneous sensors were particularly vulnerable to significant excursions from baseline, both upward and downward, especially when the subject’s sleep position coincided with the location of the sensor. These findings confirm and extend anecdotal reports of inaccurate sensor performance due to pressure applied to the sensor and surrounding tissue during sleep. Much of the prior testing of artificial pancreas systems for nocturnal glucose control has been conducted in hospitalized patients,29,30 which may bias against sensor inaccuracies due to pressure on the sensor. In nonhospitalized patients, normal daily living activities can cause significant changes in blood flow, for example, an increase in pressure at the beltline, which can in turn lead to sensor inaccuracies.19,31 Such pressure can usually be avoided during waking hours (at some inconvenience to the patient), but during sleep, it is inevitable that a sensor will have pressure applied to it intermittently throughout the night.
What are the potential mechanisms of sensor inaccuracies during sleep? Laying on subcutaneous CGMs may cause pressure-induced or temperature-induced physiological fluctuations. Interstitial glucose sensors rely on adequate blood flow to the interstitial space for accurate measurement. Further, interstitial glucose sensors are sensitive to oxygen tension in the interstitial space; fluctuations in oxygen tension can affect the accuracy of the sensor.32 Finally, in vivo testing has also demonstrated that temperature has a profound impact on both subcutaneous oxygen tension and sensor output current.33,34 Pressure applied to tissue in the immediate vicinity of a sensor may decrease blood flow and oxygen tension and increase temperature, resulting in the CGM inaccuracies observed in the present study. Specifically, decreased blood flow to the capillaries immediately surrounding the sensing electrode is expected to depress CGM readings because of reduced glucose diffusion into the sensing area. Decreased oxygen availability in the tissue will also depress CGM readings due to the oxygen dependency of the enzymatic conversion of glucose via glucose oxidase. Warming of the area due to laying on the CGM will likely have the opposite effect and increase sensor signals. Clearly, CGM readings are influenced by multiple factors, including glucose and oxygen availability from the nearby vasculature, temperature, and other potential unidentified factors (e.g., temporary release of interfering substances during localized pressure or temperature, direct mechanical pressure on membrane elongation, or tension).
What are the implications of these large, transient inaccuracies of interstitial CGM during sleep, with respect to artificial pancreas technologies? If the interstitial space is to be used for the sensing location, the problem of sleep-position-related inaccuracies combined with NH in patients with T1DM would need to be addressed. Spuriously high CGM readings are particularly troubling for closed-loop implementations—the possibility that this could result in inappropriate insulin delivery would preclude use during sleep and thus disable tight round-the-clock glycemic control. For example, spuriously low CGM readings would compromise the performance of systems based on the automated suspension of insulin delivery during hypoglycemia,31 as, for example, in the MiniMed Veo system.
One solution to the problem highlighted by the present study would be to use multiple sensors combined with algorithms for excluding outlier sensors, as supported in a daytime study using multiple sensors.35 Multiple sensors would need to be separated widely from each other due to the tendency of nearby sensors to co-vary during sleep (shown in Figure 5); this approach may be unwieldy to the patient. With the rise of cheap and extraordinarily small microelectromechanical devices, pressure sensors could potentially be integrated into current CGM designs to help modify or exclude the sensor reading if excessive force were placed on the CGM. Mechanically protecting the sensor areas with additional devices (e.g., analogous to a hemorrhoid donut pillow) or other compensating elements could also be considered. An alternative approach to improving CGM performance would be to place the sensor in a location less susceptible to the fluctuating physiology of the periphery.
Although aberrations in CGM readings during sleep have been observed that significantly correlate with sleep position (lying on the sensor), it is important to note that aberrant excursion sometimes occurs during sleep even when the person is not lying on the sensor. The reason for these aberrations is unknown and may not be due to pressure on the sensor that interrupts blood flow.
One limitation of the present study is that only Dexcom sensors were tested, not Medtronic sensors. The findings of this study, however, are expected to be relevant to both commercial products because (1) they employ similar underlying technology (glucose-oxidase-based electrochemical needle-type electrodes); (2) they have similar performance characteristics and specifications, as indicated in their users’ manuals; and (3) they both reside subcutaneously and are thus susceptible to the physiological effects described earlier. For the latter reason, we would further expect our results to extend to other subcutaneously residing glucose-oxidase systems (e.g., the Freestyle Navigator system), although this is ultimately an empirical question.
Daytime sensor readings exhibited meal-related increases and returns to baseline. Because subjects were not fasting, the present study did not enable meaningful comparisons between daytime and nighttime variability. Meals add an additional variable—dynamic glucose responses—which can yield intersensor differences due to differences in lag time. These differences would not be separable from other daytime variables in order to make disambiguable comparisons with sleep data, which is instead characterized by stable blood glucose epochs. To make such comparisons, we are planning a follow-on study with subjects fasting for 8 h each day so that these fasting epochs can be compared with fasting sleep data.
Conclusions
Our data confirm that interstitial CGMs exhibit epochs of aberrant readings during sleep, and we demonstrate that much of this variability is related to sleeping on the sensor. These findings highlight the need for new strategies in glucose sensing technologies to minimize the risks of faulty CGM readings. To avoid the potential inaccuracies of sensing in the interstitial space, the ideal properties of an alternative sensing location would include excellent blood supply, stable core temperatures, and a proven safety profile based on a history of use with chronically indwelling medical devices for other medical conditions.
Glossary
- (CGM)
continuous glucose monitor
- (NH)
nocturnal hypoglycemia
- (T1DM)
type 1 diabetes mellitus
Funding
This work was funded by Theranova, LLC.
Disclosures
Brett Mensh and Daniel Burnett are employees of Theranova, LLC. Natalie Wisniewski is part of the executive team at Medical Device Consultancy and PROFUSA.
References
- 1.Juvenile Diabetes Research Foundation Continuous Glucose Monitoring Study Group. Tamborlane WV, Beck RW, Bode BW, Buckingham B, Chase HP, Clemons R, Fiallo-Scharer R, Fox LA, Gilliam LK, Hirsch IB, Huang ES, Kollman C, Kowalski AJ, Laffel L, Lawrence JM, Lee J, Mauras N, O’Grady M, Ruedy KJ, Tansey M, Tsalikian E, Weinzimer S, Wilson DM, Wolpert H, Wysocki T, Xing D. Continuous glucose monitoring and intensive treatment of type 1 diabetes. N Engl J Med. 2008;359(14):1464–1476. doi: 10.1056/NEJMoa0805017. [DOI] [PubMed] [Google Scholar]
- 2.DeVries JH, Wentholt IM, Masurel N, Mantel I, Poscia A, Maran A, Heine RJ. Nocturnal hypoglycaemia in type 1 diabetes--consequences and assessment. Diabetes Metab Res Rev. 2004;20(Suppl 2):S43–S46. doi: 10.1002/dmrr.513. [DOI] [PubMed] [Google Scholar]
- 3.Guillod L, Comte-Perret S, Monbaron D, Gaillard RC, Ruiz J. Nocturnal hypoglycaemias in type 1 diabetic patients: what can we learn with continuous glucose monitoring? Diabetes Metab. 2007;33(5):360–365. doi: 10.1016/j.diabet.2007.03.007. [DOI] [PubMed] [Google Scholar]
- 4.McGowan K, Thomas W, Moran A. Spurious reporting of nocturnal hypoglycemia by CGMS in patients with tightly controlled type 1 diabetes. Diabetes Care. 2002;25(9):1499–1503. doi: 10.2337/diacare.25.9.1499. [DOI] [PubMed] [Google Scholar]
- 5.Porter PA, Keating B, Byrne G, Jones TW. Incidence and predictive criteria of nocturnal hypoglycemia in young children with insulin-dependent diabetes mellitus. J Pediatr. 1997;130(3):366–372. doi: 10.1016/s0022-3476(97)70197-5. [DOI] [PubMed] [Google Scholar]
- 6.Cryer PE. The barrier of hypoglycemia in diabetes. Diabetes. 2008;57(12):3169–3176. doi: 10.2337/db08-1084. [DOI] [PMC free article] [PubMed] [Google Scholar]
- 7.The Diabetes Control and Complications Trial Research Group. Hypoglycemia in the Diabetes Control and Complications Trial. Diabetes. 1997;46(2):271–286. [PubMed] [Google Scholar]
- 8.Fanelli CG, Paramore DS, Hershey T, Terkamp C, Ovalle F, Craft S, Cryer PE. Impact of nocturnal hypoglycemia on hypoglycemic cognitive dysfunction in type 1 diabetes. Diabetes. 1998;47(12):1920–1927. doi: 10.2337/diabetes.47.12.1920. [DOI] [PubMed] [Google Scholar]
- 9.Banarer S, Cryer PE. Sleep-related hypoglycemia-associated autonomic failure in type 1 diabetes: reduced awakening from sleep during hypoglycemia. Diabetes. 2003;52(5):1195–1203. doi: 10.2337/diabetes.52.5.1195. [DOI] [PubMed] [Google Scholar]
- 10.Jones TW, Porter P, Sherwin RS, Davis EA, O’Leary P, Frazer F, Byrne G, Stick S, Tamborlane WV. Decreased epinephrine responses to hypoglycemia during sleep. N Engl J Med. 1998;338(23):1657–1662. doi: 10.1056/NEJM199806043382303. [DOI] [PubMed] [Google Scholar]
- 11.Tanenberg RJ, Newton Ca, Drake AJ. Confirmation of hypoglycemia in the “dead-in-bed” syndrome, as captured by a retrospective continuous glucose monitoring system. Endocr Pract. 2010;16(2):244–248. doi: 10.4158/EP09260.CR. [DOI] [PubMed] [Google Scholar]
- 12.Ahmet A, Dagenais S, Barrowman NJ, Collins CJ, Lawson ML. Prevalence of nocturnal hypoglycemia in pediatric type 1 diabetes: a pilot study using continuous glucose monitoring. J Pediatr. 2011;159(2):297–302. doi: 10.1016/j.jpeds.2011.01.064. [DOI] [PubMed] [Google Scholar]
- 13.Juvenile Diabetes Research Foundation Continuous Glucose Monitoring Study Group. Prolonged nocturnal hypoglycemia is common during 12 months of continuous glucose monitoring in children and adults with type 1 diabetes. Diabetes Care. 2010;33(5):1004–1008. doi: 10.2337/dc09-2081. [DOI] [PMC free article] [PubMed] [Google Scholar]
- 14.Mamkin I, Ten S, Bhandari S, Ramchandani N. Real-time continuous glucose monitoring in the clinical setting: the good, the bad, and the practical. J Diabetes Sci Technol. 2008;2(5):882–889. doi: 10.1177/193229680800200520. [DOI] [PMC free article] [PubMed] [Google Scholar]
- 15.Meschi F, Bonfanti R, Rigamonti A, Giulio F, Battaglino R, Viscardi M, Poscia A, Chiumello G. Patients’ evaluation of nocturnal hypoglycaemia with GlucoDay continuous glucose monitoring in paediatric patients. Acta Diabetol. 2010;47(4):295–300. doi: 10.1007/s00592-010-0181-9. [DOI] [PubMed] [Google Scholar]
- 16.Wentholt IM, Maran A, Masurel N, Heine RJ, Hoekstra JB, DeVries JH. Nocturnal hypoglycaemia in Type 1 diabetic patients, assessed with continuous glucose monitoring: frequency, duration and associations. Diabet Med. 2007;24(5):527–532. doi: 10.1111/j.1464-5491.2007.02107.x. [DOI] [PubMed] [Google Scholar]
- 17. Dexcom. Seven Plus Continuous Glucose Monitoring System user’s guide. 2011.
- 18. Medtronic. Guardian REAL-Time System user guide. 2012.
- 19. Abbott. Freestyle Navigator Continuous Glucose Monitoring System user’s guide. 2012.
- 20.Buckingham B, Caswell K, Wilson DM. Real-time continuous glucose monitoring. Curr Opin Endocrinol Diabetes Obes. 2007;14(4):288–295. doi: 10.1097/MED.0b013e32825a675e. [DOI] [PubMed] [Google Scholar]
- 21.Buckingham B, Cobry E, Clinton P, Gage V, Caswell K, Kunselman E, Cameron F, Chase HP. Preventing hypoglycemia using predictive alarm algorithms and insulin pump suspension. Diabetes Technol Ther. 2009;11(2):93–97. doi: 10.1089/dia.2008.0032. [DOI] [PMC free article] [PubMed] [Google Scholar]
- 22.Helton KL, Ratner BD, Wisniewski NA. Biomechanics of the sensor-tissue interface-effects of motion, pressure, and design on sensor performance and foreign body response-part II: examples and application. J Diabetes Sci Technol. 2011;5(3):647–656. doi: 10.1177/193229681100500318. [DOI] [PMC free article] [PubMed] [Google Scholar]
- 23.Helton KL, Ratner BD, Wisniewski NA. Biomechanics of the sensor-tissue interface-effects of motion, pressure, and design on sensor performance and the foreign body response-part I: theoretical framework. J Diabetes Sci Technol. 2011;5(3):632–646. doi: 10.1177/193229681100500317. [DOI] [PMC free article] [PubMed] [Google Scholar]
- 24.Mauras N, Beck RW, Ruedy KJ, Kollman C, Tamborlane WV, Chase HP, Buckingham BA, Tsalikian E, Weinzimer S, Booth AD, Xing D. Diabetes Research in Children Network (DirecNet) Accuracy Study Lack of accuracy of continuous glucose sensors in healthy, nondiabetic children: results of the Diabetes Research in Children Network (DirecNet) accuracy study. J Pediatr. 2004;144(6):770–775. doi: 10.1016/j.jpeds.2004.03.042. [DOI] [PMC free article] [PubMed] [Google Scholar]
- 25.Dassau E, Cameron F, Lee H, Bequette BW, Zisser H, Jovanovic L, Chase HP, Wilson DM, Buckingham BA, Doyle FJ. 3rd Real-time hypoglycemia prediction suite using continuous glucose monitoring: a safety net for the artificial pancreas. Diabetes Care. 2010;33(6):1249–1254. doi: 10.2337/dc09-1487. [DOI] [PMC free article] [PubMed] [Google Scholar]
- 26.Bequette BW. Challenges and recent progress in the development of a closed-loop artificial pancreas. Annu Rev Control. 2012;36(2):255–266. doi: 10.1016/j.arcontrol.2012.09.007. [DOI] [PMC free article] [PubMed] [Google Scholar]
- 27.Kovatchev B, Cobelli C, Renard E, Anderson S, Breton M, Patek S, Clarke W, Bruttomesso D, Maran A, Costa S, Avogaro A, Dalla Man C, Facchinetti A, Magni L, De Nicolao G, Place J, Farret A. Multinational study of subcutaneous model-predictive closed-loop control in type 1 diabetes mellitus: summary of the results. J Diabetes Sci Technol. 2010;4(6):1374–1381. doi: 10.1177/193229681000400611. [DOI] [PMC free article] [PubMed] [Google Scholar]
- 28.Garg S, Brazg RL, Bailey TS, Buckingham BA, Slover RH, Klonoff DC, Shin J, Welsh JB, Kaufman FR. Reduction in duration of hypoglycemia by automatic suspension of insulin delivery: the in-clinic ASPIRE study. Diabetes Technol Ther. 2012;14(3):205–209. doi: 10.1089/dia.2011.0292. [DOI] [PubMed] [Google Scholar]
- 29.Hovorka R, Allen JM, Elleri D, Chassin LJ, Harris J, Xing D, Kollman C, Hovorka T, Larsen AM, Nodale M, De Palma A, Wilinska ME, Acerini CL, Dunger DB. Manual closed-loop insulin delivery in children and adolescents with type 1 diabetes: a phase 2 randomised crossover trial. Lancet. 2010;375(9716):743–751. doi: 10.1016/S0140-6736(09)61998-X. [DOI] [PubMed] [Google Scholar]
- 30.Renard E, Place J, Cantwell M, Chevassus H, Palerm CC. Closed-loop insulin delivery using a subcutaneous glucose sensor and intraperitoneal insulin delivery: feasibility study testing a new model for the artificial pancreas. Diabetes Care. 2010;33(1):121–127. doi: 10.2337/dc09-1080. [DOI] [PMC free article] [PubMed] [Google Scholar]
- 31.Petrofsky JS, McLellan K, Prowse M, Bains G, Berk L, Lee S. The effect of body fat, aging, and diabetes on vertical and shear pressure in and under a waist belt and its effect on skin blood flow. Diabetes Technol Ther. 2010;12(2):153–160. doi: 10.1089/dia.2009.0123. [DOI] [PubMed] [Google Scholar]
- 32.Li CM, Dong H, Cao X, Luong JH, Zhang X. Implantable electrochemical sensors for biomedical and clinical applications: progress, problems, and future possibilities. Curr Med Chem. 2007;14(8):937–951. [PubMed] [Google Scholar]
- 33.Ertefai S, Gough DA. Physiological preparation for studying the response of subcutaneously implanted glucose and oxygen sensors. J Biomed Eng. 1989;11(5):362–368. doi: 10.1016/0141-5425(89)90097-6. [DOI] [PubMed] [Google Scholar]
- 34.Rabkin JM, Hunt TK. Local heat increases blood flow and oxygen tension in wounds. Arch Surg. 1987;122(2):221–225. doi: 10.1001/archsurg.1987.01400140103014. [DOI] [PubMed] [Google Scholar]
- 35.Castle JR, Pitts A, Hanavan K, Muhly R, El Youssef J, Hughes-Karvetski C, Kovatchev B, Ward WK. The accuracy benefit of multiple amperometric glucose sensors in people with type 1 diabetes. Diabetes Care. 2012;35(4):706–710. doi: 10.2337/dc11-1929. [DOI] [PMC free article] [PubMed] [Google Scholar]