Fig. 8.
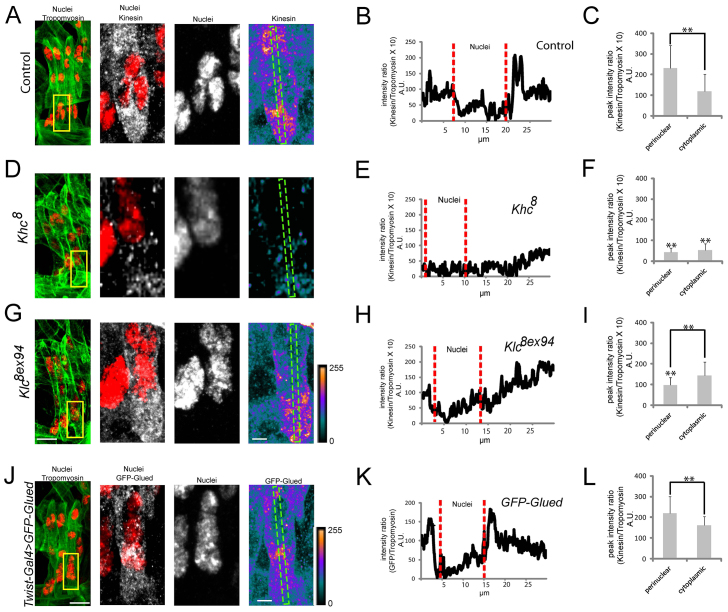
Kinesin and the Dynactin subunit Glued accumulate near nuclei. (A,D,G) (Left) Immunofluorescence images of the LT muscles (green) and their nuclei (red) in a single hemisegment of a stage 16 embryo. Yellow boxes indicate regions shown at higher magnification to the right. (Right) Higher magnification images of the nuclei and Khc, shown as merged images (red, nuclei; gray, Khc) and as separate signals with Khc shown as a heat map to illustrate regions of accumulation near the nucleus in control embryos and toward the muscle pole in Klc8ex94 embryos. Scale indicating relative intensities is shown bottom right of G. Green boxes indicate regions used for linescan intensity profiles. (B,E,H) Intensity profiles of Khc in control (B), Khc8 (E) and Klc8ex94 (H) embryos. (C,F,I) The average intensity of the Khc immunofluorescence signal both perinuclear and distant from the nucleus in the cytoplasm of control (C), Khc8 (F) and Klc8ex94 (I) embryos. (J) (Left) Immunofluorescence image of the LT muscles (green) and their nuclei (red) in a single hemisegment in a stage 16 embryo expressing GFP-Glued specifically in the mesoderm. Yellow box indicates the region shown at higher magnification to the right. (Right) Higher magnification images of nuclei and GFP-Glued, shown as merged images (red, nuclei; gray, GFP-Glued) and as separate signals with GFP-Glued shown as a heat map to illustrate regions of accumulation. Green box indicates the region used for the linescan intensity profile. (K) Intensity profile of GFP-Glued in a muscle expressing the transgene. (L) The average intensity of GFP-Glued fluorescence signal both perinuclear and distant from the nucleus in the cytoplasm. For C,F,I,L, error bars are the s.d. from 30 muscles in 15 embryos from three independent experiments. **P<0.01, compared with control in C unless otherwise indicated by brackets. Scale bars: 10 μm in A,D,G,J left; 5 μm in A,D,G,J right.

