

Key Points
Although the risk of ALL relapse is significantly higher in children with DS, good-prognosis subgroups have been identified.
Patients with DS-ALL have higher treatment-related mortality throughout the treatment period independent of the therapeutic regimen.
Abstract
Children with Down syndrome (DS) have an increased risk of B-cell precursor (BCP) acute lymphoblastic leukemia (ALL). The prognostic factors and outcome of DS-ALL patients treated in contemporary protocols are uncertain. We studied 653 DS-ALL patients enrolled in 16 international trials from 1995 to 2004. Non-DS BCP-ALL patients from the Dutch Child Oncology Group and Berlin-Frankfurt-Münster were reference cohorts. DS-ALL patients had a higher 8-year cumulative incidence of relapse (26% ± 2% vs 15% ± 1%, P < .001) and 2-year treatment-related mortality (TRM) (7% ± 1% vs 2.0% ± <1%, P < .0001) than non-DS patients, resulting in lower 8-year event-free survival (EFS) (64% ± 2% vs 81% ± 2%, P < .0001) and overall survival (74% ± 2% vs 89% ± 1%, P < .0001). Independent favorable prognostic factors include age <6 years (hazard ratio [HR] = 0.58, P = .002), white blood cell (WBC) count <10 × 109/L (HR = 0.60, P = .005), and ETV6-RUNX1 (HR = 0.14, P = .006) for EFS and age (HR = 0.48, P < .001), ETV6-RUNX1 (HR = 0.1, P = .016) and high hyperdiploidy (HeH) (HR = 0.29, P = .04) for relapse-free survival. TRM was the major cause of death in ETV6-RUNX1 and HeH DS-ALLs. Thus, while relapse is the main contributor to poorer survival in DS-ALL, infection-associated TRM was increased in all protocol elements, unrelated to treatment phase or regimen. Future strategies to improve outcome in DS-ALL should include improved supportive care throughout therapy and reduction of therapy in newly identified good-prognosis subgroups.
Introduction
Children with Down syndrome (DS) are predisposed to develop acute myeloid leukemia (AML) and acute lymphoblastic leukemia (ALL),1 which are characterized by unique biological features in comparison with those of non–DS-ALL.2-4
Children with DS-ALL have an inferior outcome compared with non-DS patients because of both higher treatment-related mortality (TRM) and a higher relapse rate.5-9 Because attempts to decrease TRM by reducing treatment intensity may contribute to the increased risk of relapse in DS-ALL, it is important to determine whether the risk for TRM is related to a specific treatment phase or chemotherapeutic agent.8-10 Small series suggest that DS-ALL patients have an increased risk of mucositis from methotrexate (MTX), myelosuppression from anthracyclines, and hyperglycemia from glucocorticoids.10-16
Acquired leukemic cell genetic abnormalities have important prognostic significance in non-DS childhood ALL.17 However, the impact of these abnormalities on treatment outcome in DS-ALL is unknown, because all published series lack a sufficient sample size to draw clear conclusions. Even the prognostic significance of well-known good prognostic factors in non–DS-ALL such as t(12;21)(p13;q22) (ETV6-RUNX1), high hyperdiploidy (HeH), and trisomies 4 and 10 is uncertain in DS-ALL, as is the significance of unfavorable translocations such as t(9;22)(q34;q11) (BCR-ABL1) and t(4;11)(q21;q23) (MLL-AF4).2 Of interest, these prognostic genetic features have a lower frequency in DS-ALL.2,7,18,19
Recently, genetic abnormalities such as JAK2 mutations20 and CRLF2 rearrangements have been identified in both DS and non–DS-ALL.3,4,20-27 Activating JAK2 R683 mutations were found in ∼18% of DS-ALL patients.20,24 Rearrangements of CRLF2 occurred in ∼60% of DS-ALL patients and in fewer than 10% of non–DS-ALL patients.3,4,23 In almost all instances, JAK2 (or rarely JAK1 or IL7R) mutations were associated with CRLF2 gene rearrangements, suggesting a model by which CRLF2 overexpression results in JAK-STAT activation and proliferation of the leukemic clone.3 Thus far, CRLF2 gene rearrangements lack prognostic relevance in DS-ALL, although all series were small.3,4,21,27
The small size of most studies in DS-ALL patients has precluded definitive answers to the issues raised above. Hence, we undertook a large retrospective study of DS-ALL within the International ALL “Ponte di Legno” Working Group to study clinically relevant outcome parameters, the prognostic relevance of well-established and novel (cyto)genetic aberrations in ALL, and causes of treatment failure, thereby allowing a sufficient sample size to draw meaningful conclusions, despite the caveat of heterogeneity in treatment over time and between different study groups.28
Patients and methods
Patients
Patients eligible for this study were enrolled in various national or collaborative group clinical trials between January 1, 1995, and December 31, 2004, were ≤18 years at diagnosis and were treated with curative intent. The institutional review boards of each participating center approved treatment protocols according to the local law and guidelines. Informed consent was obtained in accordance with the Declaration of Helsinki. Participating study groups and their number of patients are detailed in supplemental Table 1 (available on the Blood Web site). A predefined set of data were collected, consisting of clinical data obtained at diagnosis and treatment and cytogenetic and molecular data (supplemental Table 2).
DS-ALL patients were treated according to standard ALL treatment protocols, but modifications of the standard protocol did occur. None of the protocols provided specific supportive care measures for DS-ALL children. In total, 42.3% (n = 276) DS-ALL patients received a reduced dose of chemotherapy. Most of these dose reductions (79%) were planned prior to the administration of specific courses of chemotherapy and gradually increased by observed clinical toxicity. Modifications for MTX consisted of dose reductions of high-dose MTX, varying from 10% to 75% of the maximum dose, and intensified leucovorin rescue. DS-ALL patients enrolled in EORTC 58951 protocols from September 2002 (n = 7) received 0.5 g/m2 of MTX instead of 5 g/m2. In addition, patients treated on protocol POG 9405 (n = 10) started with 50% of the total dose of daunorubicin, cytarabine, teniposide, histone deacetylase, and Peg-asparaginase, which was successively increased or reduced depending on toxicity. Supplemental Table 3 provides an overview of the main chemotherapeutic agents of treatment protocols used by the various study groups.
Data on either JAK2 R683 mutations and/or CRLF2 gene rearrangements were available from a subset of patients (n = 182) included in this study. There were no statistical differences between patients with and without available data. Some of these data have been previously reported.20,24,25 However, several study groups contributed new unpublished data.
Non–DS-ALL reference cohort
For comparison, population-based B-cell precursor (BCP) ALL reference cohorts from the Dutch Child Oncology Group (DCOG) and the ALL Berlin-Frankfurt-Münster (BFM) study group, from exactly the same time period as the DS patients (January 1, 1995, and December 31, 2004), were added. The DCOG data set consisted of 827 non-DS BCP-ALL patients enrolled in 3 DCOG ALL treatment protocols (ALL8, ALL9, and ALL10). The BFM data set consisted of 3618 non-DS BCP-ALL patients enrolled in 2 BFM treatment protocols (BFM-95 and BFM-2000) in Germany and Austria. Details of these protocols have been reported elsewhere, except for protocol ALL10, which is ongoing.29,30
There were no significant differences in outcome estimates or in the distribution of cytogenetic subgroups between the DCOG and BFM data sets (data not shown) or when compared with reported data from other participating groups.31-38 The DCOG and BFM non-DS data sets were merged for statistical analysis.
Cytogenetic analysis
Genetic abnormalities were determined by G-, Q-, or R-banded karyotyping, fluorescence in situ hybridization (FISH), or reverse-transcription polymerase chain reaction (RT-PCR). Diagnosis of rearrangements of ETV6-RUNX1, BCR-ABL1, and MLL were based on one or more of these techniques; diagnosis of HeH was defined by modal chromosomal number ≥52 or DNA index ≥1.13 for DS-ALL patients and ≥51 chromosomes for non-DS patients. All cytogenetic data were centrally reviewed by 2 coauthors (N.H. and E.F.). The definition and description of clonal abnormalities followed the recommendations of the International System for Human Cytogenetic Nomenclature (ISCN 2005).39
CRLF2 gene rearrangements were identified by genomic array, FISH, genomic PCR, Sanger sequencing, or multiplex ligation-dependent probe amplification.
Statistical analyses
Statistical analyses were conducted using SAS software (SAS-PC, version 9.1). The Kaplan-Meier method was used to estimate survival: complete remission rate (CR), event-free survival (EFS), overall survival (OS), and relapse-free survival (RFS). The survival estimates were compared using the log-rank test. The cumulative incidence of toxic death (TRM) and the cumulative incidence of relapse (CIR) were calculated by the method of Kalbfleisch and Prentice and compared with the use of Gray’s test. CR was defined as <5% blasts in the bone marrow, with regeneration of trilineage hematopoiesis plus absence of leukemic cells in the cerebrospinal fluid or elsewhere. EFS was calculated from the date of diagnosis to the date of last follow-up or to the first event, including relapse, death in CR, failure to achieve CR (considered as event on day 0), or second malignancy. Early death was defined as any death within the first 6 weeks of treatment and was considered as an event on day 0 for statistical analysis. OS was measured from the date of diagnosis to the date of last follow-up or to the date of death from any cause. CIR included death in CR and other events as competing events.
χ2 analysis was used to compare categorical variables, and the Fisher exact test was used for small patient numbers. The nonparametric Mann-Whitney U test was applied for continuous variables. P values ≤ .05 were considered as statistically significant (2-tailed testing).
For multivariate analysis, the Cox regression model was used. Continuous variables were categorized according to the National Cancer Institute (NCI) risk criteria.40 P values ≤ .05 were considered as statistically significant (2-tailed testing).
Results
Patient characteristics
In total, data of 708 DS-ALL patients were collected, of which 55 were excluded because they did not meet the inclusion criteria; ie, the karyotype of 1 patient lacked constitutional trisomy 21, 39 patients were diagnosed outside the inclusion period of the study, 2 patients were not treated with curative intent, and the age of 9 patients was <18 years at diagnosis (range, 18.2-21.9 years). Furthermore, we excluded the 5 patients with T-cell ALL because this number was considered too small for meaningful statistical analysis. However, clinical and cytogenetic characteristics of these 5 T-cell ALL patients are described in supplemental Table 4. Hence, 653 patients with DS BCP-ALL were analyzed. DS-ALL patients were slightly older than non-DS patients at diagnosis (median 5.0 vs 4.7 years; P = .002) (Table 1), and DS-ALL did not occur in infants. The initial white blood cell (WBC) count of DS-ALL patients was not different compared with non-DS (median 10.2 × 10⁹/L [range 0.2-459] vs 8.9 × 10⁹/L [range 1.7-998], P = .14).
Table 1.
Patient characteristics of DS-ALL patients and the DCOG non-DS BCP-ALL reference cohort
| DS-ALL | non–DS-ALL | P | |
|---|---|---|---|
| Number of patients | 653 | 4445 | — |
| Age at diagnosis (range), y | 5.0 (1.2-17.9) | 4.7 (0.1-17.9) | .002 |
| Sex | |||
| Male | 343 | 2431 | — |
| Female | 310 | 2014 | .3 |
| Median initial WBC × 109/L (range) | 10.5 (0.2-459) | 8.8 (0.2-999) | .14 |
| Extramedullary disease | |||
| CNS (%) | 16/624* (2.5) | 98/4258* (2.2) | .69 |
| Lymph nodes (%) | 134/412* (32.5) | 1471/4339* (33.1) | .57 |
| Hepatomegaly (%) | 245/469* (52.2) | 3156/4357* (71) | <.001 |
| Testis (%) | 1/296* (<1%) | 28/4317 (<1%) | .51 |
| Cytogenetic subgroups | |||
| Normal karyotype | 179/444* (40.3) | 45/650* (6.9) | <.001 |
| BCR-ABL1 t(9;22) | 3/444* (0.7) | 93/3898* (2.4) | .02 |
| MLL (11q23) | 2/444* (0.5) | 36/2966* (1.2) | .15 |
| ETV6-RUNX1 t(12;21) | 37/444* (8.3) | 841/3264* (25.8) | <.001 |
| HeH$ | 40/444* (9) | 235/708* (33) | <.001 |
| HeH trisomy 4 and 10 | 18 (4.5) | 100 (42.5) | <.001 |
| HeH, other | 22 (5.5) | 135 (57.5) | <.001 |
| Others | 183 (41.2) | 225/650* (34.6) | .03 |
| 8-y OS | 74% ± 2% | 89% ± 2% | <.001 |
| 8-y EFS | 64% ± 2% | 81% ± 2% | <.001 |
| 8-y CIR | 26% ± 2% | 15% ± 1% | .001 |
| 2-y TRM | 7% ± 1% | 2% ± <1% | <.001 |
CNS, central nervous system involvement at diagnosis (>5 WBC/μL; CNS-3); HeH$, DS: 52-60 chromosomes, non-DS: 51-60 chromosomes.
Number of patients available for analysis.
Genetic data
All leukemic karyotypes and FISH and RT-PCR results underwent central review; 68% (n = 444) of the DS patients had adequate genetic data (Table 1). In total, 40.3% had a cytogenetically normal (CN) karyotype (ie, only constitutional trisomy 21) compared with 6.9% of the non-DS cases (P < .001). A total of 9% of DS patients had a HeH karyotype compared with 33% of non-DS patients (P < .001). HeH DS patients were significantly older than HeH non-DS patients (median 7.2 years vs 4.2, P < .001). Trisomies of both chromosomes 4 and 10 were found in 45% of the HeH DS-ALL patients, similar to non-DS HeH patients (42.6%, P = .77).18,41
ETV6-RUNX1 fusion was found in 8.3% of the DS-ALL patients (compared with 25.8% in non-DS, P < .001), BCR-ABL1 fusion in 0.7% compared with 2.4% in non-DS (P = .02), and MLL rearrangements in <1% compared with 1.2% in non-DS (P = .2). The previously reported t(8;14)(q11.2;q32) translocation was found in DS-ALL patients only (2%).2,42,43
In total, 182 patients had available data on either JAK and/or CRLF2 aberrations. JAK2 R683 mutations were found in 21% (n = 30) of the 141 DS-ALL patients with available data, of which 83% (n = 25) also had a CRLF2 gene rearrangement. In 69% (n = 93) of the 134 DS-ALL patients with available data, CRLF2 gene rearrangements were found, including 5.4% (n = 6) with IGH@-CRLF2 translocations and 94.6% (n = 87) with P2RY8-CRLF2 fusions. DS patients with CRLF2 gene rearrangements were younger compared with DS patients with wild-type CRLF2 (4.1 vs 7.7 years, P < .001), but no difference in diagnostic WBC was observed (14.8 vs 11.8 × 10⁹/L, P = .7). This differs from non-DS patients with CRLF2 gene rearrangements who had lower WBC counts (14.6 vs 34.6 × 10⁹/L, P = .004) but did not differ in age (5.1 vs 4.7 years, P = .7) compared with wild-type patients (supplemental Table 5).
Treatment outcome according to clinical data
The median follow-up time was 6.8 years for DS-ALL and 8.4 years for non-DS survivors. The CR rate was 96.7% in DS-ALL and 99% in non-DS patients (P < .001). Induction failures were more frequent in DS-ALL compared with non-DS (3.0% and 1.0%, respectively; P < .001). DS patients had a higher CIR (26% ± 2% vs 15% ± 1% at 8 years, P < .0001) and TRM (7% ± 1% vs 2% ± <1% at 2 years, P < .0001) than non-DS patients, resulting in a lower EFS (64% ± 2% vs 81% ± 2% at 8 years, P < .0001) and OS (74% ± 2% vs 89% ± 2%, P < .0001) (Figure 1). In total, 144 DS patients relapsed compared with 650 non-DS patients. The time to relapse after CR was significantly longer for DS (median 2.8 years, p25: 1.8 years, p75: 4.0 years) than for non-DS patients (median 2.4 years, p25: 1.4 years, p75: 3.5 years, P = .007). In addition, 23 DS-ALL patients relapsed after 5 years vs 33 non–DS-ALL patients (P < .001). Treatment outcome did not differ significantly between the early (1995-2000) and late (2000-2004) treatment eras for DS patients (8-year: OS 77% ± 3% vs 73% ± 3%, P = .7; CIR 26.7% ± 3% vs 31% ± 6%, P = .4).
Figure 1.

Treatment outcome of the DS-ALL and non–DS-ALL patients. The continuous lines represent DS-ALL patients, and the dotted lines represent non–DS-ALL patients. The red line represents OS, the blue line EFS, the green line the cumulative incidence of TRM, and the light blue line CIR. SE, standard error.
The 379 DS-ALL children <6 years fared significantly better than the 272 older children (8-year: EFS 70% ± 3% vs 54% ± 4%, P < .0001; OS 78% ± 2% vs 67% ± 3%, P = .002; CIR 21% ± 2% vs 34% ± 3%, P ≤ .001; and 2-year cumulative incidence of TRM, 7% ± 1% vs 8% ± 2%; P = .33). Notably, the 126 children aged 6 to 9 years had a relatively poor outcome (8-year: EFS 51% ± 3%, OS 70% ± 5%), which was due to a very high frequency of relapse (CIR 41% ± 6%) not attributable to any known risk factor(s). Outcome declined with increasing WBC count and was best for the 319 patients with WBC <10 × 109/L due to a low risk of TRM (8-year: 4% ± 1% vs 11% ± 2% for WBC ≥10 × 109/L, P = .0003) and relapse (8-year: 21% ± 3% vs 30% ± 3%, P = .03). These features thus define a favorable risk group with age <6 years and WBC <10 × 109/L, when compared with the remaining DS patients (8-year: EFS 78% ± 3% vs 58% ± 3%, P < .0001; OS 87% ± 3% vs 68% ± 3%, P < .0001; CIR 17% ± 3% vs 30% ± 2%, P = .003; 2-year TRM 3% ± 1% vs 9% ± 1%, P = .002) (Figure 2, Table 2). These criteria predicted outcome more accurately than the classical NCI criteria (supplemental Figure 1).40 These features remained significant after excluding patients with ETV6-RUNX1 rearrangements or trisomies 4 and 10 from the analysis. The effect of this new Ponte di Legno (PdL) risk stratification was consistent among the larger study groups including AIEOP, BFM, CCG, POG, and the UK with a hazard ratio (HR) of 1.62 for high-risk patients from the UK and 3.79 for BFM patients. Among patients with age >6 years and WBC >10 × 109/L, DS patients had a poorer outcome than non-DS patients (8-year: EFS 58% ± 3% vs 78% ± 1%, P < .001; OS 68% ± 3% vs 86% ± 1%, P < .001; CIR 30% ± 2% vs 17% ± 1%, P < .001; 2-year TRM 10% ± 1% vs 2% ± <1%, P < .0001). The clinical characteristics of DS-ALL patients (n = 246) classified as NCI low risk but considered high risk according to our criteria are described in supplemental Table 6.
Figure 2.
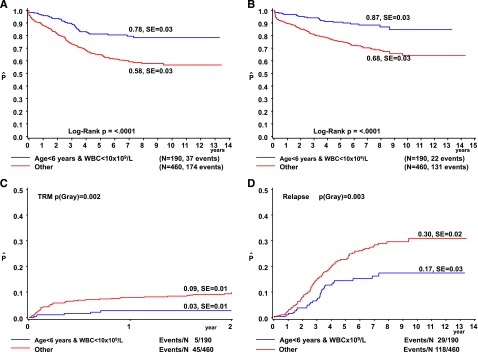
Treatment outcome according to age and WBC in DS-ALL. The OS (A), EFS (B), cumulative incidence of TRM (C), and CIR (D) are depicted for patients aged <6 years with WBC <10 × 109/L (blue line) vs all other DS-ALL patients (red line). The numbers on the curves for OS and EFS represent results at 8 years. The numbers on the curves for TRM are 2-year results (during treatment only) and those for relapse are results at 8 years. SE, standard error.
Table 2.
Contingency table representing outcome of DS patients by NCI risk group and PdL risk group criteria
| Classical NCI criteria | PdL risk criteria | ||
|---|---|---|---|
| Standard risk | High risk | ||
| Low risk | n = 187 EFS 78% ± 3% OS 87% ± 3% TRM 3% ± 1% CIR 17% ± 3% |
n = 246 EFS 63% ± 4% OS 73% ± 3% TRM 7% ± 2% CIR 30% ± 4% |
NCI SR n = 433 |
| High risk | n = 0 | n = 218 EFS 57% ± 4% OS 62% ± 4% TRM 12% ± 2% CIR 29% ± 3% |
NCI HR n = 218 |
| PdL SR model n = 187 |
PdL HR model n = 464 |
Total n = 651 |
|
Classical NCI risk criteria: age 1-9 or ≥ 10 y at diagnosis and WBC < or ≥50 × 109/L; PdL low-risk criteria: age <6 y and WBC <10 × 109/L; PdL high-risk criteria: all other patients.
HR, high risk; SR, standard risk.
In total, 18 (2.8%) of the DS-ALL patients received a stem cell transplantation: 3 in CR1 and 15 in CR2. Of these patients, 6 are alive in continuous CR and 12 patients died (1 graft-versus-host disease, 1 toxic noninfectious event, 1 infection, and 9 relapses).
Treatment outcome according to genetic data
The 37 DS-ALL patients with ETV6-RUNX1 had significantly better outcome than the other DS patients: 8-year EFS 95% ± 4% vs 63% ± 3% (P = .001), OS 97% ± 3% vs 75% ± 2% (P = .007), CIR 3% ± 3% vs 26% ± 2% (P = .004), and 2-year TRM 3% ± 3% vs 8% ± 1%; (P = .2). DS-ALL patients with ETV6-RUNX1 did not differ in outcome when compared with the 841 non-DS patients with this abnormality (8-year: EFS 95%, P = .48; OS 96%, P = .91; CIR 7%, P = .32; 2-year TRM 1%, P = .19).
The 40 HeH DS-ALL patients had a significantly lower CIR than the other DS-ALL patients (8-year: 8% ± 5% vs 26% ± 3%, P = .02). However, a relatively high rate of TRM (2-year: 13% ± 5% in HeH vs 7% ± 1% in non-HeH DS, P = .2) resulted in similar 8-year EFS (77% ± 7% vs 65% ± 3%, P = .28) and OS (79% ± 6% vs 76% ± 2%, P = .88). TRM in these HeH patients was not exclusively seen in one treatment strategy but was spread across the different treatment protocols. HeH DS-ALL patients showed lower OS when compared with the 235 HeH non-DS patients due to increased TRM (8-year: OS 79% ± 6% vs 93% ± 2%, P = .009; EFS 77% ± 7% vs 86% ± 2%, P = .06; CIR 8% ± 5% vs 11% ± 2%, P = .7; 2-year: TRM 13% ± 5% vs 1% ± 1%, P < .001).
The subgroup of HeH DS-ALL patients with trisomies 4 and 10 (n = 18) showed a trend toward better outcome when compared with all other DS-ALL patients (8-year: EFS 88% ± 8% vs 65% ± 3%, P = .09; OS 88% ± 8% vs 76% ± 2%, P = .32; CIR 0% vs 25% ± 2%, P = .03; 2-year: TRM 12% ± 8% vs 7% ± 1%, P = .6). No DS patients with these trisomies relapsed, and all events were due to toxicity. Their outcome was similar when compared with non-DS patients with trisomy 4 and 10 (8-year: EFS 90.8% ± 3%; P = .75, OS 92.3% ± 4%; P = .65, CIR 5.1% ± 2%; P = .34, 2-year: TRM 3.0% ± 2%, P = .1).
DS-ALL patients with or without JAK2 mutations had similar treatment 8-year outcomes (EFS 57% ± 10% vs 69% ± 5%, P = .1; CIR 26% ± 9% vs 23% ± 5%, P = .48). No data were available in the reference cohort. The 93 DS-ALL patients with CRLF2 aberrations showed no significant difference in 8-year survival compared with the 41 wild-type DS-ALL patients (EFS 62% ± 6% vs 71% ± 8%, P = .21; OS 73% ± 5% vs 83% ± 8%, P = .13; CIR 26% ± 6% vs 22% ± 8%, P = .44). DS-ALL patients with CRLF2 gene rearrangements did not differ in outcome from non–DS-ALL patients with these aberrations (8-year: EFS 62% ± 6% vs 58% ± 9%, P = .7; OS 73% ± 5% vs 79% ± 8%, P = .6; CIR 26% ± 6% vs 38% ± 9%, P = .15). Median time to relapse for DS patients with CRLF2 aberrations was 29 months vs 51 months in patients with wild-type CRLF2 (P = .11).
Treatment-related mortality
In total, 7.7% of the DS-ALL patients died of other causes than relapsed/refractory disease compared with 2.3% in non-DS (P < .001). TRM occurred at all phases of therapy, including maintenance (supplemental Table 7). TRM death during induction occurred in 2.8% (n = 18) of the DS patients (13 infectious, 5 noninfectious deaths). In CR, 4.9% (n = 32) of the DS patients died of TRM (25 infectious, 7 noninfectious). The most common cause of TRM was infection, mainly respiratory and bacterial infections. Only 0.3% (n = 2) of the DS ALL patients died of second malignancies in CR1 (secondary AML and Epstein-Barr virus lymphoproliferative disease), compared with 1.3% of the non-DS patients (P < .04). Secondary malignancies in non-DS patients included 28 AML/myelodysplastic syndromes, 5 brain tumors, 9 other tumors, and 13 other malignancies.
TRM was not significantly different between DS patients treated in the CCG/POG/UK studies (3-drug induction) and those DS patients treated in AIEOP/BFM studies (4-drug induction); the rate of death during induction was 1.1% ± 1% vs 1.9% ± 1% (P = .7) and the 2-year cumulative rate was 7% ± 2% vs 8% ± 3% (P = .99). The inclusion of an anthracycline in induction (4-drug induction) had no impact on TRM.
Multivariate analysis
Stepwise multivariate Cox regression analysis of EFS revealed age <6 years (HR = 0.58, 95% confidence interval [CI] = 0.41-0.81, P = .002), WBC <10 × 109/L (HR = 0.60, 95% CI = 0.42-0.86, P = .005), and ETV6-RUNX1 (HR = 0.14, 95% CI = 0.03-0.57, P = .006) as independent predictors for favorable outcome. They also independently predicted OS (age HR = 0.66, P = .04; WBC <10 × 109/L HR = 0.51, P = .003; and ETV6-RUNX1 HR = 0.12, P = .04). RFS was predicted by age, ETV6-RUNX1, and HeH (Table 3).
Table 3.
Multivariate analysis of the DS-ALL data set
| Outcome | Variable | HR | 95% CI | P value |
|---|---|---|---|---|
| Age <6 y | 0.58 | 0.41-0.81 | .002 | |
| EFS | WBC <10 × 109/L | 0.60 | 0.42-0.86 | .005 |
| ETV6-RUNX1 | 0.14 | 0.03-0.57 | .006 | |
| HeH | 0.68 | 0.34-1.36 | .275 | |
| Age <6 y | 0.66 | 0.44-0.99 | .044 | |
| OS | WBC <10 × 109/L | 0.51 | 0.33-0.79 | .003 |
| ETV6-RUNX1 | 0.12 | 0.02-0.86 | .035 | |
| HeH | 1.01 | 0.48-2.11 | .983 | |
| Age <6 y | 0.48 | 0.32-0.73 | .000 | |
| RFS | WBC <10 × 109/L | 0.71 | 0.46-1.08 | .105 |
| ETV6-RUNX1 | 0.10 | 0.01-0.64 | .016 | |
| HeH | 0.29 | 0.09-0.92 | .036 |
HeH ≥ 52 chromosomes.
In non–DS-ALL, the classical NCI criteria are age and the initial WBC count; however, ETV6-RUNX1 and trisomy 4 and 10 are independent predictors for favorable outcome (ETV6-RUNX1: HR = 0.29, 95% CI = 0.15-0.58, P < .001; or trisomy 4 and 10: HR = 0.37, 95% CI = 0.17-0.79, P = .011). NCI criteria retained their prognostic value in a Cox model with these 3 variables (HR = 1.96; 95% CI = 1.30-2.95, P = .001). In addition, multivariate analysis showed that the PdL criteria are not driven by the large group of DS-ALL patients having CRLF2 aberrations (HR = 0.66, 95% CI = 0.33-1.33, P = .25), but more likely by age and initial WBC (HR = 2.16, 95% CI = 0.95-4.90, P = .07).
Discussion
Many study groups have reported a worse clinical outcome for DS-ALL, but almost all reports lack sufficient power to answer relevant biological questions in DS-ALL, which is the reason the PdL group undertook this retrospective review. The unprecedented size of this study cohort resolves the controversy of the frequency and clinical impact of specific (cyto)genetic aberrations in DS-ALL.2,18 Moreover, the scale of the study enabled the identification of relatively small subgroups of DS-ALL with favorable outcomes. Analysis of 444 DS-ALL patients with known cytogenetics demonstrated that the genetic subgroups predicting favorable outcome in non–DS-ALL2,6,7,18,41,44 also predict favorable outcome in DS-ALL. Most significant is the discovery that ETV6-RUNX1 conferred an excellent prognosis and that HeH with trisomy of chromosomes 4 and 10 was associated with a very low CIR. Hence, these patients, comprising 12% of DS-ALL, may be eligible for future treatment reduction to reduce TRM and can be treated according to the same risk-stratified algorithms as non-DS patients in the collaborative study group protocols.
Another novel finding of this study was the identification of a clinically favorable prognostic subgroup of DS-ALL patients, characterized by age <6 years and WBC <10 × 109/L. These cut points differ from those used in the classical NCI ALL risk criteria, although the biological basis for this difference is not fully understood.40 No genetic abnormalities were identified that could explain this difference between the classical NCI and the herein-reported criteria. Remarkably, children aged between 6 and 9 years at diagnosis had a relatively poor outcome similar to high-risk ALL patients, which was due to a high frequency of relapse. This subgroup may be treated according to a medium- or high-risk arm of future collaborative study group protocols. Unraveling the genetic background of the leukemia in this subgroup will be required in order to design more rational therapy for these patients. Noteworthy, minimal residual disease (MRD) was not routinely determined during the era of this study, and it is unclear whether MRD would confirm these novel risk groups. Because MRD was proven to be a powerful tool in non–DS-ALL risk assignment,45,46 further research is needed to validate whether an MRD-based strategy is desirable in future DS-ALL treatment protocols.
In general, we showed that DS-ALL patients have an inferior survival when compared with a representative non–DS-ALL cohort treated in the same time period, which is in agreement with previous smaller studies.5,10,47 Despite a high rate of TRM, and different from what is often suggested, relapse remained the main cause of treatment failure in DS patients. Interestingly, the relapses tend to occur later in DS. It is unclear if this is due to the genetic makeup of DS-ALL or to decreased immune surveillance of the residual leukemia in DS patients. It cannot be ruled out that underreported treatment reduction of patients with DS-ALL contributes to the increased relapse risk.48 This finding suggests that the currently accepted strategy of treatment reduction in DS-AML, which is characterized by a chemotherapy-sensitive phenotype,49 is not applicable to DS-ALL.47 The only exception may be DS-ALL patients with ETV6-RUNX1 or HeH, in which TRM outweighed the risk of relapse, for whom a 3-drug induction and a limited reinduction might be adequate. Interestingly, and in accordance with previous results, the incidence of secondary malignancies was significantly lower in DS patients as compared with non–DS-ALL patients. This is in agreement with the reduced propensity for solid tumors in DS patients reported before.50
The genetic basis of the aggressive clinical behavior of DS-ALL is still unknown. A high proportion of DS-ALLs have normal karyotype (40.3% compared with 6.9% of non-DS), suggesting the presence of cytogenetically invisible molecular abnormalities. One of these abnormalities, detected in 60% of DS-ALLs, is the aberrant expression of CRLF2, which is often associated with JAK-STAT mutations. In contrast to some studies showing deleterious effects of CRLF2 alterations in non-DS high-risk ALL,26,51 no such association was found in this study or in several prior smaller studies of DS-ALL.3,4,21,27 Nevertheless, a substantial proportion of DS-ALL patients carry these aberrations, thereby providing a pathway that might be targeted by inhibitors of the JAK-STAT pathway or mTOR signaling.52
IKZF1 mutational status was unknown in our data set. Recently, it was shown that this gene was frequently deleted in DS-ALL patients (in ∼35%) and was found to be an independent predictor for dismal outcome.27 Of note, the median age of patients with IKZF1 aberrations in the DS-ALL study was significantly higher compared with wild-type patients (8.2 vs 4.3 years), which could be an important genetic factor underlying the biological basis for the age cutoff point of 6 years reported here as clinically significant.
Previous studies reported increased TRM in children with DS-ALL,9 also in relapse protocols.53 The large size of our cohort enabled the observation that the increased TRM is present throughout treatment, with about half of the deaths occurring during maintenance therapy. While doses of myelosuppressive chemotherapy are typically adjusted during maintenance therapy, to maintain an adequate neutrophil count, this phase of treatment may nevertheless lead to B-cell depletion and hypogammaglobulinemia, and hence to a higher infection rate in already immune-compromised DS patients.54,55 To reduce TRM, we suggest improving supportive care throughout the treatment period with aggressive treatment of infections and studies analyzing the potential benefit of antibacterial and antifungal prophylaxis and/or immunoglobulin substitution. Patients should be leukocyte depleted as non-DS patients during maintenance in order to prevent relapse, but with prompt interruptions for aplasia and with more intensive surveillance than non-DS children.
In conclusion, this large international study demonstrated that the poorer survival seen in DS-ALL is mainly due to a higher relapse rate and less so to TRM. Therefore, treatment reduction is not warranted, except for the 12% of patients with HeH or ETV6-RUNX1 in which toxicity is the major cause of mortality. Because TRM occurs throughout therapy and is not associated with a specific chemotherapy regimen, better surveillance and improved supportive care measures throughout therapy need to be evaluated. As a result of this study, an initiative is underway to develop an international treatment protocol for children with DS-ALL.
Supplementary Material
Acknowledgments
The authors are indebted to all members of the study groups clinical centers and laboratories for contribution of data.
This work was supported by KiKa (Erasmus MC–Sophia Children’s Hospital) and in part by grants to the Children’s Oncology Group, including CA98543, U10CA98413, and U24 CA114766; Ergen Family Chair in Pediatric Cancer (S.P.H.); Women’s Auxiliary Millennium Chair in Haematology/Oncology (J.A.W.); National Cancer Institute grants CA 21765 (Saint Jude Children's Research Hospital [SJCRH]) and 5 P01CA068484 (Dana Farber Cancer Institute) (L.B.S.); the American Lebanese Syrian Associated Charities (SJCRH); and the Israel Cancer Association, Israel Science Foundation Legacy and iCORE programs, Waxman and Israel Cancer Research Foundations (S.I.).
Footnotes
The online version of this article contains a data supplement.
The publication costs of this article were defrayed in part by page charge payment. Therefore, and solely to indicate this fact, this article is hereby marked “advertisement” in accordance with 18 USC section 1734.
Authorship
Contribution: T.D.B., S.I., J.W., C.H.P., and C.M.Z. conceived of, designed, and wrote the manuscript; T.D.B., S.I., M.Z., E.F., N.A.H., M.M.v.d.H.-E., R.P., C.M.K., L.B.S., K.S., D.-C.L., K.H., M.A., A.B., G.B., K.R.R., M.S., G.C., G.M., M.M., R.P.-G., V.M., T.L., H.C., B.S., I.G., A.V.M., A.V., S.P.H., C.-H.P., C.G.M., A.M., G.E., J.R.K., J.A.W., and C.M.Z. provided all study materials or patients; T.D.B., S.I., J.W., and C.M.Z. collected and assembled data; T.D.B., S.I., M.Z., J.W., N.H., E.F., M.M.v.d.H.-E., and C.M.Z. analyzed and interpreted data; and all authors gave final approval of the manuscript.
Conflict-of-interest disclosure: The authors declare no competing financial interests.
Correspondence: C. M. Zwaan, Erasmus MC–Sophia Children’s Hospital, Department of Pediatric Oncology and Haematology, Dr. Molewaterplein 60, 3015 GJ Rotterdam, The Netherlands, e-mail: c.m.zwaan@erasmusmc.nl; and Shai Izraeli, Functional Genomics and Childhood Leukemia Research, Sheba Medical Center Tel-Hashomer, Ramat Gan, Israel 52621; e-mail: shai.izraeli@sheba.health.gov.il.
References
- 1.Hasle H, Clemmensen IH, Mikkelsen M. Risks of leukaemia and solid tumours in individuals with Down’s syndrome. Lancet. 2000;355(9199):165–169. doi: 10.1016/S0140-6736(99)05264-2. [DOI] [PubMed] [Google Scholar]
- 2.Forestier E, Izraeli S, Beverloo B, et al. Cytogenetic features of acute lymphoblastic and myeloid leukemias in pediatric patients with Down syndrome: an iBFM-SG study. Blood. 2008;111(3):1575–1583. doi: 10.1182/blood-2007-09-114231. [DOI] [PubMed] [Google Scholar]
- 3.Hertzberg L, Vendramini E, Ganmore I, et al. Down syndrome acute lymphoblastic leukemia, a highly heterogeneous disease in which aberrant expression of CRLF2 is associated with mutated JAK2: a report from the International BFM Study Group. Blood. 2010;115(5):1006–1017. doi: 10.1182/blood-2009-08-235408. [DOI] [PubMed] [Google Scholar]
- 4.Mullighan CG, Collins-Underwood JR, Phillips LA, et al. Rearrangement of CRLF2 in B-progenitor- and Down syndrome-associated acute lymphoblastic leukemia. Nat Genet. 2009;41(11):1243–1246. doi: 10.1038/ng.469. [DOI] [PMC free article] [PubMed] [Google Scholar]
- 5.Dördelmann M, Schrappe M, Reiter A, et al. Berlin-Frankfurt-Münster Group. Down’s syndrome in childhood acute lymphoblastic leukemia: clinical characteristics and treatment outcome in four consecutive BFM trials. Leukemia. 1998;12(5):645–651. doi: 10.1038/sj.leu.2400989. [DOI] [PubMed] [Google Scholar]
- 6.Arico M, Ziino O, Valsecchi MG, et al. Italian Association of Pediatric Hematology and Oncology (AIEOP) Acute lymphoblastic leukemia and Down syndrome: presenting features and treatment outcome in the experience of the Italian Association of Pediatric Hematology and Oncology (AIEOP). Cancer. 2008;113(3):515–521. doi: 10.1002/cncr.23587. [DOI] [PubMed] [Google Scholar]
- 7.Chessells JM, Harrison CJ, Watson SL, Vora AJ, Richards SM Medical Research Council Working Party on Childhood Leukaemia. Treatment of infants with lymphoblastic leukaemia: results of the UK Infant Protocols 1987-1999. Br J Haematol. 2002;117(2):306–314. doi: 10.1046/j.1365-2141.2002.03442.x. [DOI] [PubMed] [Google Scholar]
- 8.Zeller B, Gustafsson G, Forestier E, et al. Nordic Society of Paediatric Haematology and Oncology (NOPHO) Acute leukaemia in children with Down syndrome: a population-based Nordic study. Br J Haematol. 2005;128(6):797–804. doi: 10.1111/j.1365-2141.2005.05398.x. [DOI] [PubMed] [Google Scholar]
- 9.Shah N, Al-Ahmari A, Al-Yamani A, Dupuis L, Stephens D, Hitzler J. Outcome and toxicity of chemotherapy for acute lymphoblastic leukemia in children with Down syndrome. Pediatr Blood Cancer. 2009;52(1):14–19. doi: 10.1002/pbc.21737. [DOI] [PubMed] [Google Scholar]
- 10.Bassal M, La MK, Whitlock JA, et al. Lymphoblast biology and outcome among children with Down syndrome and ALL treated on CCG-1952. Pediatr Blood Cancer. 2005;44(1):21–28. doi: 10.1002/pbc.20193. [DOI] [PubMed] [Google Scholar]
- 11.Mitchell CD, Richards SM, Kinsey SE, Lilleyman J, Vora A, Eden TO Medical Research Council Childhood Leukaemia Working Party. Benefit of dexamethasone compared with prednisolone for childhood acute lymphoblastic leukaemia: results of the UK Medical Research Council ALL97 randomized trial. Br J Haematol. 2005;129(6):734–745. doi: 10.1111/j.1365-2141.2005.05509.x. [DOI] [PubMed] [Google Scholar]
- 12.Baillargeon J, Langevin AM, Mullins J, et al. Transient hyperglycemia in Hispanic children with acute lymphoblastic leukemia. Pediatr Blood Cancer. 2005;45(7):960–963. doi: 10.1002/pbc.20320. [DOI] [PMC free article] [PubMed] [Google Scholar]
- 13.Belgaumi AF, Al-Bakrah M, Al-Mahr M, et al. Dexamethasone-associated toxicity during induction chemotherapy for childhood acute lymphoblastic leukemia is augmented by concurrent use of daunomycin. Cancer. 2003;97(11):2898–2903. doi: 10.1002/cncr.11390. [DOI] [PubMed] [Google Scholar]
- 14.Cetin M, Yetgin S, Kara A, et al. Hyperglycemia, ketoacidosis and other complications of L-asparaginase in children with acute lymphoblastic leukemia. J Med. 1994;25(3-4):219–229. [PubMed] [Google Scholar]
- 15.Howard SC, Pui CH. Endocrine complications in pediatric patients with acute lymphoblastic leukemia. Blood Rev. 2002;16(4):225–243. doi: 10.1016/s0268-960x(02)00042-5. [DOI] [PubMed] [Google Scholar]
- 16.Buitenkamp TD, Mathôt RA, de Haas V, Pieters R, Zwaan CM. Methotrexate-induced side effects are not due to differences in pharmacokinetics in children with Down syndrome and acute lymphoblastic leukemia. Haematologica. 2010;95(7):1106–1113. doi: 10.3324/haematol.2009.019778. [DOI] [PMC free article] [PubMed] [Google Scholar]
- 17.Pui CH, Gajjar AJ, Kane JR, Qaddoumi IA, Pappo AS. Challenging issues in pediatric oncology. Nat Rev Clin Oncol. 2011;8(9):540–549. doi: 10.1038/nrclinonc.2011.95. [DOI] [PMC free article] [PubMed] [Google Scholar]
- 18.Maloney KW, Carroll WL, Carroll AJ, et al. Down syndrome childhood acute lymphoblastic leukemia has a unique spectrum of sentinel cytogenetic lesions that influences treatment outcome: a report from the Children’s Oncology Group. Blood. 2010;116(7):1045–1050. doi: 10.1182/blood-2009-07-235291. [DOI] [PMC free article] [PubMed] [Google Scholar]
- 19.Whitlock JA, Sather HN, Gaynon P, et al. Clinical characteristics and outcome of children with Down syndrome and acute lymphoblastic leukemia: a Children’s Cancer Group study. Blood. 2005;106(13):4043–4049. doi: 10.1182/blood-2003-10-3446. [DOI] [PubMed] [Google Scholar]
- 20.Bercovich D, Ganmore I, Scott LM, et al. Mutations of JAK2 in acute lymphoblastic leukaemias associated with Down’s syndrome. Lancet. 2008;372(9648):1484–1492. doi: 10.1016/S0140-6736(08)61341-0. [DOI] [PubMed] [Google Scholar]
- 21.Ensor HM, Schwab C, Russell LJ, et al. Demographic, clinical, and outcome features of children with acute lymphoblastic leukemia and CRLF2 deregulation: results from the MRC ALL97 clinical trial. Blood. 2011;117(7):2129–2136. doi: 10.1182/blood-2010-07-297135. [DOI] [PubMed] [Google Scholar]
- 22.Harvey RC, Mullighan CG, Chen IM, et al. Rearrangement of CRLF2 is associated with mutation of JAK kinases, alteration of IKZF1, Hispanic/Latino ethnicity, and a poor outcome in pediatric B-progenitor acute lymphoblastic leukemia. Blood. 2010;115(26):5312–5321. doi: 10.1182/blood-2009-09-245944. [DOI] [PMC free article] [PubMed] [Google Scholar]
- 23.Russell LJ, Capasso M, Vater I, et al. Deregulated expression of cytokine receptor gene, CRLF2, is involved in lymphoid transformation in B-cell precursor acute lymphoblastic leukemia. Blood. 2009;114(13):2688–2698. doi: 10.1182/blood-2009-03-208397. [DOI] [PubMed] [Google Scholar]
- 24.Blink M, Buitenkamp TD, van den Heuvel-Eibrink MM, et al. Frequency and prognostic implications of JAK 1-3 aberrations in Down syndrome acute lymphoblastic and myeloid leukemia. Leukemia. 2011;25(8):1365–1368. doi: 10.1038/leu.2011.86. [DOI] [PubMed] [Google Scholar]
- 25.Gaikwad A, Rye CL, Devidas M, et al. Prevalence and clinical correlates of JAK2 mutations in Down syndrome acute lymphoblastic leukaemia. Br J Haematol. 2009;144(6):930–932. doi: 10.1111/j.1365-2141.2008.07552.x. [DOI] [PMC free article] [PubMed] [Google Scholar]
- 26.Yoda A, Yoda Y, Chiaretti S, et al. Functional screening identifies CRLF2 in precursor B-cell acute lymphoblastic leukemia. Proc Natl Acad Sci USA. 2010;107(1):252–257. doi: 10.1073/pnas.0911726107. [DOI] [PMC free article] [PubMed] [Google Scholar]
- 27.Buitenkamp TD, Pieters R, Gallimore NE, et al. Outcome in children with Down’s syndrome and acute lymphoblastic leukemia: role of IKZF1 deletions and CRLF2 aberrations. Leukemia. 2012;26(10):2204–2211. doi: 10.1038/leu.2012.84. [DOI] [PubMed] [Google Scholar]
- 28.Biondi A, Baruchel A, Hunger S, et al. The Eleventh International Childhood Acute Lymphoblastic Leukemia Workshop Report: Ponte di Legno, Italy, 6-7 May 2009. Leukemia. 2009;23(12):2318–2324. doi: 10.1038/leu.2009.211. [DOI] [PMC free article] [PubMed] [Google Scholar]
- 29.Kamps WA, van der Pal-de Bruin KM, Veerman AJ, Fiocco M, Bierings M, Pieters R. Long-term results of Dutch Childhood Oncology Group studies for children with acute lymphoblastic leukemia from 1984 to 2004. Leukemia. 2010;24(2):309–319. doi: 10.1038/leu.2009.258. [DOI] [PubMed] [Google Scholar]
- 30.Möricke A, Zimmermann M, Reiter A, et al. Long-term results of five consecutive trials in childhood acute lymphoblastic leukemia performed by the ALL-BFM study group from 1981 to 2000. Leukemia. 2010;24(2):265–284. doi: 10.1038/leu.2009.257. [DOI] [PubMed] [Google Scholar]
- 31.Gaynon PS, Angiolillo AL, Carroll WL, et al. Children’s Oncology Group. Long-term results of the children’s cancer group studies for childhood acute lymphoblastic leukemia 1983-2002: a Children’s Oncology Group Report. Leukemia. 2010;24(2):285–297. doi: 10.1038/leu.2009.262. [DOI] [PMC free article] [PubMed] [Google Scholar]
- 32.Mitchell C, Richards S, Harrison CJ, Eden T. Long-term follow-up of the United Kingdom medical research council protocols for childhood acute lymphoblastic leukaemia, 1980-2001. Leukemia. 2010;24(2):406–418. doi: 10.1038/leu.2009.256. [DOI] [PMC free article] [PubMed] [Google Scholar]
- 33.Pui CH, Pei D, Sandlund JT, et al. Long-term results of St Jude Total Therapy Studies 11, 12, 13A, 13B, and 14 for childhood acute lymphoblastic leukemia. Leukemia. 2010;24(2):371–382. doi: 10.1038/leu.2009.252. [DOI] [PMC free article] [PubMed] [Google Scholar]
- 34.Schmiegelow K, Forestier E, Hellebostad M, et al. Nordic Society of Paediatric Haematology and Oncology. Long-term results of NOPHO ALL-92 and ALL-2000 studies of childhood acute lymphoblastic leukemia. Leukemia. 2010;24(2):345–354. doi: 10.1038/leu.2009.251. [DOI] [PubMed] [Google Scholar]
- 35.Stark B, Nirel R, Avrahami G, et al. Long-term results of the Israeli National Studies in childhood acute lymphoblastic leukemia: INS 84, 89 and 98. Leukemia. 2010;24(2):419–424. doi: 10.1038/leu.2009.254. [DOI] [PubMed] [Google Scholar]
- 36.Tsuchida M, Ohara A, Manabe A, et al. Tokyo Children’s Cancer Study Group. Long-term results of Tokyo Children’s Cancer Study Group trials for childhood acute lymphoblastic leukemia, 1984-1999. Leukemia. 2010;24(2):383–396. doi: 10.1038/leu.2009.260. [DOI] [PubMed] [Google Scholar]
- 37.Vilmer E, Suciu S, Ferster A, et al. Children Leukemia Cooperative Group. Long-term results of three randomized trials (58831, 58832, 58881) in childhood acute lymphoblastic leukemia: a CLCG-EORTC report. Leukemia. 2000;14(12):2257–2266. doi: 10.1038/sj.leu.2401960. [DOI] [PubMed] [Google Scholar]
- 38.Liang DC, Yang CP, Lin DT, et al. Long-term results of Taiwan Pediatric Oncology Group studies 1997 and 2002 for childhood acute lymphoblastic leukemia. Leukemia. 2010;24(2):397–405. doi: 10.1038/leu.2009.248. [DOI] [PubMed] [Google Scholar]
- 39.Shaffer LG, Tommerup N. ISCN 2005: An International System for Human Cytogenetic Nomenclature (2005). Recommendations of the International Standing Committee of Human Cytogenetic Nomenclature. Basel, Switzerland: Karger; 2005. [Google Scholar]
- 40.Smith M, Arthur D, Camitta B, et al. Uniform approach to risk classification and treatment assignment for children with acute lymphoblastic leukemia. J Clin Oncol. 1996;14(1):18–24. doi: 10.1200/JCO.1996.14.1.18. [DOI] [PubMed] [Google Scholar]
- 41.Harris MB, Shuster JJ, Carroll A, et al. Trisomy of leukemic cell chromosomes 4 and 10 identifies children with B-progenitor cell acute lymphoblastic leukemia with a very low risk of treatment failure: a Pediatric Oncology Group study. Blood. 1992;79(12):3316–3324. [PubMed] [Google Scholar]
- 42.Lundin C, Heldrup J, Ahlgren T, Olofsson T, Johansson B. B-cell precursor t(8;14)(q11;q32)-positive acute lymphoblastic leukemia in children is strongly associated with Down syndrome or with a concomitant Philadelphia chromosome. Eur J Haematol. 2009;82(1):46–53. doi: 10.1111/j.1600-0609.2008.01166.x. [DOI] [PubMed] [Google Scholar]
- 43.Messinger YH, Higgins RR, Devidas M, Hunger SP, Carroll AJ, Heerema NA. Pediatric acute lymphoblastic leukemia with a t(8;14)(q11.2;q32): B-cell disease with a high proportion of Down syndrome: a Children’s Oncology Group study. Cancer Genet. 2012;205(9):453–458. doi: 10.1016/j.cancergen.2012.07.016. [DOI] [PMC free article] [PubMed] [Google Scholar]
- 44.Pui CH, Raimondi SC, Borowitz MJ, et al. Immunophenotypes and karyotypes of leukemic cells in children with Down syndrome and acute lymphoblastic leukemia. J Clin Oncol. 1993;11(7):1361–1367. doi: 10.1200/JCO.1993.11.7.1361. [DOI] [PubMed] [Google Scholar]
- 45.Conter V, Bartram CR, Valsecchi MG, et al. Molecular response to treatment redefines all prognostic factors in children and adolescents with B-cell precursor acute lymphoblastic leukemia: results in 3184 patients of the AIEOP-BFM ALL 2000 study. Blood. 2010;115(16):3206–3214. doi: 10.1182/blood-2009-10-248146. [DOI] [PubMed] [Google Scholar]
- 46.van Dongen JJ, Seriu T, Panzer-Grümayer ER, et al. Prognostic value of minimal residual disease in acute lymphoblastic leukaemia in childhood. Lancet. 1998;352(9142):1731–1738. doi: 10.1016/S0140-6736(98)04058-6. [DOI] [PubMed] [Google Scholar]
- 47.Goto H, Inukai T, Inoue H, et al. Acute lymphoblastic leukemia and Down syndrome: the collaborative study of the Tokyo Children’s Cancer Study Group and the Kyushu Yamaguchi Children’s Cancer Study Group. Int J Hematol. 2011;93(2):192–198. doi: 10.1007/s12185-011-0765-3. [DOI] [PubMed] [Google Scholar]
- 48.Bohnstedt C, Levinsen M, Rosthøj S, et al. Nordic Society of Pediatric Hematology and Oncology (NOPHO) Physicians compliance during maintenance therapy in children with Down syndrome and acute lymphoblastic leukemia. Leukemia. 2013;27(4):866–870. doi: 10.1038/leu.2012.325. [DOI] [PubMed] [Google Scholar]
- 49.Zwaan CM, Kaspers GJ, Pieters R, et al. Different drug sensitivity profiles of acute myeloid and lymphoblastic leukemia and normal peripheral blood mononuclear cells in children with and without Down syndrome. Blood. 2002;99(1):245–251. doi: 10.1182/blood.v99.1.245. [DOI] [PubMed] [Google Scholar]
- 50.Hasle H. Pattern of malignant disorders in individuals with Down’s syndrome. Lancet Oncol. 2001;2(7):429–436. doi: 10.1016/S1470-2045(00)00435-6. [DOI] [PubMed] [Google Scholar]
- 51.Cario G, Zimmermann M, Romey R, et al. Presence of the P2RY8-CRLF2 rearrangement is associated with a poor prognosis in non-high-risk precursor B-cell acute lymphoblastic leukemia in children treated according to the ALL-BFM 2000 protocol. Blood. 2010;115(26):5393–5397. doi: 10.1182/blood-2009-11-256131. [DOI] [PubMed] [Google Scholar]
- 52.Maude SL, Tasian SK, Vincent T, et al. Targeting JAK1/2 and mTOR in murine xenograft models of Ph-like acute lymphoblastic leukemia. Blood. 2012;120(17):3510–3518. doi: 10.1182/blood-2012-03-415448. [DOI] [PMC free article] [PubMed] [Google Scholar]
- 53.Meyr F, Escherich G, Mann G, et al. Outcomes of treatment for relapsed acute lymphoblastic leukaemia in children with Down syndrome. Br J Haematol. 2013;162(1):98–106. doi: 10.1111/bjh.12348. [DOI] [PubMed] [Google Scholar]
- 54.Cetiner S, Demirhan O, Inal TC, Tastemir D, Sertdemir Y. Analysis of peripheral blood T-cell subsets, natural killer cells and serum levels of cytokines in children with Down syndrome. Int J Immunogenet. 2010;37(4):233–237. doi: 10.1111/j.1744-313X.2010.00914.x. [DOI] [PubMed] [Google Scholar]
- 55.Chaushu S, Chaushu G, Zigmond M, et al. Age-dependent deficiency in saliva and salivary antibodies secretion in Down’s syndrome. Arch Oral Biol. 2007;52(11):1088–1096. doi: 10.1016/j.archoralbio.2007.06.002. [DOI] [PubMed] [Google Scholar]
Associated Data
This section collects any data citations, data availability statements, or supplementary materials included in this article.