
Figure 2.
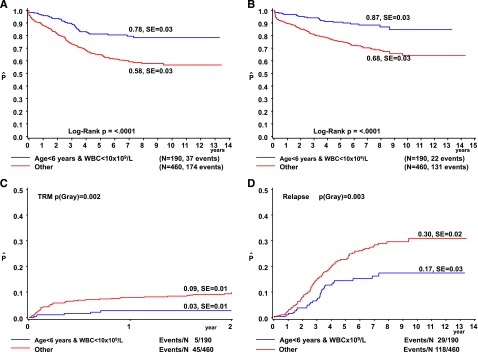
Treatment outcome according to age and WBC in DS-ALL. The OS (A), EFS (B), cumulative incidence of TRM (C), and CIR (D) are depicted for patients aged <6 years with WBC <10 × 109/L (blue line) vs all other DS-ALL patients (red line). The numbers on the curves for OS and EFS represent results at 8 years. The numbers on the curves for TRM are 2-year results (during treatment only) and those for relapse are results at 8 years. SE, standard error.