Abstract
Obesity is one of the most serious health problems in developed countries. It negatively affects diverse aspects of human wellbeing. Of these, a relationship between obesity and depression is widely recognized but biomarkers for assessment of obesityassociated mood changes in animal obesity models are rarely known. Here we explored the link between obesity and the plasma levels of monoamine neurotransmitters involved in mood control using a sensitive UPLC/MSMS technique in high fat diet (HFD)- induced obesity model in male C57BL/6 mice to explore the potential utility of plasma tests for obesity-associated mood change. HFD (60% of total calories, 8 weeks) induced significantly higher weight gains in body (+37.8%) and fat tissue (+306%) in male C57BL/6 mice. Bioanalysis of serotonin, dopamine and norepinephrine in plasma at 8 weeks of HFD revealed that serotonin decreased significantly in the obese mice when compared to normal diet-fed mice (2.7 ± 0.6 vs 4.3 ± 2.0 ng/ml, N=8). Notably, a negative correlation was found between the levels of serotonin and body weight gains. Furthermore, principal component analysis (PCA) with the individual levels of neurotransmitters revealed that plasma levels of dopamine and serotonin could apparently differentiate the obese mice from lean ones. Our study demonstrated that blood plasma levels of neurotransmitters can be employed to evaluate the mood changes associated with obesity and more importantly, provided an important clue for understanding of the relationship between obesity and mood disorders.
Keywords: Serotonin, Dopamine, Norepinephrine, Obesity, Depression, High fat diet
INTRODUCTION
A close link between obesity and mood disorders has been well-established (Needham et al., 2010) and numerous epidemiological studies are supporting it (Ma and Xiao, 2010). Indeed many studies have demonstrated that mood changes can be associated with overweight conditions (McElroy et al., 2004) but the debates against it do not cease to continue, due to equally many lines of conflicting evidences (Friedman and Brownell, 1995; Atlantis and Baker, 2008; Pickering et al., 2011). Moreover, mechanistic studies explaining the relationship between obesity and mood disorders are extremely limited due to the technical difficulty in quantitative assessment of mental health or moods in animal models.
Roles of monoamine neurotransmitters like serotonin, norepinephrine and dopamine in mood modulation have been well established (Lanni et al., 2009). Attempts have been made to measure the level of the neurotransmitters in brain tissues to get a glimpse of the mood changes associated with obesity (Kimbrough and Weekley, 1984). However, brain tissue is not easy to collect and even worse, hardly accessible in human clinical studies. Instead of brain tissues, in diverse mood disorders, several studies have examined the levels of neurotransmitters in blood, extrapolated them to the brain levels and explored the link with behavior characteristics (Madsen and McGuire, 1984; Moffitt et al., 1998). However, there has been no report concerning blood neurotransmitter levels in obesity-animal model to our best knowledge.
Here we developed a sensitive, simultaneous and fast quanti tation method for the determination of serotonin, dopamine and norepinephrine in plasma using UPLC/MSMS (ultra-performance tandem mass spectrometry) and examined the impact of high fat diet (HFD)-induced obesity on the plasma levels of monoamine neurotransmitters in male C57BL/6 mice to explore the link between mood changes and obesity.
MATERIALS AND METHODS
Animal experiments
Male C57BL/6J mice, 5-6 weeks old, weighing 20 ± 2 g (Orientbio, Seoul, Korea), were housed individually in polyethylene cages in an environment with controlled temperature of 24 ± 2℃, a constant humidity of 50 ± 10%, and a 12 h lightdark cycle. The mice were acclimatized for at last 1 week prior to the experiment and were randomly assigned into different groups. Animals had a free access to a standard diet from Purina Korea or 60% Kcal high fat diet (D12492, Research Diets, New Brunswick, NJ, USA) and tap water ad libitum.
The physical activities of mice were measured at 4 weeks of HFD by counting the number of movement from end of the cage to the opposite side. After 8 weeks, bloods were collecting from retro-orbital venous plexus using sodium heparin capillary tube for the clinical chemistry changes using a Selectra E® automated analyzer and the measurement of neurotransmitters. All of the mice were satisfied and liver and epididymal fat tissue were removed and weighed.
Bioanalysis of neurotransmitters sample preparation
Simultaneous bioanalysis of monoamines in blood plasma were done with UPLC/MSMS according to the previously described method (Hammad et al., 2009) with minor modifi-cations. To 50 μl aliquots of plasma, 10 μl of 100 ng/ml dopamine- d4 (as internal standard) was added. After protein precipitation by vortex-mixing with 200 μl of acetonitrile: methanol (75:25, 2% formic acid) for 5 min, samples were centrifuged at 14,000 rpm, 4℃ for 10 min. The upper organic layer was transferred and evaporated to the dryness using Speedvac (EZ-2 Plus, Genevac, Swiss) at 40℃. The residues were reconstituted in 100 μl of acetonitrile: methanol (75:25, 0.1% formic acid) and 5 μl of sample solutions was injected onto a UPLC/MS system.
Chromatographic separation was carried out using ACQUITY UPLC system (Waters Co., Milford, MA, USA). The column was ACQUITY UPLC BEH Amide column (1.7 μm, 2.1×100 mm). The column temperature and autosampler tray temperature were maintained at 40℃ and 10℃, respectively. The mobile phase consisted of 0.1% formic acid (solvent A) and acetonitrile (solvent B). Gradient elution was as follows: isocratic elution with 70% B for 0.5 min, followed by a 2.5 min gradient to 50% B, isocratic elution with 50% B in 4.0 min, then returned to 70% B in 5.5 min. The flow rate was 0.3 ml/min and injection volume was 5 μl. MS analysis was performed using Waters Micromass Quattro Premier XE triple quadrupole mass spectrometer. The mass spectrometer was operated in the positive ESI mode with following operation conditions. Capillary voltage, 3.7 kV; ion source temperature, 120℃; desolvation temperature, 350℃; desolvation gas flow rate, 750 L/hr; cone gas flow rate, 50 L/hr. The multiple reaction monitoring mode (MRM) was used for analysis with dwell time 0.05 s per channel (dopamine; 136.6>90.7, norepinephrine; 151.8>106.7, serotonin; 159.7>114.6, dopamine-d4 (IS); 140.6>94.9. We controlled the data acquiring and process with MassLynx (Waters Co.). Standard calibration curves were obtained with spiked samples (in BSA 1% solution) with the ranges of 0.1 to 20 ng/ ml. Limit of detection (LOD) for dopamine, norepinephrine and serotonin were 0.25, 0.25 and 0.1 ng/ml, respectively.
Statistics
Values were expressed as means ± standard deviation (SD). Statistical comparisons were made using student t-test for comparison of two groups and ANOVA test for multiple group comparison with Minitab® (State College, PA, USA). Pearson’s correlation analysis was employed to test the correlation between variables. Principal component analysis (PCA), a multivariate analysis that can examine the inter-relationship of multiple factors in an unsupervised manner, was conducted for respective levels of three neurotransmitters of obese and non-obese animals.
RESULTS
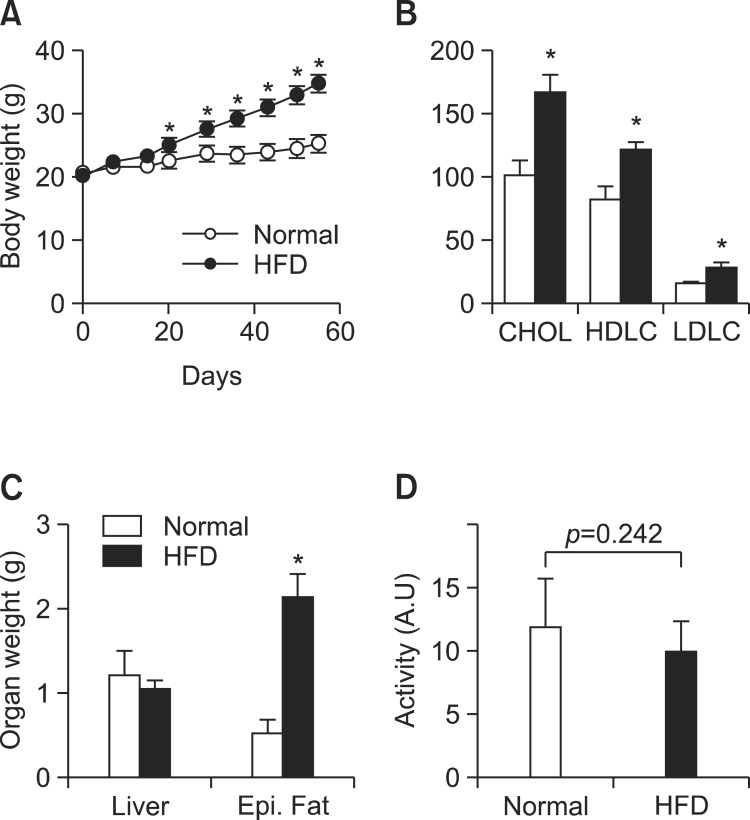
To investigate the link between obesity and mood disorders, obesity was induced in male C57BL/6J mice by high fat diet (HFD, 60% of total calories for 8 weeks). HFD induced significantly higher weight gains in body (+37.8%) and fat tissue (epididymus, +306%) (Fig. 1A and B) and consistently, LDL, HDL and cholesterol levels increased significantly (Fig. 1C), indicating the robust development of obesity. However, physical activities of obese mice were not different from those of lean animals (obese vs lean, 9.9 ± 2.5 vs 11.9 ± 3.9 as mean ± SD, p=0.297, Fig. 1D), reflecting that physical activities may not be adequate or sufficiently sensitive to diagnose obesity associated mood changes.
Fig. 1. Plasma levels of neurotransmitters in the mice treated with high fat diets. (A) body weight changes during high fat or normal diets. (B) Blood chemistry of obese and lean mice for total cholesterol, LDL and HDL. (C) Wet weights of liver and epididymal fat. (D) Physical activities as measured by the occasions of the longitudinal crossing of cages for 1 hr (at 4 week). Values are presented as a mean ± SD, N=8. *Represents significant difference from control (ANOVA or student t-test, p<0.05).
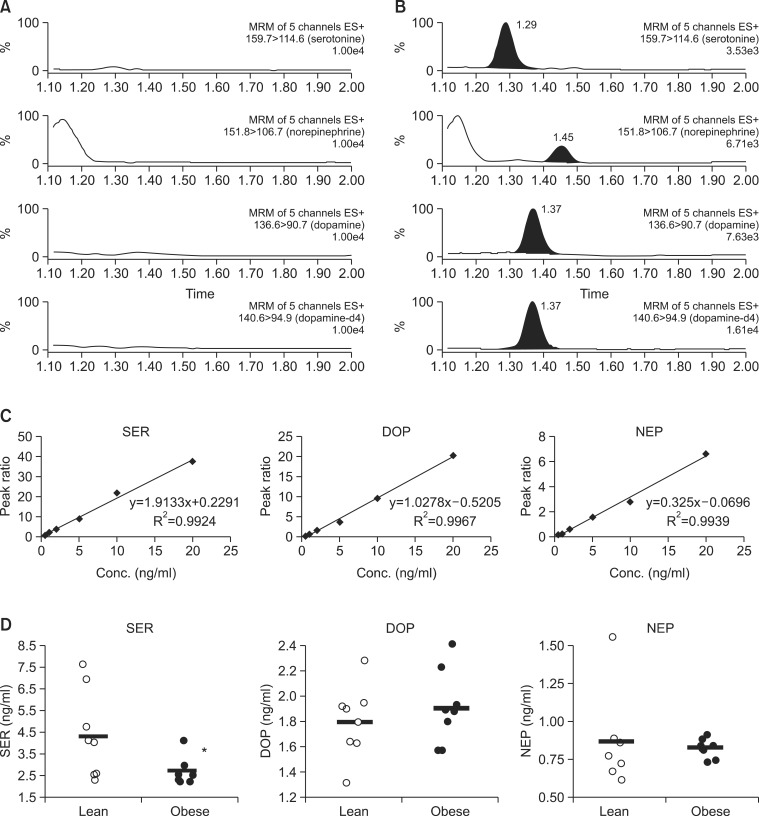
Dysregulation of monoamine neurotransmitters including serotonin, dopamine, norepinephrine in hypothalamic-pituitary- adrenal axis activity is deeply involved in mood disorders (Lanni et al., 2009). To examine if the monoamine neurotransmitter levels in plasma might be affected by HFD-induced obesity, a sensitive, simultaneous and fast bioanalytical method was developed using UPLC/MSMS for the simultaneous determination of serotonin, dopamine and norepinephrine in plasma (see the details in Methods). As seen in Fig. 2A-C, three monoamine neurotransmitters were specifically detected without any significant interference from matrix, and they could be sensitively quantified with sufficiently low limit of detection (LOD) of 0.05 (serotonin), 0.1 (dopamine) and 0.25 (norepinephrine) ng/ml. With the established method, we could found that serotonin level in blood plasma was signifi-cantly lower in the obese mice compared to lean ones (Fig. 2D, 2.7 ± 0.6 vs 4.4 ± 2.0 ng/ml, N=8, student t-test, p<0.05). In addition to serotonin, the individual levels of dopamine and norepinephrine showed slightly different distribution but statistical significances were not achieved.
Fig. 2. Plasma levels of serotonin, norepinephrine and dopamine. Peak of serotonin, norepinephrine, dopamine and IS (dopamine-d4) in blank plasma (A) and spiked plasma (B). (C) Calibration curves of three neurotransmitters in mouse plasma. (D) Plasma levels of monoamine neurotransmitters. Values are presented as a mean ± SD, N=8. *Represents significant difference from control (ANOVA or student t-test, p<0.05).
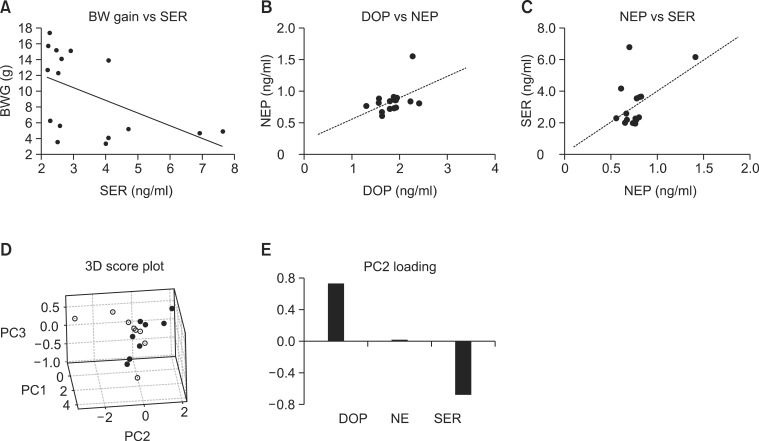
Notably, a significant correlation was found between the individual levels of serotonin and body weight gains (Fig. 3A) as determined by Pearson’s correlation analysis (Coeff.=-0.512, p<0.05), indicating that blood serotonin levels may be affected by body weight gain indeed. Interestingly, weak correlations between respective neurotransmitter levels of individual animals could also be found, such as those between dopamine and norepinephrine (Coeff.=0.465, p=0.070, Fig. 3B), and between serotonin and norepinephrine (Coeff.=0.489, p=0.054, Fig. 3C).
Fig. 3. Relationship between plasma neurotransmitters and obesity. (A) Correlation curve of body weight gain (BWG) vs serotonin (SER), (B) dopamine (DOP) vs norepinephrine (NEP). (C) SER vs NEP. Principal component analysis was conducted with the normalized levels of neurotransmitters. (D) 3D score plot for PC1, PC2 and PC3. Filled circles represent HFD-fed mice and hollow circles, normal diet-fed mice (E) Loading plot for PC2.
To further address the relationship of respective neurotransmitters with HFD-induced obesity, a multivariate analysis, principal component analysis (PCA) which can examine the inter-relationship of multiple metabolites or mRNAs in an unsupervised manner (Xia and Wishart, 2011), was conducted with the neurotransmitter levels. PCA with the levels of neurotransmitters in plasma revealed that the obese mice (HFD-fed mice, filled circles) can be differentiated from lean ones (normal diet-fed mice, hollow circles) along the principal component 2 (PC2) axis (Fig. 3D). As shown in the loadings of PC2 (Fig. 3E), the levels of dopamine and serotonin contributes to the separation of the obese mice from lean ones in opposite ways. Positive loading of dopamine and negative of serotonin suggested that dopamine may be positively related with obesity while serotonin, negatively correlated.
DISCUSSION
In the present study, we demonstrated that blood serotonin levels were significantly lower in HFD-induced obese animals than lean ones. Serotonin deficiency is well-known to be associated with onset and development of depression (Jans et al., 2007), indicating that the deficiency of serotonin in obese mice might explain the depressive moods associated with obesity. Indeed, Kimbrough and Weekley (1984) have already demonstrated that HFD decreases brainstem serotonin levels in SD rats. We newly found here, that circulating serotonin levels can be also lowered by obesity. However, plasma serotonin levels may be a better surrogate biomarker for mood change in obesity than brain serotonin levels in terms of tissue accessibility.
We could also find that there may be correlations between monoamine neurotransmitter levels in blood of individual animals. Principal component analysis revealed that blood dopamine level as well as serotonin were strongly correlated with the extent of obesity. In contrast to the relationship between serotonin and obesity, that between dopamine and obesity was difficult to interpret. In depressive patients, dopamine is generally down-regulated (Klimek et al., 2002), suggesting that higher dopamine in obese mice depression cannot be explained by the tendency towards depression. Dopamine is involved in the reward system of the brain, arousing feelings of enjoyment and reinforcement to motivate a person to perform or reiterate certain activities (Wang et al., 2002). Therefore, the dysregulation of dopaminergic pathway is commonly involved in addictive behaviors such as binge food, sex and drugs of abuse. Recently, it was demonstrated that obese rats have dysregulated dopamine D2 receptors, which induces uncontrolled and compulsive feeding behaviors to palatable fat-rich diets (Johnson and Kenny, 2010). In this regard, the increase of dopamine in obese mice may be associated with the dysregulated dopaminergic signaling and craving for HFD (Corwin et al., 2011) although further studies are necessary to confirm it.
In conclusion, we newly found that the plasma levels of serotonin were decreased by HFD-induced obesity and those of dopamine may be also related. These results support that mood can be profoundly affected by obesity through the alterations in the levels of neurotransmitters. In addition, plasma neurotransmitters can be used to assess obesity-associated mood changes.
Acknowledgments
This work was supported by the Ewha Womans University Research Grant of 2013 to SJ Bae.
References
- 1.Atlantis E., Baker M. Obesity effects on depression: systematic review of epidemiological studies. Int. J. Obes. (Lond) (2008);32:881–891. doi: 10.1038/ijo.2008.54. [DOI] [PubMed] [Google Scholar]
- 2.Corwin R. L., Avena N. M., Boggiano M. M. Feeding and reward: perspectives from three rat models of binge eating. Physiol. Behav. (2011);104:87–97. doi: 10.1016/j.physbeh.2011.04.041. [DOI] [PMC free article] [PubMed] [Google Scholar]
- 3.Friedman M. A., Brownell K. D. Psychological correlates of obesity: moving to the next research generation. Psychol. Bull. (1995);117:3–20. doi: 10.1037/0033-2909.117.1.3. [DOI] [PubMed] [Google Scholar]
- 4.Hammad L. A., Neely M., Bridge B., Mechref Y. Fast liquid chromatography separation and multiple-reaction monitoring mass spectrometric detection of neurotransmitters. J. Sep. Sci. . (2009);32:2369–2376. doi: 10.1002/jssc.200900158. [DOI] [PubMed] [Google Scholar]
- 5.Jans L. A., Riedel W. J., Markus C. R., Blokland A. Serotonergic vulnerability and depression: assumptions, experimental evidence and implications. Mol. Psychiatry . (2007);12:522–543. doi: 10.1038/sj.mp.4001920. [DOI] [PubMed] [Google Scholar]
- 6.Johnson P. M., Kenny P. J. Dopamine D2 receptors in addiction-like reward dysfunction and compulsive eating in obese rats. Nat. Neurosci. (2010);13:635–641. doi: 10.1038/nn.2519. [DOI] [PMC free article] [PubMed] [Google Scholar]
- 7.Kimbrough T. D., Weekley L. B. The effect of a high-fat diet on brainstem and duodenal serotonin (5-HT) metabolism in Sprague-Dawley and Osborne-Mendel rats. Int. J. Obes. . (1984);8:305–310. [PubMed] [Google Scholar]
- 8.Klimek V., Schenck J. E., Han H., Stockmeier C. A., Ordway G.A. Dopaminergic abnormalities in amygdaloid nuclei in major depression: a postmortem study. Biol. Psychiatry . (2002);52:740–748. doi: 10.1016/S0006-3223(02)01383-5. [DOI] [PubMed] [Google Scholar]
- 9.Lanni C, Govoni S, Lucchelli A., Boselli C. Depression and antidepressants: molecular and cellular aspects. Cell. Mol. Life Sci. (2009);66:2985–3008. doi: 10.1007/s00018-009-0055-x. [DOI] [PMC free article] [PubMed] [Google Scholar]
- 10.Ma J., Xiao L. Obesity and depression in US women: results from the 2005-2006 National Health and Nutritional Examination Survey. Obesity (Silver Spring) (2010);18:347–353. doi: 10.1038/oby.2009.213. [DOI] [PubMed] [Google Scholar]
- 11.Madsen D., McGuire M. T. Rapid communication whole blood serotonin and the type A behavior pattern. Psychosom. Med. (1984);46:546–548. doi: 10.1097/00006842-198411000-00007. [DOI] [PubMed] [Google Scholar]
- 12.McElroy S. L., Kotwal R., Malhotra S., Nelson E. B., Keck P. E., Nemeroff C. B. Are mood disorders and obesity related? A review for the mental health professional. J. Clin. Psychiatry . (2004);65:634–651. doi: 10.4088/JCP.v65n0507. quiz 730. [DOI] [PubMed] [Google Scholar]
- 13.Moffitt T. E., Brammer G. L., Caspi A., Fawcett J. P., Raleigh M., Yuwiler A., Silva P. Whole blood serotonin relates to violence in an epidemiological study. Biol. Psychiatry . (1998);43:446–457. doi: 10.1016/S0006-3223(97)00340-5. [DOI] [PubMed] [Google Scholar]
- 14.Needham B. L., Epel E. S., Adler N. E., Kiefe C. Trajectories of change in obesity and symptoms of depression: the CARDIA study. Am. J. Public Health . (2010);100:1040–1046. doi: 10.2105/AJPH.2009.172809. [DOI] [PMC free article] [PubMed] [Google Scholar]
- 15.Pickering R. P., Goldstein R. B., Hasin D. S., Blanco C., Smith S.M., Huang B., Pulay A. J., Ruan W. J., Saha T. D., Stinson F. S., Dawson D. A., Chou S. P., Grant B. F. Temporal relationships between overweight and obesity and DSM-IV substance use, mood, and anxiety disorders: results from a prospective study, the National Epidemiologic Survey on Alcohol and Related Conditions. J. Clin. Psychiatry . (2011);72:1494–1502. doi: 10.4088/JCP.10m06077gry. [DOI] [PMC free article] [PubMed] [Google Scholar]
- 16.Wang G. J., Volkow N. D., Fowler J. S. The role of dopamine in motivation for food in humans: implications for obesity. Expert Opin. Ther. Targets . (2002);6:601–609. doi: 10.1517/14728222.6.5.601. [DOI] [PubMed] [Google Scholar]
- 17.Xia J., Wishart D. S. Web-based inference of biological patterns, functions and pathways from metabolomic data using MetaboAnalyst. Nat. Protoc. (2011);6:743–760. doi: 10.1038/nprot.2011.319. [DOI] [PubMed] [Google Scholar]


