

Abstract
Giardia lamblia (syn G. intestinalis, G. duodenalis) is the most common pathogenic intestinal parasite of humans worldwide and is a frequent cause of endemic and epidemic diarrhea. G. lamblia is divided into eight genotypes (A–H) which infect a wide range of mammals and humans, but human infections are caused by Genotypes A and B. To unambiguously determine the relationship among genotypes, we sequenced GS and DH (Genotypes B and A2) to high depth coverage and compared the assemblies with the nearly completed WB genome and draft sequencing surveys of Genotypes E (P15; pig isolate) and B (GS; human isolate). Our results identified DH as the smallest Giardia genome sequenced to date, while GS is the largest. Our open reading frame analyses and phylogenetic analyses showed that GS was more distant from the other three genomes than any of the other three were from each other. Whole-genome comparisons of DH_A2 and GS_B with the optically mapped WB_A1 demonstrated substantial synteny across all five chromosomes but also included a number of rearrangements, inversions, and chromosomal translocations that were more common toward the chromosome ends. However, the WB_A1/GS_B alignment demonstrated only about 70% sequence identity across the syntenic regions. Our findings add to information presented in previous reports suggesting that GS is a different species of Giardia as supported by the degree of genomic diversity, coding capacity, heterozygosity, phylogenetic distance, and known biological differences from WB_A1 and other G. lamblia genotypes.
Keywords: genotype, parasitology, diplomonad, synteny, heterozygosity
Introduction
Giardia lamblia (syn. G. intestinalis, G. duodenalis) is the most common parasitic pathogen identified in humans in developed countries including the United States. Infection is even more common in developing countries, where children are often infected by early childhood (Gilman et al. 1985, 1988). The reported outcomes of infection in developing countries are variable. Some studies have documented the common occurrence of malnutrition and growth retardation, even when infections are otherwise asymptomatic (Al-Mekhlafi et al. 2005; Celiksoz et al. 2005; Prado et al. 2005). A recent meta-analysis suggested that malnutrition correlated with persistent diarrhea in patients with giardiasis (Muhsen and Levine 2012). In other reports, Giardia infections have been innocuous (Hollm-Delgado et al. 2008). The reason for variable disease manifestations are not known, but the type of infecting Giardia and/or ability to express certain variant-specific surface proteins (VSPs) (Nash 2002) may be important.
Giardia was divided into multiple species on the basis of the host from which the organism was obtained, but in 1952, Filice (1952) designated three species on the basis of microscopic findings: G. agilis (amphibians), G. muris (rodents), and G. lamblia (mammals and birds). Subsequently, G. lamblia was divided into several species on the basis of differences found at the ultrastructural and molecular level, including G. microti (rodents), G. psittaci (psittacine birds), and G. ardeae (herons) (Adam 2001). All isolates that remain within G. lamblia are mammalian parasites. However, even the organisms that are still called G. lamblia differ in host specificity and are currently assigned to eight different genotypes or assemblages (A–H) that have varied host specificities. The isolates that infect humans fall within Genotypes A and B. In the earliest studies, G. lamblia isolates of human origin and some of animal origins were unambiguously divided into three groups on the basis of antigenic and molecular differences (Nash and Keister 1985; Nash et al. 1985). Group 3, which included the GS isolate, was highly different from Groups 1 and 2 and in 1985 was proposed as possibly representing a distinct species. Multiple subsequent studies have confirmed the marked difference of Group 3 from Groups 1 and 2. The few sequence comparisons that have been reported have found approximately 98–99% nucleotide identity between Groups 1 and 2 (Baruch et al. 1996; Cooper et al. 2007), but for Group 3, some regions vary so much that they cannot be easily aligned with Groups 1 or 2 (Baruch et al. 1996). Currently, Groups 1 and 2 are referred to as Genotypes A1 and A2, while the Group 3 isolates belong to Genotype B. The isolate used for the Giardia genome project, WB (Morrison et al. 2007), is from Genotype A1. However, the majority of human infections throughout the world have been from Genotypes A2 and B (Haque et al. 2005; Caccio and Ryan 2008; Cooper et al. 2010). GS (Nash and Keister 1985; Nash et al. 1985), the most studied Genotype B isolate, differs from WB and other Genotype A1 isolates in a variety of biological important ways. In human volunteer studies, GS consistently infected normal volunteers, while ISR (Genotype A1) was unable to induce infections (Nash et al. 1987). GS was more pathogenic than WB in gerbils (Aggarwal and Nash 1987; Solaymani-Mohammadi and Singer 2011). GS readily infects neonatal or adult mice, while WB infects neonatal mice (Byrd et al. 1994) but infects adult mice only when they have been treated with antibiotics (Solaymani-Mohammadi and Singer 2011). In the adult mouse infection model, GS readily causes intestinal disaccharidase deficiency, whereas WB infection does not (Solaymani-Mohammadi and Singer 2011). GS demonstrated greater susceptibility to nitric oxide than WB and several Genotype A2 field isolates (Benere et al. 2012). Both WB and GS can be transfected by electroporation, but the outcomes of transfection differ. When circular DNA is introduced into WB, it replicates episomally, but when linear DNA is introduced, it integrates by homologous recombination (Singer et al. 1998). In contrast, circular or linear DNA can be introduced into GS by homologous recombination, but episomal replication does not occur. Both WB and GS undergo antigenic variation of a large family of vsp genes, but the vsp gene repertoires and antigenicity of expressed VSPs (Nash, Conrad et al. 1990) are substantially different and even the rate of antigenic variation is much faster for GS (average 6 generations) than for WB (average 13 generations) (Nash, Banks et al. 1990). Relatively few biological comparisons have used isolates other than WB or GS; therefore, it is not yet certain which of these biological differences can be generalized to their respective genotypes and which are isolate-specific differences. In addition, there are insufficient data for the Genotype A2 isolates to determine which Genotype A2-specific biological differences exist. Perhaps, the best-characterized Genotype A2 isolates have been DH and JH, which were obtained from siblings with symptomatic infections (Nash and Keister 1985; Nash et al. 1985). The extension of these studies to other Genotype A and B isolates will be facilitated by in-depth sequences of the GS and DH isolates to complement the currently available WB sequence.
The WB genome is currently at an unfinished state of 90 scaffolds or super contigs, which is an assembly created by standard and long clones as well as BACs from 306 contigs (Morrison et al. 2007). An optical map was used to refine the original physical map and to overlay the contigs along the five chromosomes (Perry et al. 2011). In addition, a draft sequence sampling of the GS isolate has been reported (Franzen et al. 2009). We were interested in determining a more complete genome sequence of a Genotype B isolate, with sufficient depth and coverage to allow accurate synteny analyses between genotypes and identification of a more complete set of Genotype B vsp genes. In addition, the common association of Genotype A2 with human infections led us to sequence the Genotype A2 isolate DH. Here, we report deep next-generation sequencing of both the GS and DH isolates and compare these newly obtained and assembled genome sequences with each other and with the previously reported WB (A1) (Morrison et al. 2007) and pig P15 (E) isolates (Jerlstrom-Hultqvist et al. 2010).
Our results describe the conserved genomic coding and overall genomic structure in common between these diverse genotypes, unique features of each genotype, and evidence that recombination events within and between chromosomes have occurred in the evolutionary history of these isolates. Our analysis of these results along with multilocus phylogenetic analyses suggest that Genotype B warrants designation as a separate species, but that Genotypes A1 and A2 belong to the same species.
Materials and Methods
The naming convention used in this report employs the isolate name followed by an underscore and the genotype. Thus, the WB genome is designated as WB_A1 and our new GS and DH genomes as GS_B and DH_A2, respectively. The draft GS genome by Franzen et al. (2009) is designated as GB_B (using the Giardia GB designation already in use at GiardiaDB [http://www.Giardiadb.org, last accessed December 16, 2013]) and the draft pig P15 Genotype E genome (Jerlstrom-Hultqvist et al. 2010) as Pig_E.
Parasite Isolates and Culture Conditions
The GS isolate was obtained from a symptomatic human and initially characterized as Group 3 (now Genotype B) isolate in 1985 (Nash and Keister 1985; Nash et al. 1985). GS was isolated by two methods, direct axenization (called GS/E) and by inoculation of neonatal mice (GS/M). No phenotypic differences have been identified between the two, so we are referring to the isolate simply as GS. As noted above, the DH isolate was also described in 1985 as Group 2 (now Genotype A2). Organisms were cultured in modified TYI-S33 as previously described (Keister 1983), harvested in late log or early stationary phase by centrifugation at 2000× g for 10 min, and washed in phosphate-buffered saline followed by centrifugation.
Isolation of Genomic DNA from Giardia (Trophozoite) Pellets
Trophozoite pellets were resuspended in 600 µl of Wash Buffer (50 mM Tris–HCL, pH7.6, 50 mM EDTA, 50 mM d-glucose, 0.5 mg/ml proteinase K) and subjected to five rapid freeze–thaw cycles. Another 10 ml of prewarmed Wash Buffer was added and incubated at 37 °C for 10 min followed by the addition of 10% sodium dodecyl sulfate solution to a final concentration of 2% and incubated at 65 °C for 5 min. RNA was removed with DNAse-free RNase A (Qiagen). Genomic DNA was extracted using three-fourths volume buffered phenol followed by three extractions with phenol:chloroform:isoamyl alcohol and a final extraction with chloroform:isoamyl alcohol. DNA was precipitated by one-tenth volume 3 M sodium acetate (pH 5.0) and 1.6 volumes of 100% EtOH, washed three times with 4 °C 70% EtOH, and dried. DNA was resuspended in 500 µl TE pH 8.0 and underwent two additional rounds of RNA removal using Epicentre’s RiboShredder RNase Blend (Epicentre Biotechnologies, Madison, WI). Clean up after each round of RNA removal was performed following Qiagen’s MaXtract (Qiagen, Valencia, CA) protocol with the final resuspension of genomic DNA in 125 µl EB. The genomic DNA was analyzed by agarose gel electrophoresis and determined to be of high molecular weight and purity with a 260/280 absorption ratio between 1.6 and 1.8 for each extraction.
Library Construction and Next-Generation DNA Sequencing
For the GS genomic DNA, Rapid Fragment, 3 kb and 8 kb paired-end libraries were constructed using Paired End Library Preparation Method Manual—3 kb Span (October 2009) and Paired End Library Preparation Method Manual—20 kb and 8 kb Span (October 2009) (Roche Applied Science, Mannheim Germany), respectively. During the 8 kb library preparation, section 3.4, step 3, the extracted fragments were alternatively purified using a Qiagen Minelute Gel Extraction Kit and eluted twice in 20 µl EB buffer instead of being processed as written in the protocol. The samples were then prepared for 454 DNA sequencing using emPCR Method Manual—Lib-L LV (October 2009, Rev. Jan 2010) (Roche Applied Science, Mannheim, Germany) amplified at a ratio of 1 copy-per-bead, prior to loading each library on a single region of a 2-region slide.
For the DH genomic DNA, Rapid fragment, 3 kb, 6 kb, and 8 kb paired-end libraries were constructed following the manufacturer’s protocols (Roche Applied Science) with the following modification. The 8 kb size selected library fragment was purified using a Qiagen Gel Purification Kit instead of the Elutrap (Whatman, Piscataway, NJ). Preparation of templated DNA Capture beads for next-generation sequencing followed the emPCR Method Manual-Lib-L-LV (Roche Applied Science). Beads for the fragment library were amplified with a two copy per bead template input, and the paired-end libraries were amplified with a one copy per bead input. Enriched DNA Capture beads were sequenced on the 454 (Roche Applied Science) using FLX Titanium chemistry per the manufacturer’s instructions on a full 2-region slide for the fragment library and one region of a 2-region slide for each of the three paired-end libraries.
DNA Sequence Assembly and Annotation
Genomic DNA sequencing of GS on the Genome Sequencer FLX generated a total of 3,019,027 usable fragment and paired-end reads, with an average read length of 211 bases resulting in 53× coverage. Sequencing of DH generated 4,996,200 usable fragment and paired-end reads, with an average read length of 265 bases resulting in 124× coverage. De novo genome assembly was performed using MIRA v3.0 and NEWBLER v2.5 (454 Life Sciences). The MIRA and NEWBLER assemblies were combined using Sequencher v4.9 (Gene Codes). The resulting contigs were further refined, corrected, or verified by three rounds of mapping of the 454 reads to the contigs using GS Reference Mapper (454 Life Sciences). Contigs less than 1 kb were discarded. This resulted in 544 contigs with a total genome length of 12,017,449 bp for GS and 239 contigs with a total genome length of 10,703,894 bp for DH.
Open reading frame (ORF) calling was performed using public and proprietary algorithms, with a minimum length cutoff of 30 amino acids, as previously described (DelVecchio et al. 2002; Kapatral et al. 2002; Ivanova et al. 2003). After the automated processing, the annotations were further refined manually to provide the most complete and up-to-date descriptions for Giardia. To give uniformity to the comparisons, we reannoted WB_A1 by the same method we used for DH_A2 and GS_B. This new annotation yielded ORF assignments, ORF counts, and ORF annotations similar to the annotation statistics available on GiardiaDB (http://www.Giardiadb.org, last accessed December 16, 2013) (data not shown).
vsp Gene Search and identification
vsp genes were identified using previously described methods (Adam et al. 2010). Briefly, the following criteria were used: 1) presence in the translated sequence of a CRGKA C-terminal motif such that no more than one amino acid variation was allowed, 2) a BlastP hit against the 38 amino acid residue carboxy terminal sequence, 3) a positive hit for the key word “variant” in the pfam annotation nomenclature, and 4) a positive psi-Blast of the conserved 38 amino acid residue tail sequence at an alignment length of greater than 29 bases and a mismatch rate less than 11.
Ortholog Identification and Genotype-to-Genotype Comparative ORF Analysis
Orthologous genes are defined as homologous genes, which originated from a common ancestor, and subsequently diverged from the original sequence, usually maintaining the same function. We determined orthologs using the previously described Reciprocal Best Hits (RBH) method (Moreno-Hagelsieb and Latimer 2008) following the authors’ recommendations where orthologs are assumed if two genes from two different genomes have the best hit and a minimum of at least 50% coverage exists for any of the protein sequences in the alignment. The lowest e-value was selected if two or more hits had identical bit scores. Unique genes were defined as genes that lacked 50% protein alignment or more with a best hit. Once orthologous genes or predicted ORFs from each genome pair were determined, those ORFs were then matched together to determine the common orthologs for the two-, three-, and four-way analyses.
Single and Multilocus Phylogenetic Analysis
Protein sequences were first aligned using ClustalW2 (Clustal 2.1 multiple sequence alignment, Conway Institute UCD, Dublin, Ireland) for each group of genes. Phylogeny was then determined by Bayesian Inference using Parallelized MrBayes v3.2.2 (Huelsenbeck and Ronquist 2001; Ronquist and Huelsenbeck 2003; Altekar, et al. 2004), with the final tree taken from the posterior output summary of two runs for each gene analyzed. For the combined phylogenetic tree, the individual alignments were concatenated using FASconCAT (Kuck P. & Meusemann K., v1.0, Zool. Forschungsmuseum A. Koenig, Germany, 2010) to produce a supermatrix of the alignments, and analysis of phylogeny was performed using MrBayes, as above. Accession numbers and locus tag ID for all genes used in the phylogenetic analysis are listed in supplementary file S2, Supplementary Material online.
Chromosome Assembly and Comparative Analysis
Comparison of the DH_A2 and GS_B contigs to the WB A1 chromosomes 1–5 (Morrison et al. 2007) was performed by first downloading all the WB contig sequences from NCBI, accession numbers AACB02000001 to AACB02000306. These contig sequences were then concatenated or arranged in order as described by the recently reported optical map (Perry et al. 2011), into the five chromosome sequences. Mauve (Darling et al. 2004) “move contigs” was performed using WB_A1 chromosomes 1 through 5 as the reference and our DH_A2 and GS_B contigs as the query sequence. Intact, small, non-matching contigs and contigs with extremely low percentages of sequence identity were removed by manual analysis from the contig query set and the move contigs process was repeated. The removal of small, non-matching contigs was in the order of <5–10% of the total base count of the entire contig assemblies for DH_A2 and GS_B, respectively. In cases where there were contigs with a very low percentage of mapped sequence, we ran the “move contig” process with the “iterative refinement” parameter to improve alignment accuracy, while maintaining contig integrity and locational assignment. Final mapping order of the contigs for DH_A2 and GS_B was then saved and Mauve images were exported for analysis and figure construction.
PCR Confirmation of Selected Translocation, Inversion, and Sequence Divergence Regions
PCR Primers were designed (where one primer aligned to flanking genomic DNA sequence and the other aligned to one end of the inversion, translocation, or divergent regions) using Primer 3 (http://frodo.wi.mit.edu/primer3/input.htm, last accessed December 16, 2013) incorporating a 1 bp C/G clamp and targeting a Tm of 60 °C. Primers designed were located at least 1,000–1,500 bp away from the junction boundary of the inversion, translocation, or divergent sequence regions. PCR was carried out using Advantage Genomic LA Polymerase from Clontech (Mountain View, CA) following the manufacturer’s recommendations with an extension time of 10 min and 33 cycles. The sizes estimated by electrophoretic separation were compared with the sizes determined by sequencing. For some of the PCR products generated, Sanger sequencing was performed and that sequence was compared back to the assembled sequence for the region tested. Supplementary file S1, Supplementary Material online, shows primer names, sequences, positions of primers within contigs, predicted size, and lanes on the gel image.
Public Data Genome Submission
Genome assembly contig sequence and annotation files have been deposited in GenBank under the following accession numbers: DH_A2: AHGT00000000 and GS_B: AHHH00000000. The assemblies with annotations for GS_B and DH_A2 have also been uploaded to GiardiaDB and will be available at the time of publishing.
Results
Genome assembly data for Giardia genomes sequenced to date are shown in table 1. A comparison between the genome data for GS_B and the previously published GB_B (Franzen et al. 2009) confirms the greater depth of coverage of GS_B and higher quality assembly as demonstrated by the smaller number of contigs (table 1). Therefore, all subsequent analyses utilize the GS_B assembly. The Pig_E genome has less depth of coverage than GS_B and DH_A2, and it lacks paired-end data; however, its mean contig length is higher than the GB_B genome (14,051 for Pig_E compared with 3,753 for GB_B), most likely reflecting the greater fragment sequencing depth performed for this genome. Because of this level of quality and the fact that it is the only nonhuman origin Giardia isolate sequenced to date, the Pig_E genome is included here for some of the comparative analyses.
Table 1.
A Comparison of Genomic Features of Giardia Genomes Sequenced to Date
| Isolate_Genotype | WB_A1 | GS_B | GB_B | Pig_E | DH_A2 |
|---|---|---|---|---|---|
| Bases in contigs | 11, 213, 615 | 12,017,449 | 11,001,532 | 11, 522, 052 | 10, 703, 894 |
| Percent-coding region (%) | 82.76 | 86.35 | 74.44 | 79.62 | 89.54 |
| GC (%) | 49.25 | 48.25 | 47.26 | 47.24 | 49.04 |
| Heterozygosity (%) | <0.01 | 0.425 | 0.0023 | 0.037 | |
| Contigs | 92a | 544 | 2,931 | 820 | 239 |
| Largest contig size (bp) | 1,886,627 | 255,388 | 149,277 | 191,544 | 434,863 |
| Mean contig length (bp) | 121,887 | 22,090 | 3,753 | 14,051 | 44,786 |
| Protein-coding ORFs | 5,901 | 7,477 | 4,470 | 5,008 | 6,724 |
| ORFs with assigned function | 2,905 | 3,946 | 2,842 | 2,752 | 2,900 |
| ORFs without assigned function | 2,996 | 3,531 | 1,628 | 2,253 | 3,824 |
| ORFs in asserted pathways | 710 | 942 | 841 | 680 | 656 |
| ORFs not in asserted pathways | 5,191 | 6,535 | 3,629 | 4,328 | 6,068 |
| ORFs with assigned function, but no pathway | 2,196 | 3,005 | 2,005 | 2,073 | 2,245 |
aNumber of scaffolds. The WB isolate has 306 contigs.
The size of the assembled GS_B genome is 12,017,449 bp, which is substantially larger than the other genomes (table 1). In contrast, the 10,703,894 bp size for DH_A2 makes it the smallest assembled Giardia genome to date. Pig_E has a smaller number of ORFs than the smaller genomes, WB_A1 and DH_A2, but this may be an artifact of a less complete assembly as demonstrated by the higher contig numbers (820) than for WB_A1 (306) or DH_A2 (239). The increased number of contigs results in a greater number of truncated ORFs. In addition, the lack of paired-end data can also generate misassemblies, which may result in ORF fragmentation. The GC percentages analysis for WB_A1 and DH_A2 are nearly the same at 49.25% and 49.04%, while GS_B is slightly lower at 48.25% (table 1).
Heterozygosity Analysis of DH_A2 and GS_B
We analyzed the frequency of allelic sequence heterozygosity by mapping our sequencing reads back to the respective contig sets. A defined heterozygous site required 10-fold coverage and at least 15% of the base calls variant. For DH_A2, 99.7% of the assembly had at least 10-fold coverage and had a heterozygosity level of 0.037%. GS_B (10-fold coverage of 98.6%) had a heterozygosity level of 0.425%, while the heterozygosity levels reported for WB_A1 and Pig_E were <0.01% (Morrison et al. 2007) and 0.0023% (Jerlstrom-Hultqvist et al. 2010), respectively. Thus, there is a 200-fold difference in heterozygosity levels between the highest and lowest.
vsp Gene Survey
Comparison of the vsp gene numbers and the proportion of vsp genes to the entire genome (Adam et al. 2010) (table 2) revealed that DH_A2 had the lowest proportion of vsp ORFs to total ORFs (ratio) at 2.8%, while GS_B showed the highest with 503 vsp genes, comprising 6.5% of the genome. WB_A1 and Pig_E were intermediate at 4.1% and 3.8%, respectively. When using the more stringent criterion of requiring at least four of the five amino acids of the C-terminal CRGKA to be present (and eliminating any genes that are incomplete at the 3′ end), the numbers ranged from 121 in DH_A2 to 275 in GS_B, while WB_A1 is intermediate at 186. The requirement of the CRGKA underestimates the number of vsp genes in WB_A1, where a detailed analysis identified approximately 270 vsp genes (Adam et al. 2010).
Table 2.
Comparison of vsp Gene Search Methods and Results for Each Giardia Isolate
| Isolate_ Genotype | CRGKAa | Meets One of Three vsp Criteriab | Meets All Three Criteria Plus psi-Blastc | Ratio of vsp to Total ORFsd (%) |
|---|---|---|---|---|
| Pig_E | 123 | 189 | 104 | 3.8 |
| DH_A2 | 121 | 190 | 94 | 2.8 |
| WB_A1 | 186 | 244 | 119 | 4.1 |
| GS_B | 275 | 503 | 197 | 6.7 |
| GB_B | 14 | 41 | 10 | 0.92 |
aNumbers were obtained by word search using the conserved C-terminal sequence of CRGKA, +/− a single amino acid variation.
bNumbers represents the total vsp genes found in at least one of three separate analyses. The first is the CRGKA word search shown in the second column. Second, we performed a Blast search against the ORFs from each genome using a conserved encoded 38 amino acid VSP tail sequence. Third, we used a keyword search of Pfam descriptions.
cNumber of vsp genes found in all three analyses in addition to a psi-Blast using the same 38 base tail sequence with the requirement of alignment length of greater than 29 bases and a mismatch rate less than 11.
dThe ratio of vsp genes fulfilling one of the first three criteria (third column) to the total ORFs for each genome (expressed as a percent).
Comparative ORF Analysis between Genomes
We determined the best orthologs between genomes (Moreno-Hagelsieb and Latimer 2008) using the all-inclusive approach of the RBH. Our analyses encompassed all possible pairwise, three-way, and four-way comparisons of the four genomes (fig. 1). In contrast to previous ORF analyses, members of the large multigene families such as vsp genes, the High Cysteine Membrane Protein (HCMP) genes, the ankyrins, and the NIMA-related Kinases (NEKs) (Franzen et al. 2009; Jerlstrom-Hultqvist et al. 2010) were included in the analyses because it is important to know whether vsps or members of other multigene families were conserved or unique across genomes or genotypes.
Fig. 1.—
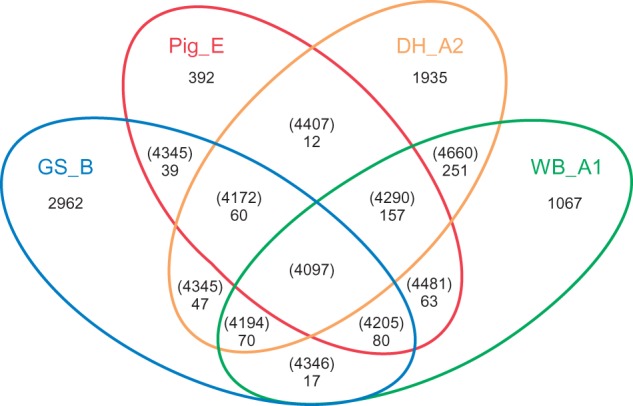
Venn diagram of the common and unique full-length ORFs of Giardia lamblia isolates. Diagram shows both unique and shared gene content of four G. lamblia genomes as derived by ortholog analysis. Numbers in parentheses represent unique numbers of ORFs per genomes and within intersections between genomes. Numbers not in parentheses represent conserved ORFs within intersections of comparison that are unique relative to the other genomes.
The intersection of all four genotypes reveals 4,097 ORFs that represent the core set of orthologs with the same function or activity in all four genomes. This core set of ORFs contains many of the housekeeping and subunit proteins and enzymes previously described as most likely essential in the WB_A1 genome (Morrison et al. 2007). For example, all four genomes contain two actin genes and several actin-like genes, two related copies of alcohol dehydrogenase, the panel of ribosomal subunits, four methyl-accepting chemotaxis genes, and similar complements of many other house-keeping genes and subsets of genes (supplementary file S1, Supplementary Material online). Only 27 vsp genes fulfilled the criteria for orthology, illustrating the substantial degree of diversification of the vsp gene families during the evolution of these organisms.
GS_B contains the greatest number of unique or heterologous ORFs relative to the other three genomes at 2,962 (fig. 1 and supplementary file S1, Supplementary Material online). DH_A2 is second at 1,935, followed by WB_A1 and Pig_E at 1,067 and 392, respectively (fig. 1 and supplementary file S1, Supplementary Material online). Although GS_B has many more unique ORFs than WB_A1 and DH_A2, it still lacks any evidence of tyrosine-specific kinases, histidine kinases, superoxide dismutase, or catalase-encoding genes, which were also absent from WB_A1 (Morrison et al. 2007).
Comparison of numbers of orthologs among the isolates revealed that Genotypes A1 and A2 are the most closely related and that Pig_E is closer to Genotypes A1 and A2 than to Genotype B. In addition, the pairwise and three-way comparisons each distinguished GS_B as having the greatest number of unique and lowest number of shared ORFs (fig. 1 and supplementary file S1, Supplementary Material online). Tables of ORFs along with their annotations, which are conserved (orthologous) or unique (heterologous) for all comparisons, are presented in supplementary file S1, Supplementary Material online. For the pairwise ortholog tables, between 0.2% and 1.3% of the annotations do not fully agree (supplementary file S1, Supplementary Material online), highlighting the difficult nature of reconciling gene functions of independently annotated genomes.
Single and Multi-Locus Phylogenetic Analysis
In order to determine whether the relative distances estimated by the above genome comparisons are consistent with phylogenetic comparisons, we evaluated the relationship between the four genotypes in the context of distant and related taxa. The ribosomal subunit S12E genes from each of the four Giardia genotypes were aligned with S12E genes from multiple protozoans (fig. 2). As can be seen in this phylogenetic tree, GS_B branches before Pig_E and the two Genotype A isolates, suggesting that GS may have branched earlier than the other three genomes from a common ancestor. The DH_A2 and WB_A1 genotypes demonstrate little to no left to right branch length difference between them, suggesting recent evolutionary divergence between the two. In addition, the branch lengths and distances between Genotypes B (GS_B), E (Pig_E), and A (WB_A1 and DH_A2) are similar to the distances between Plasmodium falciparum and P. knowlesi. The same pattern of results was observed when we collected the triose phosphate isomerase genes and phylogenetically analyzed them (supplementary file S2, Supplementary Material online). Again, the early branching profile and the branch lengths following nodes of divergence have greater or similar lengths than between species in other genera (Cryptosporidium hominis and C. parvum and Leishmania infantum and L. major). The same effort was performed for glutamate dehydrogenase (supplementary file S2, Supplementary Material online). The glutamate dehydrogenase tree is shown in supplementary file S2, Supplementary Material online, where again the branch length for Genotype B relative to E and A is similar in length to that seen for L. infantum and L. major. Additional trees were constructed for enolase, DNA topoisomerase II, DNA topoisomerase III, protein translation elongation factor 1A, fibrillarin, glyceraldehyde-3-phosphate dehydrogenase, glucose-6-phosphate isomerase, NADP-specific heat shock protein 70, LSU ribosomal protein L10P, protein translation elongation factor 2 (EF-2), Sec61 alpha subunit, ribosomal protein L14p/L23e, SSU ribosomal protein S2P, SSU ribosomal protein S15, SSU ribosomal protein S15P, S-adenosylmethionine synthetase, and alpha tubulin along with a concatenated sequence tree of all of the above genes, including the S12E gene (supplementary file S2, Supplementary Material online). Taken together, these multilocus-based phylogenetic results suggest that GS_B should be considered as a separate species and that it is evolutionarily closer to the root of the tree and therefore potentially closer to a putative common ancestor of Giardia than the other three genotypes.
Fig. 2.—

Phylogenetic analysis of ribosomal subunit S12E genes from Giardia genomes and other representative protozoans. The ribosomal subunit S12E genes from each of the four Giardia genotypes were aligned along with those of S12E genes from Trypanosoma cruzi, Trypanosoma brucei, Theileria parva, Theileria annulata, Cryptosporidium parvum, Cryptosporidium hominis, Leishmania infantum, Leishmania major, Plasmodium falciparum, Plasmodium knowlesi, Trichomonas vaginalis, and Naegleria gruberi. Trees were constructed using Bayesian inference. The posterior tree is shown. The horizontal scale line represents number of base substitutions per site analyzed. Numbers at the nodes represent the posterior probability.
Whole-Genome Synteny Analysis
Whole-genome comparison is a useful approach for understanding similarities and differences between species or genotypes. Therefore, using Mauve, we compared the newly sequenced GS_B and DH_A2 with the optically mapped WB_A1 assembly (fig. 3A and B). The anchoring of the original assembly to the optical map allowed all contigs greater than 35 kb in size to be assigned to a specific chromosome and corrected any misassemblies greater than 35 kb (Perry et al. 2011).
Fig. 3.—


Comparative chromosomal sequence alignment between Giardia Genotypes WB_A1 and DH_A2 and WB_A1 and GS_B. Each horizontal panel represents one chromosome sequence, the name of the sequence, a scale representing the DNA sequence coordinates for that chromosome and a single, black center line that the colored blocks sit on top of or underneath. The colored blocks are those regions of conserved DNA that are internally free of genome rearrangements. These blocks are referred to as LCBs representing entirely collinear and homologous sequence between the two genomes. LCBs that lie above the centerline are regions oriented in the forward direction relative to the reference genome (WB_A1) (Perry et al. 2011). Blocks below this line are oriented in a reverse complement manner relative to the reference chromosome. Red vertical lines that start at the top of the LCBs and extend equidistance below the LCBs represent contig boundaries. For WB_A1, each of the five chromosomes is illustrated as a single contig. Therefore, only two red lines are shown for WB_A1, indicating the ends of the chromosomes. White regions between LCBs represent sequence that lacks detectable homology in the other genome. Within each LCB, the height of the color corresponds to the average conservation within that LCB. Segments of sequence that are completely white within a LCB align poorly and most likely contains sequence specific to that chromosome, but which is still collinear in relation to the sequence surrounding it. The height of the color or similarity profile within the LCBs is calculated to be inversely proportional to the average alignment column entropy over a region of the alignment. The boundaries of the LCBs represent breakpoints of genome rearrangement, while blank adjacent regions are isolate-specific sequence gained or lost in the breakpoint region. Colored lines connecting LCBs or non-LCBs between the two chromosomes represent homologous regions. (A) Mauve visual depiction of chromosomal alignments between WB_A1 and DH_A2. Brackets represent specific contigs discussed in the text. The “H” designates a junction verified by PCR (see supplementary file S1, Supplementary Material online, for more detail). (B) Mauve visual depiction of chromosomal alignments between WB_A1 and GS_B. Brackets represent specific contigs discussed in the text. The “H” designates a junction verified by PCR.
Synteny Comparison of WB_A1 and DH_A2
There is substantial synteny between DH_A2 and WB_A1 as shown by the locally collinear blocks (LCBs), defined as conserved regions free from internal rearrangements, in the alignment that are above the horizontal center line in a great majority of all five chromosomes (fig. 3A). For chromosome 1, all the LCBs were completely aligned in the same location and direction from about 300 kb onward. However, within this region of high synteny, there were still several regions with substantial sequence divergence. For example, bracket 1 shows two large LCBs extending from about 500 to 900 kb, but within this region are small vertical white regions indicating lack of sequence homology. These regions of sequence divergence may represent missing sequence in contig gaps, but in some cases, these regions are populated with vsp genes, ankyrin repeat-containing genes, or members of other gene families where sequence divergence is common among family members (data not shown). On the left side of chromosome 1 (bracket 2), there are examples of inversion in situ (e.g., 70–100 kb of the chromosome) or rearrangement without inversion (e.g., LCB from 100–140 kb in WB_A1 to 200–240 kb in DH_A2) or rearrangement plus inversion (e.g., LCB from 220–250 kb on WB_A1 has moved to 120–150 kb and is inverted on DH_A2). In addition, the area extending from about 250–310 kb on DH_A2 chromosome 1 is located on chromosome 3 of WB_A1. The identification of substantial variability at one end of chromosome 1 has been identified as a cause of size variability among chromosome homologs of other isolates, even within individual lines of the same isolate (Adam et al. 1988; Adam 1992). In these earlier reports, about 30% of the size difference was due to different copy numbers of rDNA repeats. However, the differences shown in figure 3 are not due to rDNA, because the rDNA repeats are excluded from both the optical map and from the assembly. Therefore, size variants may be due to differences in other regions of repetitive DNA.
Chromosome 2 shows the greatest degree of synteny with only two LCBs that show inversion and/or rearrangement. Bracket 1 shows a simple inversion, while bracket 2 shows inversion plus movement to a location more than 100 kb from its position in WB_A1. Chromosome 3 (bracket 1) shows an additional example of reverse complementation of an LCB as well as a 120 kb region with no match on WB_A1 chromosome 3. Blast analysis showed this 120-kb region to be located on chromosome 5 of WB_A1. Chromosomes 4 and 5 demonstrated more regions of sequence divergence within and outside LCBs but no inversions. For all five chromosomes, the central regions showed greater levels of similarity than the more distal regions.
Synteny Comparison of WB_A1 and GS_B
The chromosomal comparison of GS_B with WB_A1 shows overall preservation of genome synteny. However, the most striking difference from the DH_A2/WB_A1 comparison is that there is much less DNA sequence relatedness between WB_A1 and GS_B than between WB_A1 and DH_A2, as demonstrated by the areas of white comprising approximately the top 30% of the LCBs, corresponding to a sequence identity of only about 70% across all of the LCBs. The step-wise downward or upward movement of the colored in the LCBs indicates transitional boundaries of sequence homology. In addition, there are more regions of nonhomologous sequence, indicating other instances of divergent or nonhomologous sequence in pairwise comparisons of these chromosomes.
Similar to what was seen in the WB_A1 to DH_A2 chromosome comparisons, reverse complementation and translocation of LCBs within a chromosome or across chromosomes was observed between WB_A1 and GS_B. For example, in chromosome 1 (bracket 1; fig. 3B), GS_B contains ORFs that are annotated similar to those of WB_A1 at comparable chromosomal locations. However, many of these ORFs appear as duplications of related ORFs found on chromosome 3 of WB_A1 (data not shown). Many of the genes within the white region of bracket 1 represent a cross section of the variety of gene families found in Giardia, including, but not limited to, vsps. For example, two vsps encoded in this region show some sequence relatedness to the same vsp genes found in the same location in WB and DH on chromosome 1 but do not pass the threshold for orthology.
Bracket 2 for chromosome 1 demonstrates reverse complementation of sequence containing two LCBs and a unique DNA sequence region on the right side of the contig. Blast analysis demonstrated that the white region within bracket 2 is homologous to a region located on chromosome 5 of WB_A1. The 5′ and 3′ ends of the sequences delineated by Bracket 3 map to LCBs of WB_A1 chromosome 1, but the majority of the internal region maps to a different WB_A1 (data not shown).
The most conserved chromosome between GS_B and WB_A1 is chromosome 2, but even chromosome 2 has a region that maps to chromosome 4 of WB_A1 (bracket 1). In chromosome 3, brackets 1 and 2 represent inversions, while brackets 3 and 4 represent sequences that are both found on chromosome 1 in WB_A1 (data not shown). As with the WB_A1 to DH_A2 comparison, longer LCBs appear more frequent within the middle of the chromosomes than at the ends of the chromosomes, suggesting greater conservation internally than in the subtelomeric regions.
These data suggest that general synteny is conserved between WB_A1 and GS_B in the form of LCBs, but that DNA sequence similarity is lower and rearrangements of large tracks of sequence between chromosomes are more common than was seen between WB_A1 and DH_A2.
Discussion
Human infections are caused almost exclusively by G. lamblia Genotypes A and B, and since their axenization at the National Institutes of Health in 1985 (Nash and Keister 1985; Nash et al. 1985), WB and GS have been studied extensively as representatives of the two genotypes and found to be different from each other in a number of ways. However, Genotype A can be divided into two subtypes, of which WB is from Genotype A1, but most reported human infections are caused by Genotypes A2 or B. As the initial reported genome was from the WB isolate, we decided to sequence isolates from Genotype B (GS) and A2 (DH). While the current sequencing project was in progress, a draft sequence of GS was reported (Franzen et al. 2009), but the current report has added a greater level of depth for the GS isolate and has added the first Genotype A2 sequence. Our comparison of these new genomes with each other and with the other reported Giardia genomes supports the proposal that Genotypes A and B represent different species. This proposal was initially made in 1985 (Nash and Keister 1985; Nash et al. 1985) and was also supported by the reported draft sequence of GS (Franzen et al. 2009). In addition, our phylogenetic comparisons with other protozoa indicated that the distance between Genotypes A and B is similar to the distance between P. falciparum and P. knowlesi or between C. parvum and C. hominis.
In contrast, our comparisons of DH_A2 and WB_A1 demonstrated their much greater similarity to each other than to GS_B in regard to ORF comparisons, synteny, and phylogeny. In fact, these criteria indicate that Genotype E is more closely related to Genotypes A1 and A2 than Genotypes A1 and A2 are to B. The phylogenetic placement of GS nearer to the root of the tree combined with its larger coding capacity and ORF count (supplementary file S1, Supplementary Material online) suggests that Genotypes A1, A2, and E may have arisen through genome reduction and/or niche adaptation. Evidence of genome downsizing or reduction toward patho-evolution or niche or host adaptation has been described for prokaryotic organisms (Sällström and Andersson 2005; Rondini et al. 2007; Beare et al. 2008; Lescot et al. 2008; Losada et al. 2010) as well as for Giardia (Morrison et al. 2007) and Entamoeba histolytica (Loftus et al. 2005). The DH genome is the most reductive Giardia genome sequenced to date. Equally interesting is the positioning of the pig isolate from Genotype E and the implications of a split in niche adaptation to a pig host at the branch point where WB and DH arise. More strain (within genotype) and genotype-specific Giardia genomes will need to be sequenced to verify which genotype or isolate is closest to an ancestral Giardia.
In order to evaluate synteny among the genomes, we used optical maps of the five WB chromosomes (Perry et al. 2011) to anchor the current assemblies onto the five chromosomes. These analyses allowed us to demonstrate substantial synteny and conservation of genomic organization and order, even between GS and WB. The synteny was less pronounced in the subtelomeric regions than in the more conserved middle portions of the chromosomes. This concept of conservation of the middle versus variation at the ends has been described for subtelomeric regions in Giardia and other protozoans (Adam et al. 1991; Adam 1992; Prabhu et al. 2007; Cabrine-Santos et al. 2011). An important unanswered question is the frequency of these genomic rearrangements and which, if any, are genotype-specific. In fact, the first pulsed field gel electrophoresis separations of Giardia chromosomes revealed variant sizes of chromosome 1 among different cloned lines of the ISR isolate and even of the homologs of chromosome 1 within a cloned line (Adam et al. 1988). This was later found to be the result of subtelomeric rearrangements (Adam 1992). The genomes presented in this article will facilitate future studies that analyze rearrangements in other isolates and genotypes.
The difference in heterozygosity levels among the Giardia isolates is quite large, including greater than a log difference between the closely related Genotype A1 and A2 isolates. The heterozygosity levels of all the isolates are within the ranges expected in organisms undergoing sexual reproduction, but the reasons for the differences warrant further investigation.
In conclusion, our genome sequences and the accompanying comparative data support the designation of Genotypes A and B as separate species. These data will assist in the development of diagnostic tests to differentiate the genotypes and lead to a greater understanding of speciation, evolution, and recombination across pathogen members responsible for giardiasis.
Supplementary Material
Supplementary files S1 and S2 are available at Genome Biology and Evolution online (http://www.gbe.oxfordjournals.org/).
Acknowledgments
The following are the contributions of the authors: R.D.A., coordinated the manuscript writing and other parts of the genome effort E.W.D., comparative genomic analysis of the Giardia genomes; and contributed to writing and editing the paper; C.A.M., GS_B and DH_A2 assembly, GS_B and DH_A2 heterozygosity analysis; D.P.B., 3 kb and 8 kb paired-end library prep for 454 sequencing of GS_B; 8 kb library paired-end library prep for 454 sequencing of DH_A2; K.D.B., DNA extraction of trophozoites; S.M.R., 3 kb, 6 kb, and 8 kb paired-end library prep for 454 sequencing of DH_A2; M.M.H., sample preparation for the libraries to be sequenced; N.P.N., Giardia heterozygosity and vsp gene analysis; R.B.P., Giardia vsp gene analysis; S.F.P., directed the genome sequencing efforts and contributed to writing and editing the paper; T.E.N., originated and supported the project, suggested analyses, and contributed to writing and editing the paper. This study was supported by the Intramural Research Program of the National Institute of Allergy and Infectious Diseases, US National Institutes of Health.
Literature Cited
- Adam RD. Biology of Giardia lamblia. Clin Microbiol Rev. 2001;14:447–475. doi: 10.1128/CMR.14.3.447-475.2001. [DOI] [PMC free article] [PubMed] [Google Scholar]
- Adam RD. Chromosome-size variation in Giardia lamblia: the role of rDNA repeats. Nucleic Acids Res. 1992;20:3057–3061. doi: 10.1093/nar/20.12.3057. [DOI] [PMC free article] [PubMed] [Google Scholar]
- Adam RD, Nash TE, Wellems TE. The Giardia lamblia trophozoite contains sets of closely related chromosomes. Nucleic Acids Res. 1988;16:4555–4567. doi: 10.1093/nar/16.10.4555. [DOI] [PMC free article] [PubMed] [Google Scholar]
- Adam RD, Nash TE, Wellems TE. Telomeric location of Giardia rDNA genes. Mol Cell Biol. 1991;11:3326–3330. doi: 10.1128/mcb.11.6.3326. [DOI] [PMC free article] [PubMed] [Google Scholar]
- Adam RD, et al. The Giardia lamblia vsp gene repertoire: characteristics, genomic organization, and evolution. BMC Genomics. 2010;11:424. doi: 10.1186/1471-2164-11-424. [DOI] [PMC free article] [PubMed] [Google Scholar]
- Aggarwal A, Nash TE. Comparison of two antigenically distinct Giardia lamblia isolates in gerbils. Am J Trop Med Hyg. 1987;36:325–332. doi: 10.4269/ajtmh.1987.36.325. [DOI] [PubMed] [Google Scholar]
- Al-Mekhlafi MS, et al. Giardiasis as a predictor of childhood malnutrition in Orang Asli children in Malaysia. Trans R Soc Trop Med Hyg. 2005;99:686–691. doi: 10.1016/j.trstmh.2005.02.006. [DOI] [PubMed] [Google Scholar]
- Altekar G, Dwarkadas S, Huelsenbeck JP, Ronquist F. Parallel Metropolis coupled Markov chain Monte Carlo for Bayesian phylogenetic inference. Bioinformatics. 2004;20:407–415. doi: 10.1093/bioinformatics/btg427. [DOI] [PubMed] [Google Scholar]
- Baruch AC, Isaac-Renton J, Adam RD. The molecular epidemiology of Giardia lamblia:a sequence-based approach. J Infect Dis. 1996;174:233–236. doi: 10.1093/infdis/174.1.233. [DOI] [PubMed] [Google Scholar]
- Beare PA, et al. Candidate antigens for Q fever serodiagnosis revealed by immunoscreening of a Coxiella burnetii protein microarray. Clin Vaccine Immunol. 2008;15:1771–1779. doi: 10.1128/CVI.00300-08. [DOI] [PMC free article] [PubMed] [Google Scholar]
- Benere E, Van Assche T, Cos P, Maes L. Intrinsic susceptibility of Giardia duodenalis assemblage subtypes A(I), A(II), B and E(III) for nitric oxide under axenic culture conditions. Parasitol Res. 2012;110:1315–1319. doi: 10.1007/s00436-011-2627-6. [DOI] [PubMed] [Google Scholar]
- Byrd LG, Conrad JT, Nash TE. Giardia lamblia infections in adult mice. Infect Immun. 1994;62:3583–3585. doi: 10.1128/iai.62.8.3583-3585.1994. [DOI] [PMC free article] [PubMed] [Google Scholar]
- Cabrine-Santos M, Ramirez LE, Lages-Silva E, de Souza BF, Pedrosa AL. Sequencing and analysis of chromosomal extremities of Trypanosoma rangeli in comparison with Trypanosoma cruzi lineages. Parasitol Res. 2011;108:459–466. doi: 10.1007/s00436-010-2087-4. [DOI] [PubMed] [Google Scholar]
- Caccio SM, Ryan U. Molecular epidemiology of giardiasis. Mol Biochem Parasitol. 2008;160:75–80. doi: 10.1016/j.molbiopara.2008.04.006. [DOI] [PubMed] [Google Scholar]
- Celiksoz A, et al. Effects of giardiasis on school success, weight and height indices of primary school children in Turkey. Pediatr Int. 2005;47:567–571. doi: 10.1111/j.1442-200x.2005.02110.x. [DOI] [PubMed] [Google Scholar]
- Cooper MA, Adam RD, Worobey M, Sterling CR. Population genetics provides evidence for recombination in Giardia. Curr Biol. 2007;17:1984–1988. doi: 10.1016/j.cub.2007.10.020. [DOI] [PubMed] [Google Scholar]
- Cooper MA, et al. Molecular analysis of household transmission of Giardia lamblia in a region of high endemicity in Peru. J Infect Dis. 2010;202:1713–1721. doi: 10.1086/657142. [DOI] [PMC free article] [PubMed] [Google Scholar]
- Darling ACE, Mau B, Blattner FR, Perna NT. Mauve: multiple alignment of conserved genomic sequence with rearrangements. Genome Res. 2004;14:1394–1403. doi: 10.1101/gr.2289704. [DOI] [PMC free article] [PubMed] [Google Scholar]
- DelVecchio VG, et al. The genome sequence of the facultative intracellular pathogen Brucella melitensis. Proc Natl Acad Sci U S A. 2002;99:443–448. doi: 10.1073/pnas.221575398. [DOI] [PMC free article] [PubMed] [Google Scholar]
- Filice FP. Studies on the cytology and life history of a Giardia from the laboratory rat. Berkeley: University of California Press; 1952. [Google Scholar]
- Franzen O, et al. Draft genome sequencing of Giardia intestinalis assemblage B isolate GS: is human giardiasis caused by two different species? PLoS Pathog. 2009;5:e1000560. doi: 10.1371/journal.ppat.1000560. [DOI] [PMC free article] [PubMed] [Google Scholar]
- Gilman RH, Marquis GS, Miranda E, Vestegui M, Martinez H. Rapid reinfection by Giardia lamblia after treatment in a hyperendemic Third World community. Lancet. 1988;1:343–345. doi: 10.1016/s0140-6736(88)91131-2. [DOI] [PubMed] [Google Scholar]
- Gilman RH, et al. Epidemiology and serology of Giardia lamblia in a developing country: Bangladesh. Trans R Soc Trop Med Hyg. 1985;79:469–473. doi: 10.1016/0035-9203(85)90068-9. [DOI] [PubMed] [Google Scholar]
- Haque R, et al. Giardia assemblage A infection and diarrhea in Bangladesh. J Infect Dis. 2005;192:2171–2173. doi: 10.1086/498169. [DOI] [PubMed] [Google Scholar]
- Hollm-Delgado MG, et al. Lack of an adverse effect of Giardia intestinalis infection on the health of Peruvian children. Am J Epidemiol. 2008;168:647–655. doi: 10.1093/aje/kwn177. [DOI] [PMC free article] [PubMed] [Google Scholar]
- Huelsenbeck JP, Ronquist F. MRBAYES: Bayesian inference of phylogenetic trees. Bioinformatics. 2001;17:754–755. doi: 10.1093/bioinformatics/17.8.754. [DOI] [PubMed] [Google Scholar]
- Ivanova N, et al. Genome sequence of Bacillus cereus and comparative analysis with Bacillus anthracis. Nature. 2003;423:87–91. doi: 10.1038/nature01582. [DOI] [PubMed] [Google Scholar]
- Jerlstrom-Hultqvist J, et al. Genome analysis and comparative genomics of a Giardia intestinalis assemblage E isolate. BMC Genomics. 2010;11:543. doi: 10.1186/1471-2164-11-543. [DOI] [PMC free article] [PubMed] [Google Scholar]
- Kapatral V, et al. Genome sequence and analysis of the oral bacterium Fusobacterium nucleatum strain ATCC 25586. J Bacteriol. 2002;184:2005–2018. doi: 10.1128/JB.184.7.2005-2018.2002. [DOI] [PMC free article] [PubMed] [Google Scholar]
- Keister DB. Axenic culture of Giardia lamblia in TYI-S-33 medium supplemented with bile. Trans R Soc Trop Med Hyg. 1983;77:487–488. doi: 10.1016/0035-9203(83)90120-7. [DOI] [PubMed] [Google Scholar]
- Lescot M, et al. The genome of Borrelia recurrentis, the agent of deadly louse-borne relapsing fever, is a degraded subset of tick-borne Borrelia duttonii. PLoS Genet. 2008;4:e1000185. doi: 10.1371/journal.pgen.1000185. [DOI] [PMC free article] [PubMed] [Google Scholar]
- Loftus B, et al. The genome of the protist parasite Entamoeba histolytica. Nature. 2005;433:865–868. doi: 10.1038/nature03291. [DOI] [PubMed] [Google Scholar]
- Losada L, et al. Continuing evolution of Burkholderia mallei through genome reduction and large-scale rearrangements. Genome Biol Evol. 2010;2:102–116. doi: 10.1093/gbe/evq003. [DOI] [PMC free article] [PubMed] [Google Scholar]
- Moreno-Hagelsieb G, Latimer K. Choosing BLAST options for better detection of orthologs as reciprocal best hits. Bioinformatics. 2008;24:319–324. doi: 10.1093/bioinformatics/btm585. [DOI] [PubMed] [Google Scholar]
- Morrison HG, et al. Genomic minimalism in the early diverging intestinal parasite Giardia lamblia. Science. 2007;317:1921–1926. doi: 10.1126/science.1143837. [DOI] [PubMed] [Google Scholar]
- Muhsen K, Levine MM. A Systematic review and meta-analysis of the association between Giardia lamblia and endemic pediatric diarrhea in developing countries. Clin Infect Dis. 2012;55(Suppl 4):S271–S293. doi: 10.1093/cid/cis762. [DOI] [PMC free article] [PubMed] [Google Scholar]
- Nash TE. Surface antigenic variation in Giardia lamblia. Mol Microbiol. 2002;45:585–590. doi: 10.1046/j.1365-2958.2002.03029.x. [DOI] [PubMed] [Google Scholar]
- Nash TE, Banks SM, Alling DW, Merritt JW, Jr, Conrad JT. Frequency of variant antigens in Giardia lamblia. Exp Parasitol. 1990;71:415–421. doi: 10.1016/0014-4894(90)90067-m. [DOI] [PubMed] [Google Scholar]
- Nash TE, Conrad JT, Merritt JW., Jr Variant specific epitopes of Giardia lamblia. Mol Biochem Parasitol. 1990;42:125–132. doi: 10.1016/0166-6851(90)90120-b. [DOI] [PubMed] [Google Scholar]
- Nash TE, Herrington DA, Losonsky GA, Levine MM. Experimental human infections with Giardia lamblia. J Infect Dis. 1987;156:974–984. doi: 10.1093/infdis/156.6.974. [DOI] [PubMed] [Google Scholar]
- Nash TE, Keister DB. Differences in excretory-secretory products and surface antigens among 19 isolates of Giardia. J Infect Dis. 1985;152:1166–1171. doi: 10.1093/infdis/152.6.1166. [DOI] [PubMed] [Google Scholar]
- Nash TE, et al. Restriction-endonuclease analysis of DNA from 15 Giardia isolates obtained from humans and animals. J Infect Dis. 1985;152:64–73. doi: 10.1093/infdis/152.1.64. [DOI] [PubMed] [Google Scholar]
- Perry DA, Morrison HG, Adam RD. Optical map of the genotype A1 WB C6 Giardia lamblia genome isolate. Mol Biochem Parasitol. 2011;180:112–114. doi: 10.1016/j.molbiopara.2011.07.008. [DOI] [PMC free article] [PubMed] [Google Scholar]
- Prabhu A, Morrison HG, Martinez CR, III, Adam RD. Characterisation of the subtelomeric regions of Giardia lamblia genome isolate WBC6. Int J Parasitol. 2007;37:503–513. doi: 10.1016/j.ijpara.2006.12.011. [DOI] [PubMed] [Google Scholar]
- Prado MS, et al. Asymptomatic giardiasis and growth in young children; a longitudinal study in Salvador, Brazil. Parasitology. 2005;131:51–56. doi: 10.1017/s0031182005007353. [DOI] [PubMed] [Google Scholar]
- Rondini S, et al. Ongoing genome reduction in Mycobacterium ulcerans. Emerg Infect Dis. 2007;13:1008–1015. doi: 10.3201/eid1307.060205. [DOI] [PMC free article] [PubMed] [Google Scholar]
- Ronquist F, Huelsenbeck JP. MrBayes 3: Bayesian phylogenetic inference under mixed models. Bioinformatics. 2003;19:1572–1574. doi: 10.1093/bioinformatics/btg180. [DOI] [PubMed] [Google Scholar]
- Sällström B, Andersson SGE. Genome reduction in the α-Proteobacteria. Curr Opin Microbiol. 2005;8:579–585. doi: 10.1016/j.mib.2005.08.002. [DOI] [PubMed] [Google Scholar]
- Singer SM, Yee J, Nash TE. Episomal and integrated maintenance of foreign DNA in Giardia lamblia. Mol Biochem Parasitol. 1998;92:59–69. doi: 10.1016/s0166-6851(97)00225-9. [DOI] [PubMed] [Google Scholar]
- Solaymani-Mohammadi S, Singer SM. Host Immunity and pathogen strain contribute to intestinal disaccharidase impairment following gut infection. J Immunol. 2011;187:3769–3775. doi: 10.4049/jimmunol.1100606. [DOI] [PMC free article] [PubMed] [Google Scholar]
Associated Data
This section collects any data citations, data availability statements, or supplementary materials included in this article.