Abstract
Background
The widespread use of trichloroethylene (TCE) and its frequent release into the environment has caused many environmental and health problems. In this study the degradation of TCE at different micromolar concentrations was investigated in a stainless steel reactor with various concentrations of H2O2 and TiO2 at different oxygen pressures and three different pHs.
Methods
To examine the synergistic effect of under pressure oxygen on TCE degradation, the concentrations of H2O2 and TiO2 as well as pH were first optimized, and then the experiments were performed under optimal conditions. Gas chromatography with a flame ionization detector (FID) was used to measure TCE concentrations.
Results
Results showed that the percentage of TCE degradation without pressurized oxygen was low and it increased with increasing pressure of oxygen at all initial concentrations of TCE. The degradation percentages without oxygen pressure were 48.27%, 51.22%, 58.13% and 64.33% for TCE concentrations of 3000, 1500, 300 and 150 μg/L respectively. At an oxygen pressure of 2.5 atmospheres (atm) the percent degradation of TCE reached 84.85%, 89.14%, 93.13% and 94.99% respectively for the aforementioned TCE concentrations.
Conclusions
The results of this study show that the application of dissolved oxygen under pressure increases the efficiency of the H2O2/TiO2 process on the degradation of TCE and can be used along with other oxidants as an effective method for the removal of this compound from aqueous solutions.
Background
TCE is described by the US Environmental Protection Agency (EPA) as a halogenated aliphatic organic compound which has been widely used as an industrial solvent in applications including dry cleaning, paint stripping and chemical, pharmaceutical, and plastic manufacturing. It is used mainly as a degreasing agent because of its unique properties and solvent effects [1,2].
It is estimated that the production of TCE in 1990 was approximately 131 kilotons in Western Europe, 79 kilotons in the United States of America and 57 kilotons in Japan and its annual consumption in these areas was estimated as 65-103% of production levels [3]. Due to its widespread use and physical characteristics, TCE may enter into water supplies and groundwater. Drinking water supplies that use groundwater sources contaminated with TCE may contain this compound [1]. According to reports from the Agency for Toxic Substances and Disease Registry (ATSDR) TCE is the most frequently reported organic contaminant in groundwater in the US. The TCE-contaminated drinking water supply sources in the US are estimated at between 9-34% of total water supply sources [1,4].
It has been reported that exposure to TCE has many adverse effects on human health. Most of the reported effects have been associated with the effects of TCE on the central nervous system, with reported symptoms of fatigue, sleepiness, headache, confusion, and blurred vision [1,4]. Other effects on the liver, kidneys, gastrointestinal tract, and skin have also been reported [5]. According to US.EPA reports, exposure to TCE is associated with cancer of the kidneys and other organs [1]. It was also reported that TCE can cause loss of hearing in laboratory animals [4]. This compound induces cancer in mice and rats and it is considered as a probable carcinogenic chemical (Group B2) to humans [6].
Conventional water and wastewater treatment processes such as coagulation, sedimentation, precipitative softening, filtration and chlorination have failed to reduce concentrations of TCE to nonhazardous levels [7]. Treatment technologies such as adsorption by activated carbon and air stripping are effective in removing TCE from contaminated waters. Nakano et al. however, believe that transformation of TCE from one phase to another phase would be the most disadvantageous of these processes [8].
During the past several years numerous studies have been performed to investigate various techniques and technologies for the removal of this pollutant from contaminated water. Amongst different kinds of degradation and removal methods, advanced oxidation processes (AOPs) provide an effective means of rapidly treating this pollutant with efficient process control [7,9]. There are some reports regarding TCE degradation by various advanced oxidation processes such as H2O2 /iron (II) (Fenton’s reaction) [9], ultrasound/H2O2[10], gamma-rays/O3 and H2O2 /gamma-rays [11]. Cross et al. investigated the effects of the direct addition of dissolved oxygen on the combination of copper ions and ascorbic acid in an oxidation process known as a modified Fenton reagent. They reported that dissolved oxygen has a considerable synergistic effect on this system’s efficiency [12]. The main objective of this work was to investigate the synergetic effect of under pressure dissolved oxygen (UPDO) on TCE degradation by H2O2 and TiO2 nano-particles. The effects of different operating conditions such as TiO2 and H2O2 concentration, pH, and oxygen pressure on TCE removal efficiency were explored.
Materials and methods
General procedures
This experimental study was conducted in bench scale and batch system on synthetic solutions containing different concentrations of TCE. Aqueous solutions with different initial concentrations of TCE (150, 300, 1500, and 3000 μg/L) were prepared by dissolving TCE (Merck Co., Germany- Cat. No. 100958) in distilled and deionized (DD) water. The selection of these concentrations was based on TCE levels found in underground water in Tehran which ranged from 97.7 to 1345.7 μg/L [13]. TiO2 particles (P25, Degussa AG, Germany) with a primary particle diameter of 21 nm, specific surface area of 50 ± 15 m2/ g, and a crystal distribution of 80% anatase and 20% rutile were used as the catalyst for the experiments and dosed in the range of 25–200 mg/L. Four different concentrations (10, 25, 50, and 100 mg/L) of H2O2 were made by dissolving 30% H2O2 (Merck Co., Germany- Cat. No. 108597) in samples and concentrations were validated by iodometric back titration with 0.1 N sodium thiosulfate [9]. For adjustments of pH, NaOH and HCl supplied from Merck Co. were used and the pH values were measured using a pH meter (Metrohm E520). The prepared TCE solutions along with the given concentrations of TiO2 and H2O2 were exposed to different oxygen pressures (1, 1.5, 2, and 2.5 atm) at different reaction times of 15, 30, 45, 60, 90, and 120 minutes. For each run, the experiments were conducted three times and the averages were reported.
Pilot set-up
All experiments were performed in a 6 L stainless steel reactor which was connected by a plastic pipe to a cylinder containing 99.9% pure oxygen (Figure 1). After the addition of 2 L of prepared solution to the reactor and the application of appropriate doses of H2O2 and/or TiO2 nano-particles, the reactor was completely sealed to minimize any losses of TCE due to volatilization. However, in order to determine further losses, blank samples (i.e., unexposed control samples) were analyzed routinely. Then, the real concentration of each sample was calculated by subtracting the blank values from the results of the exposed samples. The oxygen gas entrance valve (marked d in Figure 1) was then opened until the pressure gauge displayed the desired pressure. Adjustment of the pressure was done manually by opening and closing the gas pressure regulating valve (c in Figure 1) and the gas entrance valve. To provide continuous agitation, the reactor was placed on a shaker.
Figure 1.
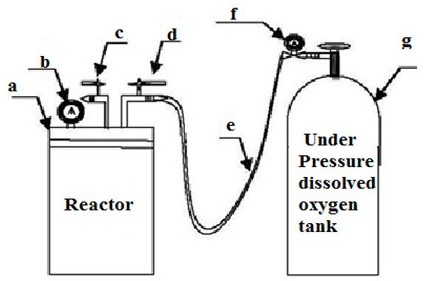
Schematic representation of the pilot set-up: a- Screw cap, b- Pressure gauge, c- Ball valve for gas pressure regulation, d- Ball valve for oxygen gas entrance, e- Connector hose, f- Pressure reducing Valve, g- Oxygen cylinder.
Analysis
The TCE concentrations were measured using a Varian CP–3800 (Australia) gas chromatograph (GC), equipped with an FID and a 30 m × 0.32 mm CP–Sil & CB capillary column with a film thickness of 0.25 μm. The initial oven temperature of 35°C was increased at a rate of 16°C/min to a final temperature of 100°C. The injector temperature was 150°C. The inlet was operated in 20% split mode. Helium (99.999%) was used as the carrier gas at a rate of 1 mL/min.
Results and discussion
Effect of H2O2 concentration
Aqueous solutions with different initial concentrations of TCE and different concentrations of H2O2 (10, 25, 50 and 100 mg/L) at neutral pH, and a TiO2 concentration of 50 mg/L were exposed to UPDO (1 atm) for 45 min. The removal rate of TCE versus H2O2 concentration is shown in Figure 2. As an overall trend it is clear that the percentage of degradation for all TCE concentrations increased quite rapidly with the increase in H2O2 concentration until 50 mg/L and that at concentrations higher than this the TCE removal rate decreased. Apparently, the quenching of OH• radicals according to the below quenching reactions causes the reduction in TCE degradation at H2O2 concentrations above 50 mg/L. Quenching reactions may include [9]:
Figure 2.
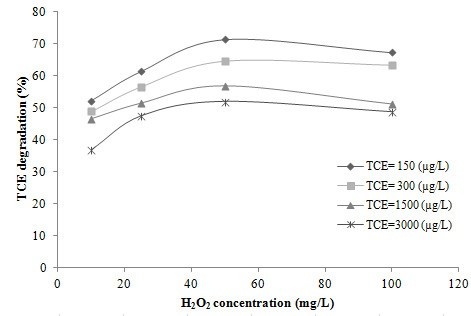
TCE removal at different H 2 O 2 concentrations; TiO 2 concentration = 50 mg/L, oxygen pressure = 1 atm, pH = neutral and time = 45 min.
| (1) |
| (2) |
It appears that in the advanced oxidation processes based on hydrogen peroxide, the effectiveness of H2O2 on the degradation of TCE depends on the type of process and the other available oxidants that may be used as synergists; for example Jung et al. found that in the radiation treatment of TCE and tetrachloroethylene (PCE) by gamma-rays, the presence of H2O2 did not affect the decomposition process [11]. However, it is reported that degradation of TCE by sonication in the presence of H2O2 is dependent upon the H2O2 concentration. The best TCE degradation rate was achieved at an H2O2 concentration of 10 mg/L and increasing the H2O2 concentration from 10 to 50 mg/L did not affect the TCE destruction [10]. Therefore, there is a maximum level of H2O2 beyond which any improvement in the degradation rate is decreased; and in our experiments the maximum level was 50 mg/L.
Effect of TiO2 concentration
Figure 3 shows the removal of TCE at different concentrations of TiO2 (25, 50, 100 and 200 mg/L) at neutral pH, 50 mg/L H2O2, 1 atm of oxygen and a reaction time of 45 min. As shown in this figure, the TCE removal increased with an increase in TiO2 concentration and reached a plateau at a TiO2 concentration of 100 mg/L, after which it remained approximately stable. This result is similar to the results reported by other researchers who studied the effect of TiO2 nano-particles on the degradation of other organic pollutants in various AOPs [10,14,15]. Yamazaki et al. compared the effectiveness of Degussa P-25 TiO2 nano-particles with the commercially available PC-101 and PC-102 powders in addition to SG powders, which are prepared by the sol–gel method of photocatalytic degradation of TCE in water. They found that the degradation rate of TCE using P-25 was about three-fold higher than when the same experiments were performed with the other three aforementioned nano-particle powders. Differences in the degradation rates were mainly due to different specific surface area, crystal structure, and specific volume of the various TiO2 powders [2]. Some studies have determined that in the AOPs which use TiO2 nano-particles as catalysts for the removal of organic pollutants, when the concentration of nano-particles exceeds a certain value, the activated TiO2 may deactivate through collisions with ground-state catalysts. Additionally, agglomeration and sedimentation of TiO2 occurs in the presence of high concentrations of catalyst [16-18]. Therefore, lack of any increase in TCE removal efficiency at TiO2 concentrations higher than 100 mg/L in our work can be attributed to deactivation, agglomeration and sedimentation of TiO2 nano-particles. Avoiding these problems is essential to the optimization of TiO2 concentration.
Figure 3.
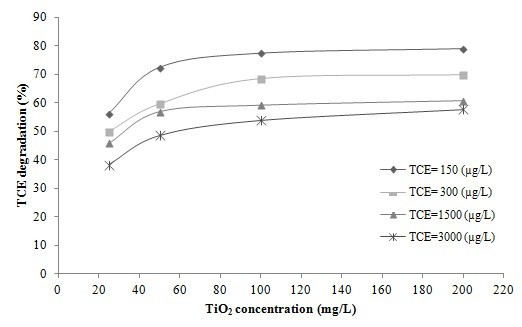
Degradation of TCE at different TiO2 concentrations. H2O2 concentration = 50 mg/L, oxygen pressure = 1 atm, pH = neutral and time = 45 min.
Effect of pH
In AOPs, pH can influence the pollutant degradation rate. As shown in Figure 4, there was a significant difference in TCE degradation at various pHs; and the degradation was significantly higher in acidic pH. Similar results were obtained by Teel et al. who found that TCE degradation in goethite-catalyzed reactions increased significantly with decreasing pH. They also reported that the degradation rate of pentachlorophenol in Fenton’s reactions decreased significantly with increasing pH [9]. Although acidic conditions appear to enhance catalysis by TiO2 in the reactor, the underlying mechanism for this effect is unknown. In addition, under some conditions H2O2 based reactions are highly redox sensitive, and OH• formation due to H2O2 decomposition increases significantly under the reducing conditions of low pH.
Figure 4.
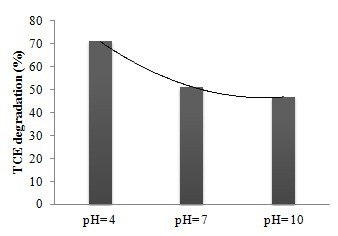
Effect of pH on TCE degradation. TCE = 1500 μg/L, TiO2 = 100 mg/L, H2O2 = 50 mg/L, oxygen pressure = 1 atm, and time = 45 min.
Effect of reaction time and initial TCE concentration
To investigate the effect of reaction time and initial TCE concentration on the TCE removal rate, given concentrations of TCE were exposed to four different oxygen pressures during six reaction times with the optimized values of H2O2 concentration (50 mg/L), TiO2 loading (100 mg/L) and pH value (4). Table 1 shows the fitted equations and R2 value relative to percent TCE degradation versus reaction time for different oxygen pressures. As shown in this table the best fit trend lines for percent degradation versus reaction time were polynomial. The results showed that the degradation percent increased with increasing reaction time from 15 to 90 min and then stayed approximately constant. Decreasing the initial concentration of TCE caused an increase in removal rate. For example, at an oxygen pressure of 1 atm, initial TCE concentration of 150 μg/L, and contact time of 90 minutes, 87.21% (± 6.82%) TCE degradation was achieved; whereas for concentrations of 300, 1500 and 3000 μg/L, the average (± S.D.) of TCE removal efficiency were 83.13% (± 7.23%), 75.28% (± 5.65%) and 71.46% (± 5.65%) respectively. This trend was also observed at other oxygen pressures. This may be explained by the fact that under the same conditions, the OH° radical densities were equal in all solutions; therefore, the reaction of TCE with OH° radicals becomes more likely at lower TCE concentrations, resulting in an overall increase in TCE degradation by OH° radicals [10]. This result was in agreement with results reported by other researchers who studied TCE degradation by various AOPs. For example, Huang et al. studied the potential of gamma radiation technology for TCE degradation and found that with increasing initial concentration of TCE, increased time and gamma-ray dosage was required for the degradation process [19].
Table 1.
Fitted equations and R 2 related to percent TCE degradation versus reaction time for different oxygen pressures under optimized conditions
| Oxygen (O 2 ) pressure (atm) | TCE (μg/L) | Fitted equation | R 2 |
|---|---|---|---|
| 1 |
150 |
y = 4E-05x3 - 0.014x2 + 1.641x + 23.40 |
0.999 |
| |
300 |
y = 4E-05x3 - 0.014x2 + 1.735x + 16.82 |
0.995 |
| |
1500 |
y = 5E-05x3 - 0.015x2 + 1.680x + 14.22 |
0.997 |
| |
3000 |
y = 5E-05x3 - 0.015x2 + 1.675x + 10.45 |
0.995 |
| 1.5 |
150 |
y = 6E-05x3 - 0.018x2 + 1.894x + 25.84 |
0.998 |
| |
300 |
y = 5E-05x3 - 0.014x2 + 1.630x + 24.96 |
0.996 |
| |
1500 |
y = 2E-05x3 - 0.009x2 + 1.310x + 23.36 |
0.999 |
| |
3000 |
y = 2E-05x3 - 0.010x2 + 1.455x + 13.85 |
0.999 |
| 2 |
150 |
y = 3E-05x3 - 0.010x2 + 1.307x + 41.45 |
0.996 |
| |
300 |
y = 3E-05x3 - 0.011x2 + 1.476x + 32.36 |
0.996 |
| |
1500 |
y = 4E-05x3 - 0.014x2 + 1.651x + 24.65 |
0.995 |
| |
3000 |
y = 4E-05x3 - 0.012x2 + 1.442x + 24.79 |
0.999 |
| 2.5 |
150 |
y = 3E-05x3 - 0.010x2 + 1.307x + 41.45 |
0.996 |
| |
300 |
y = 3E-05x3 - 0.011x2 + 1.476x + 32.36 |
0.996 |
| |
1500 |
y = 4E-05x3 - 0.014x2 + 1.651x + 24.65 |
0.995 |
| 3000 | y = 4E-05x3 - 0.012x2 + 1.442x + 24.79 | 0.999 |
Effect of under pressure oxygen
Figure 5 shows the TCE removal percentage versus oxygen pressure for various initial concentrations of TCE following a 90 min reaction time with optimized values of H2O2, TiO2 and pH; and Figure 6 shows the additional removal of TCE due to the application of 2 atm of oxygen under optimum conditions. According to Figure 5, TCE degradation increased rapidly with increasing oxygen pressure. It can be clearly seen that without applying oxygen, the overall degradation of TCE is low. Without oxygen pressure the percentages of TCE degradation were 48.27%, 51.22%, 58.13% and 64.33% for TCE concentrations of 3000, 1500, 300 and 150 μg/L, respectively. These degradation percentages increased markedly to 71.46%, 75.28%, 83.13% and 87.21% at 1 atm of oxygen. These values gradually continued to increase up to an oxygen pressure of 2 atm. At this pressure the degradation rates were 84.85%, 89.14%, 93.13%, and 94.99% for TCE concentrations of 3000, 1500, 300 and 150 μg/L respectively. Accordingly, the degradation rate at this pressure was enhanced by approximately 30% compared to those conditions in which oxygen was not applied. As illustrated, the TCE removal rate did not change significantly above oxygen pressures of 2 atm. Isaev et al. have studied the influence of dissolved oxygen under pressure on electrochemical oxidation of toluene and acetone from aqueous solutions. They reported that the oxidation of toluene and acetone by electrolysis under oxygen pressure was accelerated due to the generation of active particles of the ions O2- and HO2-, and radicals including HO2° and HO°. They also showed that increasing the oxygen pressure increased the efficiency of the overall process [20].
Figure 5.
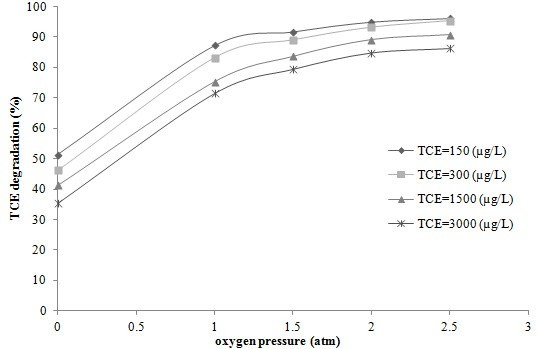
Degradation of TCE in various oxygen pressures (H2O2 = 50 mg/L, TiO2 = 100 mg/L, pH = 4 and reaction time 90 min).
Figure 6.
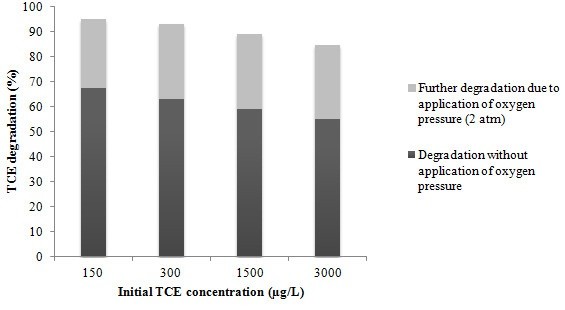
Additional removal of TCE due to the application of an oxygen pressure of 2 atm under optimum conditions.
The increasing TCE degradation with increasing oxygen pressure in our present work can be attributed to the generation of OH° radicals due to the reaction between H2O2 and pressurized O2, similar to the reaction which occurs between H2O2 and O3 for the production of hydroxyl radicals as follows [21]:
| (3) |
Therefore, the efficiency of hydroxyl radical production plays an important role in the degradation of TCE and PCE.
Conclusions
In this study degradation of TCE was investigate in a stainless steel reactor with various experimental conditions including different H2O2 concentrations, TiO2 nano-particle dosage, pH, initial TCE concentration and different oxygen pressure. The results of this study show that the optimum conditions for TCE degradation are an H2O2 concentration of 50 mg/L, a TiO2 concentration of 100 mg/L, an acidic pH and a reaction time of 90 min. Additionally, the results indicated that under pressure dissolved oxygen has a synergistic effect on the H2O2/TiO2 AOP and enhances the degradation of TCE. The application of 2 atm of dissolved oxygen under optimized conditions improved the effectiveness of TCE degradation by 30%. This synergistic effect provides a promising technology for the removal of TCE and can also be used to remove other organic contaminants from aqueous solutions.
Competing interests
The authors declare that they have no competing interests.
Authors’ contributions
The overall implementation of this study including design, experiments and data an analysis, and manuscript preparation were the results of efforts by corresponding author. All authors have made extensive contribution into the review and finalization of this manuscript. All authors read and approved the final manuscript.
Contributor Information
Mohammad Hoseini, Email: m_hoseini2174@yahoo.com.
Ramin Nabizadeh, Email: rnabizadeh@tums.ac.ir.
Shahrokh Nazmara, Email: snazmara@gmail.com.
Gholam Hossein Safari, Email: hsafari13@yahoo.com.
Acknowledgments
The authors are grateful to all laboratory staff of the Department of Environmental Health Engineering, Tehran University of Medical Sciences for their support throughout this study.
References
- US.EPA. Trichloroethylene. Technology Transfer Network, air Toxics web Site. 2007. in: http://www.epa.gov/ttn/atw/hlthef/tri-ethy.html#ref4.
- Yamazaki S, Matsunaga S, Hori K. Photocatalytic degradation of trichloroethylene in water using TiO2 pellets. Water Res. 2001;11:1022–1028. doi: 10.1016/S0043-1354(00)00347-X. [DOI] [PubMed] [Google Scholar]
- McGregor DB, Heseltine E, ller H MÃ. Dry cleaning, some solvents used in dry cleaning and other industrial chemicals. IARC meeting, Lyon, 7–14 February 1995. Scand J Work Environ Health. 1995;11:310–312. doi: 10.5271/sjweh.1078. [DOI] [PubMed] [Google Scholar]
- ATSDR. Toxicological Profile for Trichloroethylene. U.S. Public Health Service, U.S. Department of Health and Human Services. Atlanta, GA; 1997. On line at: http://www.atsdr.cdc.gov/toxprofiles/tp19.pdf. [Google Scholar]
- US.EPA. Trichloroethylene Hazard Summary. 2000.
- Wartenberg D, Reyner D, Scott CS. Trichloroethylene and cancer: epidemiologic evidence. Environ Health Perspect. 2000;11:161–176. doi: 10.1289/ehp.00108s2161. [DOI] [PMC free article] [PubMed] [Google Scholar]
- US.EPA. EPA Ground Water Issu. In: Russell HH, Matthews JE, Sewell GW, editor. TCE Removal from Contaminated Soil and Ground Water, Office of Solid Waste and Emergency Response, EPA/540/S-92/002. 1992. [Google Scholar]
- Nakano Y, Hua LQ, Nishijima W, Shoto E, Okada M. Biodegradation of trichloroethylene (TCE) adsorbed on granular activated carbon (GAC) Water Res. 2000;11:4139–4142. doi: 10.1016/S0043-1354(00)00199-8. [DOI] [Google Scholar]
- Teel AL, Warberg CR, Atkinson DA, Watts RJ. Comparison of mineral and soluble iron Fenton’s catalysts for the treatment of trichloroethylene. Water Res. 2001;11:977–984. doi: 10.1016/S0043-1354(00)00332-8. [DOI] [PubMed] [Google Scholar]
- Dobaradaran S, Nabizadeh R, Mahvi AH, Mesdaghinia AR, Yunesian M, Rastkari N, Nazmara S. Survey on degradation rates of trichloroethylene in aqueous solutions by ultrasound. Iran J Environ Health Sci Eng. 2010;11:307–312. [Google Scholar]
- Jung J, Yoon JH, Chung HH, Lee MJ. Comparative study of H2O2 and O3 effects on radiation treatment of TCE and PCE. Chemosphere. 2003;11:881–885. doi: 10.1016/S0045-6535(03)00039-0. [DOI] [PubMed] [Google Scholar]
- Cross JB, Currier RP, Torraco DJ, Vanderberg LA, Wagner GL, Gladen PD. Killing of Bacillus spores by aqueous dissolved oxygen, ascorbic acid, and copper ions. Appl Environ Microbiol. 2003;11:2245–2252. doi: 10.1128/AEM.69.4.2245-2252.2003. [DOI] [PMC free article] [PubMed] [Google Scholar]
- Dobaradaran S, Nabizadeh R, Mahvi AH, Noroozi A, Yunesian M, Rastkari N, Nazmara S, Zarei S. Kinetic and degradation efficiency of trichloroethylene (TCE) via photochemical process from contaminated water. Afr J Biotechnol. 2012;11:2006–2012. [Google Scholar]
- Ghanbarian M, Nabizadeh R, Mahvi AH, Nasseri S, Naddafi K. Photocatalytic degradation of linear alkyl benzene solfunate from aqueous solution by TiO2 nanoparticles. Iran J Environ Health Sci Eng. 2011;11:309–316. [Google Scholar]
- Mahvi AH, Ghanbarian M, Nasseri S, Khairi A. Mineralization and discoloration of textile wastewater by TiO2 nanoparticles. Desalination. 2009;11:309–316. doi: 10.1016/j.desal.2008.04.002. [DOI] [Google Scholar]
- Neppolian B, Choi HC, Sakthivel S, Arabindoo B, Murugesan V. Solar/UV-induced photocatalytic degradation of three commercial textile dyes. J Hazard Mater. 2002;11:303–317. doi: 10.1016/S0304-3894(01)00329-6. [DOI] [PubMed] [Google Scholar]
- San N, Murat K, Tuiebakhova Z, Cinar Z. Enhancement and modeling of the photocatalytic degradation of benzoic acid. J Adv Oxid Technol. 2007;11:43–50. [Google Scholar]
- So CM, Cheng MY, Yu JC, Wong PK. Degradation of azo dye Procion Red MX-5B by photocatalytic oxidation. Chemosphere. 2002;11:905–912. doi: 10.1016/S0045-6535(01)00153-9. [DOI] [PubMed] [Google Scholar]
- Huang SK, Hsieh LL, Chen CC, Lee PH, Hsieh BT. A study on radiation technological degradation of organic chloride wastewater-Exemplified by TCE and PCE. Appl Radiat Isot. 2009;11:1493–1498. doi: 10.1016/j.apradiso.2009.02.049. [DOI] [PubMed] [Google Scholar]
- Isaev AB, Aliev ZM, Alieva DS. Influence of the dissolved oxygen under pressure to electrochemical oxidation toluene and acetone aqueous mixtures. Electrochem Commun. 2007;11:1400–1403. doi: 10.1016/j.elecom.2007.01.056. [DOI] [Google Scholar]
- Munter R. Advanced oxidation processes: current status and prospects. Proc Estonian Acad Sci Chem. 2001;11:59–80. [Google Scholar]


