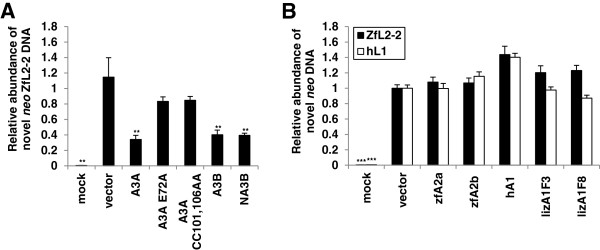
Figure 8.

A3A and A3B, but not A1 or A2, proteins decrease the amount of novel ZfL2-2 DNA. (A, B) Total cellular DNA was extracted from HeLa cells after 4 days of hygromycin selection following transfection with plasmids encoding ZfL2-2 or hL1 retrotransposons and the indicated APOBEC effector plasmids (1 μg of each). Isolated DNA was subjected to qPCR for specific quantification of intronless amplicons from the spliced neo cassette corresponding to both integrated and de novo synthesized retrotransposon DNA. Values obtained with DNA from cells transfected with an empty vector were set as 1. Histogram bars represent the means ± SD of two independent experiments. Mock controls represent untransfected cells. ***P < 0.001, **P < 0.01, *P < 0.05, t-test.
