

Abstract
During heart valve remodeling and in many disease states, valvular interstitial cells (VICs) shift to an activated myofibroblast phenotype characterized by enhanced synthetic and contractile activity. Pronounced alpha smooth muscle actin (αSMA)-positive stress fibers, the hallmark of activated myofibroblasts, are also observed in VICs cultured on stiff substrates especially in the presence of transforming growth factor-beta1 (TGF-β1), yet the detailed relationship between stiffness and VIC phenotype has not been explored. The goal of this study was to characterize VIC activation as a function of substrate stiffness over a wide range of stiffness levels including that of diseased valves (stiff), normal valves (compliant), and hydrogels for heart valve tissue engineering (very soft). VICs obtained from porcine aortic valves were cultured on stiff tissue culture plastic to activate them, then cultured on collagen-coated polyacrylamide substrates of predefined stiffness in a high-throughput culture system to assess the persistence of activation. Quantitative metrics extracted from regression analysis demonstrate that relative to a compliant substrate, stiff substrates result in higher cell numbers, more pronounced expression of αSMA-positive stress fibers, and larger spread area which is in qualitative agreement with previous studies. Our data also indicate that VICs require a much lower substrate stiffness level to “deactivate” them than previously thought. The high sensitivity of VICs to substrate stiffness demonstrates the importance of the mechanical properties of materials used for valve repair or for engineering valve tissue.
Keywords: valvular interstitial cells, stiffness, phenotype, polyacrylamide, TGF-β1
Introduction
Valvular interstitial cells (VICs) are the primary cell type found in heart valves and are responsible for the maintenance and repair of valve structure. In healthy valves, a majority of VICs exhibit characteristics of normal fibroblasts.1 However, in remodeling and disease states, when rapid matrix repair and remodeling are required, VICs express alpha smooth muscle actin (αSMA),1,2 the defining immunological marker for the myofibroblast phenotype. Fibroblasts expressing αSMA-positive stress fibers have increased contractility,3 and myofibroblasts exhibit increased matrix production and remodeling capabilities relative to quiescent fibroblasts.1 These activities are necessary for successful restoration of tissue following injury, and a small percentage of myofibroblasts is necessary for maintenance of the structure of the leaflet.4 However, excessive numbers of myofibroblasts are observed in pathological heart valve matrix remodeling,2 occurring with stenosis,5 myxomatous degeneration,2 and fibrocontractive diseases. Understanding how to modulate VIC phenotype offers the potential for more effective treatment strategies for heart valve pathologies.
VIC activation (towards the myofibroblast phenotype) has been shown, directly or indirectly, to be regulated by environmental stimuli such as dynamic loading of the valve,1,6 elevated levels of profibrotic cytokines (most notably transforming growth factor-β1 (TGF-β1);7 and elevated matrix stiffness.7-9 Even in healthy valves, VICs expressing αSMA are generally found near the outer edges of the fibrosa10 and ventricularis.6 These areas are relatively stiff, experience large stresses,6,11,12 and are adjacent to the endothelium and blood stream which could contribute to cytokine stimulation; thus, it is difficult to parse out the primary source(s) of VIC activation. The specific levels of the factors that regulate VIC activity and how they may interact in healthy and diseased valves remains poorly understood.6
In two-dimensional in vitro studies, where fibroblasts (from various sources) are cultured on substrates of tunable stiffness (e.g. polyacrylamide gels), the mechanical environment has clearly been shown to modulate a broad range of cell functions,13,14 and sufficient substrate stiffness is necessary for fibroblast force generation and myofibroblast differentiation.15 In light of the large body of literature demonstrating the importance of stiffness on fibroblasts-tomyofibroblast differentiation, it is surprising that the effects of stiffness on VIC phenotype have been largely overlooked until recently. Several in vitro studies clearly show that the percentage of VICs expressing myofibroblast characteristics is elevated on stiff two-dimensional substrates relative to soft substrates.7,9,16,17 However, only a few levels of stiffness over a limited range are utilized in these studies, thus critical levels of stiffness (thresholds for activation, saturation levels, etc.) and how different stimuli interact have not been elucidated. A notable exception is a recent study by Anseth and colleagues (2010) who cultured VICs on hydrogels with tunable stiffness gradients (7-32 kPa).8 The authors found that VIC activation occurs on substrates with Young's modulus greater than or equal to about 15 kPa and also that, by reducing the gel stiffness from ~30 kPa to ~7 kPa, the cells could be deactivated as demonstrated by reduction in αSMA-positive stress fibers. These data represent an important step in identifying critical parameters for VIC sensitivity to stiffness; however, the range of stiffness is limited in this study, and the cells were cultured at very high density. In high density monolayers, cells sense traction from neighboring cells which confounds the interpretation of stiffness-dependent results.18,19 Further characterization of VIC responses to mechanical stimuli is needed for both understanding of disease progression and for proper selection and culture of replacement cells for disease therapeutics or tissue engineered valves.
To systematically evaluate the effects of stiffness on the persistence of the activated VIC phenotype, we utilized a novel high-throughput system allowing parallel culture of cells over a broad range of stiffness levels in vitro. There is no one single characteristic stiffness level of the native aortic valve due to the non-linear strain-, direction-, and location-dependent properties of the tissue.20 Further, the valve has a tri-layered structure with relatively stiff fibrous outer layers surrounding a soft core. Therefore, the stiffness levels chosen for this study span a large range. Following pre-activation on stiff tissue culture plastic, VICs were cultured on eleven levels of polyacrylamide gel stiffness over four orders of magnitude with and without exogenous TGF-β1. The isolated cells were cultured at low density to minimize physical and chemical interactions between adjacent cells. Collagen coated surfaces, high serum (15%), and exogenous TGF-β1 were utilized to push the VICs toward a fibrotic state. Cells were evaluated for spreading area, morphology, and the presence of αSMA-positive stress fibers. By studying the cellular response over a large range of stiffness levels and utilizing regression models, we are able to identify specific thresholds for the transition to the activated phenotype.
Methods
Substrate Preparation
Collagen-coated polyacrylamide substrates were prepared based on standard protocols21 adapted to a 96-well format as previously described22 and generously donated by the Tschumperlin laboratory at the Harvard School for Public Health. Briefly, the wells of glass bottom 96-well plates were activated using 0.4% aqueous solution of g-methacryloxypropyltrimethoxysilane (Acros Organics) and polyacrylamide gel solution consisting of 0.15% tetramethylethylenediamine (Biorad), 0.075% ammonium persulfate (Biorad), and acrylamide:bisacrylamide (Biorad) of varied ratio to control stiffness was applied to the center of each well. Coverslips (5 mm diameter) were made hydrophobic to prevent adhesion to the gels by treating with Surfacil (Pierce) and then rinsing with methanol. The coverslips were placed in each well until gel polymerization after which they were removed. Sulfosuccinimidyl 6 (4-azido-2-nitrophenyl-amino)hexanoate) (Sulfo-SANPAH, Thermo Scientific) was applied to the surface of each gel and activated with UV light as previously described23 and 100 μg/ml type I collagen (Purecol, Advanced Biomatrix) was applied to the surface of each gel and incubated for four hours at room temperature. Gels were rinsed with PBS and UV sterilized prior to cell seeding. Eleven substrate stiffness levels were prepared (n=8 per stiffness) ranging from 3%/0.04% (acrylamide/bis-acrylamide) to 12%/0.585% (for specific formulations and corresponding stiffness see Table 1). Glass substrates were used as positive (rigid) control.
Table 1.
Polyacrylamide formulations and corresponding modulus values from AFM. E = sqrt(G’2 + G”2), since G" was over an order of magnitude lower than G', the gels were considered elastic.
| % Acrylamide | 3.0 | 3.0 | 3.0 | 3.0 | 7.5 | 7.5 | 7.5 | 7.5 | 12 | 12 | 12 |
| % Bisacrylamide | 0.04 | 0.05 | 0.06 | 0.11 | 0.03 | 0.05 | 0.12 | 0.24 | 0.12 | 0.24 | 0.58 |
| Measured E (Pa) | 150 | 300 | 600 | 1200 | 2400 | 4800 | 9600 | 19200 | 38400 | 76800 | 153600 |
| Measured G' (Rheometer, Pa) | 35 | 128 | 236 | 188* | 909 | 2506 | 4670 | 9856 | 11130 | 20075 | 38985 |
dataset contained significant outliers
Substrate Characterization
Stiffness of the substrates was determined using atomic force microscopy (AFM) and verified using macroscopic rheometric measurements. For AFM measurements, force-displacement curves were acquired (Asylum MFP 3D) with silicon nitride tips with 5 μm diameter borosilicate spheres and a nominal spring constant of 0.06 N/m. Prior to testing, the spring constant of the tip was measured using thermal calibration. The Young's Modulus (E) was calculated using Hertzian mechanics and a Poisson's ratio of ν=0.2 and is provided in Table 1.23,24 The low Poisson's ratio is appropriate for the surface analysis (not bulk) as previously demonstrated.25,26
The bulk stiffness of the gels was confirmed by oscillatory shear rheometry using an AR-G2 rheometer (TA Instruments). The normal force was held at 1 N and the storage modulus (G’) and loss modulus (G”) were measured at a frequency of 1 Hz. One measurement was made on each gel (n = 2) and values were averaged. As G” was over an order of magnitude lower than G’, the gels were considered elastic.
Cell Culture
Valvular interstitial cells were isolated from porcine hearts obtained from a local abattoir by standard methods.27 The isolated VICs were cultured in standard medium (Dublecco's Modified Eagle's Medium (DMEM), 100 U/ml penicillin G sodium, 100 μg/ml streptomycin sulfate, and 250 ng/ml amphotericin B supplemented with 15% fetal bovine serum (FBS, Hyclone)) at 37°C with 10% CO2. VICs at passage 2-5 were used for all experiments (mixed cultures). High serum (15%) and stiff substrates (plastic) during passaging resulted in a high level of VIC activation. Activated VICs were seeded on to the polyacrylamide substrates at a density of 2000 cells/cm2 and cultured in standard media; in the TGF-β1+ group the media was supplemented with 5 ng/ml TGF-β1 (EMD).
Immunofluorescent Staining, Microscopy, and Cell Metrics
After two days of culture, VICs were fixed and permeabilized on the polyacrylamide substrates with a 5.3% formaldehyde (Ted Pella) and 4 μM Triton X-100 (Calbiochem) solution. The cells were blocked with a 1% bovine serum albumin (BSA, Sigma) solution in PBS and probed for αSMA with the 1A4 antibody (Sigma) and visualized with Alexa 546-conjugated goat anti-mouse IgG (Invitrogen). Nuclei were visualized with Hoechst 33342 stain (Invitrogen). Cells were imaged with an epifluorescent microscope (Zeiss) with charge-coupled device camera. Five images were acquired from each substrate (n = 3 per stiffness done in duplicate). The resulting images were analyzed using Image J for the area of αSMA expression per image. The number of cells per image, the percent of cells expressing αSMA in stress fibers, and the cell morphology were manually verified for each image. Cell morphology was visually assessed and each cell was identified as having a cubodial (round or square) or elongated (spindle-like with multiple extensions or fillipodia) morphology. Many cells stained positive for αSMA in their cytosol without αSMA organized into stress fibers, and stress fiber size and density varied between cells, thus a semi-quantitative scale was developed to characterize the extent of expression of αSMA in stress fibers; specifically, the number of αSMA-positive cells was manually counted and each cell was identified as having weak or pronounced expression of αSMA in stress fibers. “Weak expression” cells exhibited mostly cytosolic αSMA with some expression in stress fibers, and “pronounced expression” cells had highly pronounced expression and stress fibers were well defined. Examples of each category of the graded scale are shown in Figure 1.
Figure 1.

Cells with “weak” or “pronounced” expression of αSMA. “Weak expression” cells (A-C) exhibited mostly cytosolic αSMA with some expression in stress fibers, and “pronounced expression” cells (D-F) had highly pronounced expression and stress fibers were well defined. Scale bar is 100 μm.
Statistical modeling and analysis
For each metric (cell density, spread area, and αSMA expression), two-way analysis of variance (ANOVA) and non-linear regression analysis were performed using commercial statistical software (Sigmaplot 11.0, Systat Software Inc.). The two-way ANOVA allowed for the determination of overall effects of stiffness and TGF-β1, and if significant differences were found, post-hoc analysis identified differences between individual groups via the Holm-Sidak method for pair-wise multiple comparison procedures with p<0.05 considered significant.
Regression analysis provides quantitative metrics for trends in the response of the cells as a function of stiffness including levels of stiffness where transitions occur between types of behavior (e.g., rounded vs. spread) and where saturation levels of each metric occur (e.g., maximum spreading area) allowing for comparison to other published studies as well as selecting stiffness levels for tissue engineering applications. Data from cells plated on the glass controls were excluded from models due to difference in surface chemistry from the polyacrylamide gels.
All metrics (i.e., density (cells/mm2), projected cell area (μm2), percentage of αSMA-positive cells (%), and percentage of cells that have pronounced expression of αSMA organized in stress fibers (%)) increased monotonically from a baseline through a transition to a saturation level, thus a four-parameter sigmoid distribution was used to model each data set:
| Equation 1 |
where y is the metric being analyzed, y0 is the baseline level, a is the saturation level, b indicates the steepness of the transition region, and Et is the stiffness where transition occurs between the baseline and saturation levels. The units of y0 and a match the metric being analyzed, and b and Et have units of stiffness (Pa). In cases where the baseline parameter, y0, resulted in over-parameterization, a three-parameter sigmoid distribution was utilized (i.e., y0 set to zero). To investigate the dependence of αSMA expression on cell area, the values for area/cell and the fraction of pronounced αSMA-positive cells from both experiment runs were fit to a linear regression model and the correlation determined.
Results
The Young's modulus of the gels ranged from 150 Pa to 154 kPa (Table 1); the values from AFM and rheological measurements were highly correlated (r2=0.98). Stiffness values from AFM measurements were used in the tables and graphs below. VICs attached and spread on the polyacrylamide gels in a stiffness-dependent manner, the spread-area and cell morphology over the range of 11 stiffness levels is shown in Figure 2. Diffuse staining for αSMA was ubiquitous and the extent of expression of αSMA was an important quantification metric in this study (Figure 1).
Figure 2.
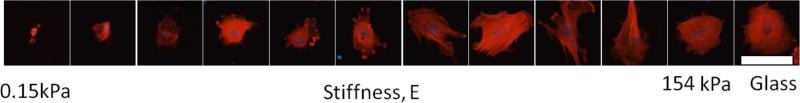
Substrate stiffness has a pronounced effect on VICs cultured on polyacrylamide gels of increasing stiffness. VICs cultured on PA gels ranging 4 orders of magnitude in stiffness (150 Pa-150 kPa) plus glass with DMEM+15% FBS without TGF-β1 for two days. Cells were probed for αSMA (red) and nuclei (blue). Scale bar is 100 μm.
VICs were plated at a relatively low density to minimize cell-cell interactions and analysis focused on single cells. Figure 3 shows that adjacent cells (cells that are nearly touching each other) are more spread, have longer projections, and migrate towards each other demonstrating the importance of analyzing only individual cells in isolation, especially on soft substrates.
Figure 3.

Cell-cell contact increases cell size and enhances cell projections. Insets show detail of individual cells. Scale bar is 100 μm.
Data from both experimental runs are provided in Table 2 with statistically significant differences listed in Table 3. Statistical differences between stiffness levels (column headings) are indicated by the letters (corresponding metrics are listed below the table). For example, for area/cell (letter a in table), 150 Pa is only significantly different from 76.8 kPa and 154 kPa groups. Data from the first experimental run are shown in the graphs; the trends in the second run were consistent with the first. The only substantial difference between runs was that the cell density of the second experimental run was roughly twice that of the first run. The variability between runs could be attributed to non-uniform cell adhesion across the substrate. The gel was homogenous across the center region but the ridge at the edge of the gel provided a topographical cue and in some samples this region had a higher cell density (only the homogenous center of the gel was included in the analysis). Differences between groups determined by the two-way ANOVA are provided in Table 3; however, in this study we focus on the trends more than statistical differences between specific groups since our goal is to describe the relationships between substrate stiffness and cell behaviors. All fits had an r2 greater than 0.5 with an average r2 for all fits of 0.8.
Table 2.
Parameters from regression analysis: y0 is the baseline level, a is the saturation level, b indicates the steepness of the transition region, and Et is the stiffness where transition occurs between the baseline and saturation levels. The units of y0 and a match the metric being analyzed, and b and Et have units of stiffness (Pa). In cases where the baseline parameter resulted in over-parameterization, a three-parameter sigmoid distribution was utilized (i.e., y0 set to zero).
| Metric | TGF-β1 | Run | a (units of metric) | b (Pa) | y0 (units of metric) | Et (Pa) | r2 |
|---|---|---|---|---|---|---|---|
| Cell Density (cells/mm2) | - | 1 | 41.8 | 99.2 | N/A | 181 | 0.72 |
| 2 | 19.2 | 223 | * | 0.18 | |||
| + | 1 | 39.8 | 441 | 192 | 0.76 | ||
| 2 | 17.6 | 100 | * | 0.42 | |||
| Cell Area (μm2) | - | 1 | 409 | 172 | 56645 | 1770 | 0.59 |
| 2 | 2620 | 6300 | * | 1270 | 0.74 | ||
| + | 1 | 966 | 176 | 917 | 1030 | 0.81 | |
| 2 | 3480 | 2490 | * | 350 | 0.83 | ||
| Fraction αSMA+stress fibers (%) | - | 1 | 0.98 | 49.1 | N/A | 148 | 0.98 |
| 2 | 0.81 | 114 | 3.70 | 0.75 | |||
| + | 1 | 0.85 | 280 | 85.8 | 0.95 | ||
| 2 | 0.76 | 370 | 80.8 | 0.89 | |||
| Fraction pronounced αSMA+stress fibers (%) | - | 1 | 0.15 | 1220 | N/A | 2450 | 0.89 |
| 2 | 0.33 | 2400 | 3420 | 0.88 | |||
| + | 1 | 0.11 | 1310 | 2840 | 0.85 | ||
| 2 | 0.36 | 603 | 1870 | 0.92 |
value below lowest stiffness level
Example: For Run 1 without TGF-β1,
Table 3.
Significance between groups from the two-way ANOVA; (p<0.05) by post hoc analysis. TGF-β1 did not have a significant effect and values are not shown. No groups were significant in the percent elongated cells and are therefore not shown in the table. Values along the axes indicate stiffness levels (Pa).
| Stiffness (Pa) | 150 | 300 | 600 | 1200 | 2400 | 4800 | 9600 | 19.2k | 38.4k | 76.8k | 154k |
| area/cell | j,k | n.s. | n.s. | n.s. | n.s. | n.s. | n.s. | n.s. | n.s. | n.s. | n.s. |
| pronounced αsma | f,g,h,i,j,k | f,g,h,i,j,k | f,g,h,i,k | i,k | i,k | n.s. | n.s. | n.s. | n.s. | n.s. | n.s. |
| cubodial | c,d,e,f,g,h,i,j,k | n.s. | n.s. | n.s. | n.s. | n.s. | n.s. | n.s. | n.s. | n.s. | n.s. |
| density | d,e,f,g,h,i,j,k, | n.s. | n.s. | n.s. | n.s. | n.s. | n.s. | n.s. | n.s. | n.s. | n.s. |
| fraction αsma | c,d,e,f,g,h,i,j,k | n.s. | n.s. | n.s. | n.s. | n.s. | n.s. | n.s. | n.s. | n.s. | n.s. |
a = vs. 150, b = vs. 300, c = vs. 600, d = vs. 1200, e = vs. 2400, f = vs. 4800, g = vs. 9600, h = vs. 19.2k, i = vs. 38.4k, j = vs. 76.8k, and k = vs. 154k, n.s. = no significant differences
Cell density (number of cells per area) increased with substrate stiffness (p<0.01); the presence of 5 ng/ml exogenous TGF-β1 did not have a significant impact (p>0.05). The softest gel (150 Pa) has significantly fewer cells than all levels greater than 600 Pa. The 300 Pa gel also has significantly fewer cells than the 4.8 kPa gel; however, even at the highest cell density, the cells were generally still sparse enough for single cell analysis. The three-parameter sigmoidal distribution fit the cell density data well (Figure 4a) and identified a transition modulus of approximately 180 Pa and a saturation density of approximately 40 cells/mm2 irrespective of the addition of 5 ng/ml TGF-β1. The cytokine decreased the slope of the curve in the low stiffness range (the b parameter was approximately four times greater in TGF-β1 group).
Figure 4.

Regression analysis of VIC responses to substrate stiffness. Each point represents the average of 3 wells with SEM of cells cultured in standard (closed symbols) or TGF-β1 supplemented (open symbols) media. Results shown here are from the first experimental run, similar trends were observed with the second experimental run and parameters from fits are provided in Table 2.
Increased cell spreading correlated with increased stiffness as shown in Figure 2 and Figure 4b. The cell area was significantly different (p<0.01) for cells between stiffness levels; specifically, cells on the softest gel (150 Pa) had significantly smaller spread area than those on the two stiffest gels (76.8 and 154 kPa), but there was not a strong trend in cell area with stiffness. The addition of TGF-β1 produced a more pronounced trend with stiffness, although it did not have an overall statistically significant effect compared to the control group. As the trend without TGF-β1 was not strong (r2=0.56 for the first run), the parameter values cannot be viewed as accurate and are thus not provided in Table 2. The data from TGF-β1 treated group were fit well by the model and provided a transition modulus of just under 1 kPa and a saturation level of approximately 1000 μm2 for the first run.
The cell morphology was also significantly impacted by the stiffness of the substrate (p<0.01); the addition of TGF-β1 did not have a significant impact on the cell shape. Specifically, the fraction of cubodial cells on the softest (150 Pa) gels was significantly greater than all stiffness levels greater than 600 kPa (data not shown). The fraction of cuboidal cells decreases from 60% to 30% as stiffness increases with the form of an inverted sigmodial curve. There were few elongated cells on the low stiffness gels, a peak of elongated cells at an intermediate stiffness, and then slow decrease in numbers on the high stiffness gels, but the differences were not statistically significant.
A portion of the VICs cultured on each stiffness level expressed at least a low level of αSMA (with the exception of the lowest stiffness, 150 Pa) (Figure 4c). The fraction of cells positive for αSMA was significantly altered (p<0.01) with both stiffness and additional TGF-β1. Specifically, the softest gels had significantly lower fractions of αSMA-positive cells than gels with stiffness levels greater than 600 Pa. Surprisingly, the presence of exogenous TGF-β1 significantly decreased the expression of αSMA overall (p<0.01) possibly due to high serum levels (see Discussion). The three-parameter sigmoid model fit the total fraction of cells positive for αSMA very well (r2 values of 0.98 and 0.95 for standard media and TGF-β1+ groups, respectively). The transition modulus was somewhat smaller for the TGF-β1 treated group (86 Pa vs. 148 Pa) but the transition region for the TGF-β1 groups was more spread out with a lower saturation level (85% vs. 98%) occurring at a higher stiffness level (~1.2 kPa vs. 300 Pa). On the stiffer gels, VICs exhibited pronounced staining for αSMA with highly aligned stress fibers. The fraction of cells with pronounced αSMA-positive stress fibers, a more appropriate metric for activation to the myofibroblast phenotype than diffuse αSMA staining, was significantly increased (p<0.01) with both stiffness and additional TGF-β1 (Figure 4c). Despite the statistical differences between control and TGF-β1+ groups, the fit parameters were similar for standard media and TGF-β1+ groups in both experimental runs with transition modulus ~2.4-2.8 kPa and a saturation level of 11 to 15% of the exhibiting pronounced αSMA expression. The percentage of cells with pronounced αSMA expression on glass was somewhat higher at 20 to 25%.
The cell size and amount of αSMA stress fibers were highly positively correlated; large cells had a high number of bright, highly aligned stress fibers (see Figure 1). Specifically, the area/cell and fraction of pronounced αSMA-positive cells were fit to a linear regression (y=mx+b) with similar slopes (m=0.0001 fraction with pronounced αSMA staining/μm2 for both groups) and y-offsets (−0.1445 and −0.1891 for standard and TGF-β1 groups respectively). Good correlations were found for both standard media (r2= 0.74) and TGF-β1 (r2= 0.82) groups.
Discussion
In this study, we analyzed the response of porcine aortic VICs to substrate stiffness over a wide range of levels using a high-throughput method. We found pronounced expression of αSMA (defined as organization of αSMA into stress fibers) above a threshold of approximately 2.5 kPa with and without 5 ng/ml TGF-β1 supplementation. Our data demonstrate that VIC activation (in the presence of 15% serum) is sensitive to a lower range of substrate stiffness levels than previous studies have demonstrated for both VICs8 and other fibroblastic cells3,28 in terms of αSMA expression and organization, cell density, size, and morphology. The high sensitivity of VICs to substrate stiffness demonstrates the importance of mechanical properties of materials used for valve repair of for engineering valve tissue. The data presented herein can be used as a reference for culturing VICs in vitro and for the design of tissue engineered valves.
High-throughput, low density, interaction study
A high-throughput approach was utilized to facilitate assessment of the effects of a large range of stiffness levels encompassing soft glycosaminoglycans characteristic of spongiosa, fibrotic (myofibroblast-populated) tissue,28 and osteogenic substrates which potentiate calcific deposits29 characteristic of heart valve disease.28,30 Gel stiffness levels chosen for this study range from those similar to hydrogels used for tissue engineered valves (E ~ 100 Pa, estimated from rheometric measurements of shear modulus)31 to values well above those calculated immediately prior to valve damage and/or failure of native and tissue engineered valves.32 Biaxial mechanical characterization of porcine heart valve leaflets found the modulus to range from 30-150 kPa depending on the direction of extension(radial or circumferential) and the strain level.20 The stiffness of (thawed) cryopreserved human valve leaflets (E ~ 1.7 kPa)33 is in the mid-range of stiffness values tested in this study.
The large number of stiffness levels allows thresholds to be determined quantitatively with and without the soluble factor TGF-β1, an important regulator of the myofibroblast phenotype. In order to minimize the effects of cell-cell signaling and elucidate the cellular responses to substrate rigidity, we cultured the VICs at a low density, allowing for analysis of single cell behavior. Cellular interaction causes cells to modify their shape and αSMA expression as shown in the images of “touching” and “non-touching” cells in Figure 3.
Matrix stiffness may also affect cell proliferation resulting in changes in cell density. The effect of matrix molecules bound to the substrates on VIC attachment has been studied extensively,34-36 yet the effects of matrix stiffness on VIC proliferation have largely been ignored. Proliferation may be beneficial in certain applications (e.g., populating an acellular scaffold), yet excessive proliferation can be detrimental to tissue development (i.e., production of ECM to replace a degrading scaffold). We found that cell density increased with stiffness until it saturated between 10 kPa and 20 kPa. Interestingly, cell density observed on the glass control is lower than that observed for cells on the stiff polyacrylamide gels, whereas, the majority of other metrics evaluated in this study (cell spread area and percentage of cells with pronounced αSMA expression) saturate towards the level observed on the glass control. Similar findings were reported by Chen et al.37 where MSCs cultured on fibronectin-coated polyacrylamide gels exhibited maximum proliferation when cultured on gels with stiffness of 10 kPa when compared to higher or lower stiffness ranges.
Cell area and morphology
Changes in cell area and morphology are readily visible indicators of changes in cytoskeletal organization and focal adhesions,23 and control of cell shape can itself modulate cell function.38 In a recent study by Liu et al.,39 six distinct VIC morphologies were identified. The different morphologies have different cell motility and cell matrix interactions, and all morphologies showed variable amount of αSMA. We chose to categorize the phenotypes into two categories based on cell morphology: cubodial cells were more round or square in appearance with few, if any extensions; elongated cells were bipolar or had many extensions.
In our study, VICs on the lower stiffness gels remained small and rounded, and as the stiffness level increases VICs exhibit not only greater area but also more extensions and fillapodia. In a study by Engler et al.13 a similar increase in projected cell area with stiffness was found, albeit over a smaller range of stiffness (1-40 kPa with 3 or 4 levels of stiffness). The authors fit the response to a hyperbolic function and a power law; we utilized a sigmoidal model to recapitulate the baseline response transitioning through an intermediate region, and saturating at higher stiffness levels observed for TGF-β1-treated VICs over broad stiffness range studied herein (Figure 4b). We do not attempt to assign any physiologic significance to the parameters, although the Et parameter is especially useful for quantifying the transition between what the cell type “feels” as “soft” (E<Et) or “stiff” (E>Et).
αSMA expression and localization
Expression of the contractile protein αSMA is the primary indicator of the myofibroblast phenotype1,2 and the organization of αSMA into stress fibers has been correlated with increased myofibroblast contractility.3 The threshold stiffness level for the appearance of αSMA-positive stress fibers in this study is lower than previously reported for both VIC (~15 kPa)8 and fibroblast activation (16-20 kPa).3,28 The in vivo the ECM threshold stiffness required for the presence of αSMA in stress fibers appears to be ~20 kPa for rat wound granulation tissue.28 However, in previous studies, limited ranges and numbers of levels of stiffness have been utilized and relatively simplistic measures of stiffness employed, thus precise thresholds are difficult to determine from previous data. Compared to a recent study with a transition stiffness of roughly above 7 kPa,8 we found the transition stiffness is somewhat lower (4.80 kPa to 9.60 kPa) for all groups and stress fibers were seen on relatively soft substrates. Further, our preliminary data with fibroblasts indicate that VICs may have a lower set-point for activation with regard to stiffness; VICs expressed more αSMA when cultured on soft polyacrylamide gels when compared to dermal fibroblasts (data not shown).
TGF-beta and serum levels
It is widely accepted that myofibroblasts are regulated by profibrotic cytokines, most notably TGF-β1, which can be secreted by endothelial cells or the VICs themselves during repair of damaged valves or diseases affecting the valve tissue.40 Previous studies have shown that VICs cultured in the presence of exogenous TGF-β1 concentrations ranging from 0 to 5 ng/ml had increased αSMA expression with increased TGF-β1 concentration.7,36 Further, TGF-β1 has been shown to interact with mechanical stimuli in the stimulation of myofibroblast activation.15 It is hypothesized that a minimal stiffness (tension) is required for the activation of latent TGF-β1.3 A single level (5 ng/ml) was chosen for this study to maximize VIC activation based on previous work by Walker et al.7 In general, we observe few differences with the addition of exogenous TGF-β1, indicating that under these specific culture conditions, VIC phenotype is more sensitive to environmental stiffness than exogenous TGF-β1. This finding adds to the controversy of the role of TGF-β1 in VIC activation.
The relatively low stiffness threshold for VIC activation may also be due, in part, to the high level of serum (15%) chosen to stimulate the cells; at this level, TGF-β1 actually inhibited some metrics of the myofibroblast phenotype. In a previous study, VICs were cultured in 15% serum allowing for cells to attach and undergo the cell cycle and then cultured in low serum (1%) during experimentation to minimize cell proliferation.8 Another study showed that serum concentrations from 1 to 15% had no effect on αSMA expression.36 The VICs used in this study were not serum starved, prior to addition of TGF-β1. The lack of additional response to 5 ng/ml supplemental TGF-β1 could also be explained by the TGF-β1 in the serum or autocrine production of TGF-β1 by the VICs.
Matrix molecules
In addition, the choice of matrix proteins bound to the surface also has an effect on VIC phenotype; VICs cultured on collagen-coated surfaces have been shown to express decreased levels of αSMA (compared to fibronectin and heparin).36 Other matrix proteins such as fibronectin and heparin have TGF-β1 binding interactions, which were found to increase VIC αSMA expression.36 Cell phenotype is clearly regulated by both matrix composition and mechanical properties (and combinations of these).13,41 As our main focus was to assess effects of graded stiffness levels and interaction with a soluble factor (TGF-β1), we chose to use a single concentration of a single ubiquitous ECM protein (collagen) to reduce the number of variables. Type I collagen was chosen as the attachment protein as it is the most prominent matrix component of the native valve and has been used extensively in polyacrylamide gel studies.23 Previous studies have shown that collagen density does not vary with polyacrylamide gel concentration and thus stiffness.23
Limitations
Evaluating other markers in combination with αSMA expression could perhaps reduce the variability attributed to VIC phenotype as well as provide additional insight on the role of matrix stiffness in the progression of valve disease. Other cellular markers correlating with VIC activation are vimentin, matrix-metalloproteinase-13/collagenase-3 and sMemb (combined with expression of αSMA).1 Recent studies of VICs have also investigated pathological markers associated with valve disease such as cofilin expression9 or calcification markers.29
The sensitivity of VICs to passaging could also be a possible explanation for lower activation stiffness levels than previously found and for differences between runs. To obtain the large number of cells analyzed in this study, passage 2-5 (mixed populations) VICs were used. The trends for the two experimental runs were similar, yet there was notable variation within and between groups for most metrics. As with most published studies, the VICs were passaged on tissue culture plastic prior to seeding on polyacrylamide. Previous studies showed that αSMA decreases with passage number (on tissue culture plastic) 36. While freshly isolated VICs more closely replicate in vivo behavior, ultimately, VICs will require passaging to obtain enough cells for large-scale studies and tissue engineering applications.
Finally, this study focuses on cellular responses to substrate rigidity in a two-dimensional system, allowing for isolation of two specific stimuli (TGF-β1 supplementation and substrate stiffness), providing the foundational information necessary for more complex studies, such as evaluating dynamic changes in stiffness and more in vivo-like three-dimensional environments. Recently, researchers have developed methods to reduce the stiffness of two-dimensional gel culture systems using photodegradable hydrogels8,42 allowing for real-time observations of changes in cellular response to its surrounding mechanical environment. Data from the latter study indicate that activated VICs can be deactivated to quiescent cells by decreasing the stiffness of the culture substrate below ~7 kPa; 8 this value is somewhat higher but within the range of the 2.5 kPa transition modulus we observe for VIC activation. However, the stiffness required for reversal (as observed in the 2D experiments) may differ in a 3D model system, further necessitating studies in 3D systems that build off the results observed here and in the stiffness reversal studies. Further, the absolute stiffness magnitude that produces specific cell behaviors (e.g., spreading) may be orders of magnitude different in three-dimensional tissues compared to two-dimensional culture,43 thus it is imperative to move to three-dimensional models for future studies. We have recently published on the effects of stiffness in a novel three-dimensional system.44 The data presented herein can be used in the design of future, three-dimensional studies with regards to transition or saturation stiffness levels for VIC activation.
Summary
This study builds on previous research on the modulation of VIC phenotype by the mechanical and chemical properties of the culture environment. We examine the phenotypic response of VICs to substrate stiffness ranging over four orders of magnitude encompassing immature to fibrotic tissue with and without exogenous TGF-β1. The 96-well, high-throughput approach facilitated the evaluation of VIC responses to gel stiffness in a highly parallel manner over a wide range of levels and allowed the identification of trends in the data such as threshold stiffness levels and saturation points - analysis not previously possible with a small number of stiffness levels. The high-throughput method should be extended to study interactions with soluble factors (cytokines, serum) and bound matrix molecules, which likely alter important stiffness threshold levels.
Although myofibroblasts have desirable extracellular matrix (ECM) synthesis characteristics for injury repair and initial generation of matrix for tissue engineering applications, excessive numbers of highly activated VICs are implicated in fibrocontractive disease states2 and should likely be avoided for heart valve engineering. However, utilizing materials with lower than 2.5 kPa stiffness may be problematic as fibroblastic cells form cell aggregates on materials of this low stiffness,18 and scaffolds below this threshold stiffness would deform excessively under the physiological loading, characteristics that are non-desirable for a biomaterial scaffold. These factors indicate that cultured VICs may not be an appropriate cell type for tissue engineering of valves if quiescent (non-myofibroblast) cells are desired to minimize neofibrotic behavior.
Acknowledgements
The authors would like to thank Justin Mih and Dan Tschumperlin, PhD of Harvard School of Public Health for preparing the polyacrylamide gels. We thank Bhavika Shah and Stephan Koehler, PhD for performing rheological measurements and Laura Firstenberg for assisting with validation of the gels. This project was supported in part by American Heart Association grant SDG 0535265N (KLB) and National Institutes of Health grant 1R15HL087257 (KLB).
References
- 1.Rabkin-Aikawa E, Farber M, Aikawa M, Schoen FJ. Dynamic and reversible changes of interstitial cell phenotype during remodeling of cardiac valves. J Heart Valve Dis. 2004;13(5):841–7. [PubMed] [Google Scholar]
- 2.Rabkin E, Aikawa M, Stone JR, Fukumoto Y, Libby P, Schoen FJ. Activated interstitial myofibroblasts express catabolic enzymes and mediate matrix remodeling in myxomatous heart valves. Circulation. 2001;104(21):2525–32. doi: 10.1161/hc4601.099489. [DOI] [PubMed] [Google Scholar]
- 3.Hinz B. The myofibroblast: paradigm for a mechanically active cell. J Biomech. 2010;43(1):146–55. doi: 10.1016/j.jbiomech.2009.09.020. [DOI] [PubMed] [Google Scholar]
- 4.Taylor PM, Batten P, Brand NJ, Thomas PS, Yacoub MH. The cardiac valve interstitial cell. Int J Biochem Cell Biol. 2003;35(2):113–8. doi: 10.1016/s1357-2725(02)00100-0. [DOI] [PubMed] [Google Scholar]
- 5.Olsson M, Rosenqvist M, Nilsson J. Expression of HLA-DR antigen and smooth muscle cell differentiation markers by valvular fibroblasts in degenerative aortic stenosis. J Am Coll Cardiol. 1994;24(7):1664–71. doi: 10.1016/0735-1097(94)90172-4. [DOI] [PubMed] [Google Scholar]
- 6.Schenke-Layland K, Riemann I, Opitz F, Konig K, Halbhuber KJ, Stock UA. Comparative study of cellular and extracellular matrix composition of native and tissue engineered heart valves. Matrix Biol. 2004;23(2):113–25. doi: 10.1016/j.matbio.2004.03.005. [DOI] [PubMed] [Google Scholar]
- 7.Walker GA, Masters KS, Shah DN, Anseth KS, Leinwand LA. Valvular Myofibroblast Activation by Transforming Growth Factor-{beta}. Implications for Pathological Extracellular Matrix Remodeling in Heart Valve Disease. Circ Res. 2004;24:24. doi: 10.1161/01.RES.0000136520.07995.aa. [DOI] [PubMed] [Google Scholar]
- 8.Kloxin AM, Benton JA, Anseth KS. In situ elasticity modulation with dynamic substrates to direct cell phenotype. 2009. [DOI] [PMC free article] [PubMed]
- 9.Pho M, Lee W, Watt DR, Laschinger C, Simmons CA, McCulloch CA. Cofilin is a marker of myofibroblast differentiation in cells from porcine aortic cardiac valves. Am J Physiol Heart Circ Physiol. 2008;294(4):H1767–78. doi: 10.1152/ajpheart.01305.2007. [DOI] [PubMed] [Google Scholar]
- 10.Della Rocca F, Sartore S, Guidolin D, Bertiplaglia B, Gerosa G, Casarotto D, Pauletto P. Cell composition of the human pulmonary valve: a comparative study with the aortic valve--the VESALIO Project. Vitalitate Exornatum Succedaneum Aorticum labore Ingegnoso Obtinebitur. Ann Thorac Surg. 2000;70(5):1594–600. doi: 10.1016/s0003-4975(00)01979-2. [DOI] [PubMed] [Google Scholar]
- 11.Liao J, Joyce EM, Sacks MS. Effects of decellularization on the mechanical and structural properties of the porcine aortic valve leaflet. Biomaterials. 2008;29(8):1065–74. doi: 10.1016/j.biomaterials.2007.11.007. [DOI] [PMC free article] [PubMed] [Google Scholar]
- 12.Merryman WD, Youn I, Lukoff HD, Krueger PM, Guilak F, Hopkins RA, Sacks MS. Correlation between heart valve interstitial cell stiffness and transvalvular pressure: implications for collagen biosynthesis. Am J Physiol Heart Circ Physiol. 2006;290(1):H224–31. doi: 10.1152/ajpheart.00521.2005. [DOI] [PubMed] [Google Scholar]
- 13.Engler A, Bacakova L, Newman C, Hategan A, Griffin M, Discher D. Substrate compliance versus ligand density in cell on gel responses. Biophys J. 2004;86(1 Pt 1):617–28. doi: 10.1016/S0006-3495(04)74140-5. [DOI] [PMC free article] [PubMed] [Google Scholar]
- 14.Wang HB, Dembo M, Wang YL. Substrate flexibility regulates growth and apoptosis of normal but not transformed cells. Am J Physiol Cell Physiol. 2000;279(5):C1345–50. doi: 10.1152/ajpcell.2000.279.5.C1345. [DOI] [PubMed] [Google Scholar]
- 15.Arora PD, Narani N, McCulloch CA. The compliance of collagen gels regulates transforming growth factor-beta induction of alpha-smooth muscle actin in fibroblasts. Am J Pathol. 1999;154(3):871–82. doi: 10.1016/s0002-9440(10)65334-5. [DOI] [PMC free article] [PubMed] [Google Scholar]
- 16.Yperman J, De Visscher G, Holvoet P, Flameng W. Molecular and functional characterization of ovine cardiac valve-derived interstitial cells in primary isolates and cultures. Tissue Eng. 2004;10(9-10):1368–75. doi: 10.1089/ten.2004.10.1368. [DOI] [PubMed] [Google Scholar]
- 17.Taylor PM, Allen SP, Yacoub MH. Phenotypic and functional characterization of interstitial cells from human heart valves, pericardium and skin. J Heart Valve Dis. 2000;9(1):150–8. [PubMed] [Google Scholar]
- 18.Guo WH, Frey MT, Burnham NA, Wang YL. Substrate rigidity regulates the formation and maintenance of tissues. Biophys J. 2006;90(6):2213–20. doi: 10.1529/biophysj.105.070144. [DOI] [PMC free article] [PubMed] [Google Scholar]
- 19.Reinhart-King CA, Dembo M, Hammer DA. Cell-cell mechanical communication through compliant substrates. Biophys J. 2008;95(12):6044–51. doi: 10.1529/biophysj.107.127662. [DOI] [PMC free article] [PubMed] [Google Scholar]
- 20.Billiar KL, Sacks MS. Biaxial mechanical properties of the natural and glutaraldehyde treated aortic valve cusp: Part I - Experimental results. Journal of Biomechanical Engineering. 2000;122(1):23–30. doi: 10.1115/1.429624. [DOI] [PubMed] [Google Scholar]
- 21.Benigo KA, Lo CM, Wang YL. Flexible polyacrylamide substrata for the analysis of mechanical interactions at cell-substratum adhesions. Methods in Cell Biology: Elsevier Science. 2002:325–339. doi: 10.1016/s0091-679x(02)69021-1. [DOI] [PubMed] [Google Scholar]
- 22.Liu F, Mih JD, Shea BS, Kho AT, Sharif AS, Tager AM, Tschumperlin DJ. Feedback amplification of fibrosis through matrix stiffening and COX-2 suppression. J Cell Biol. 2010;190(4):693–706. doi: 10.1083/jcb.201004082. [DOI] [PMC free article] [PubMed] [Google Scholar]
- 23.Pelham RJ, Jr., Wang Y. Cell locomotion and focal adhesions are regulated by substrate flexibility. Proc Natl Acad Sci U S A. 1997;94(25):13661–5. doi: 10.1073/pnas.94.25.13661. [DOI] [PMC free article] [PubMed] [Google Scholar]
- 24.Wang M, Hill RJ. Electric-field-induced displacement of charged spherical colloids in compressible hydrogels. Soft Matter. 2008;4(5):1048–1058. doi: 10.1039/b719319j. [DOI] [PubMed] [Google Scholar]
- 25.Bryant S, Anseth KS. Photopolymerization of hydrogel scaffold. In: Ma P, Elisseeff J, editors. Scaffolding in tissue engineering. Taylor and Francis Group; Boca Raton, FL: 2005. pp. 71–90. [Google Scholar]
- 26.Young R, Lovell PA. Introduction to Polymers. Chapman & Hall; London, UK: 1991. [Google Scholar]
- 27.Hoerstrup SP, Kadner A, Melnitchouk S, Trojan A, Eid K, Tracy J, Sodian R, Visjager JF, Kolb SA. Grunenfelder J and others. Tissue engineering of functional trileaflet heart valves from human marrow stromal cells. Circulation. 2002;106(12 Suppl 1):I143–50. [PubMed] [Google Scholar]
- 28.Goffin JM, Pittet P, Csucs G, Lussi JW, Meister JJ, Hinz B. Focal adhesion size controls tension-dependent recruitment of alpha-smooth muscle actin to stress fibers. J Cell Biol. 2006;172(2):259–68. doi: 10.1083/jcb.200506179. [DOI] [PMC free article] [PubMed] [Google Scholar]
- 29.Yip CY, Chen JH, Zhao R, Simmons CA. Calcification by valve interstitial cells is regulated by the stiffness of the extracellular matrix. Arterioscler Thromb Vasc Biol. 2009;29(6):936–42. doi: 10.1161/ATVBAHA.108.182394. [DOI] [PubMed] [Google Scholar]
- 30.Engler AJ, Carag-Krieger C, Johnson CP, Raab M, Tang HY, Speicher DW, Sanger JW, Sanger JM, Discher DE. Embryonic cardiomyocytes beat best on a matrix with heart-like elasticity: scar-like rigidity inhibits beating. J Cell Sci. 2008;121(Pt 22):3794–802. doi: 10.1242/jcs.029678. [DOI] [PMC free article] [PubMed] [Google Scholar]
- 31.Pedersen J, Swartz M. Mechanobiology in the third dimension. Ann Biomed Eng. 2005;33(11):1469–90. doi: 10.1007/s10439-005-8159-4. [DOI] [PubMed] [Google Scholar]
- 32.Robinson PS, Tranquillo RT. Planar biaxial behavior of fibrin-based tissue-engineered heart valve leaflets. Tissue Eng Part A. 2009;15(10):2763–72. doi: 10.1089/ten.tea.2008.0426. [DOI] [PMC free article] [PubMed] [Google Scholar]
- 33.Jiao T, Clifton RJ, Converse GL, Hopkins RA. Measurements of the Effects of Decellularization on Viscoelastic Properties of Tissues in Ovine, Baboon, and Human Heart Valves. Tissue Eng Part A. 2011;2011:26. doi: 10.1089/ten.tea.2010.0677. [DOI] [PMC free article] [PubMed] [Google Scholar]
- 34.Cushing MC, Liao JT, Jaeggli MP, Anseth KS. Material-based regulation of the myofibroblast phenotype. Biomaterials. 2007;28(23):3378–87. doi: 10.1016/j.biomaterials.2007.04.005. [DOI] [PubMed] [Google Scholar]
- 35.Masters KS, Darshita NS, Gennyne W, Leslie AL, Kristi SA. Designing scaffolds for valvular interstitial cells: Cell adhesion and function on naturally derived materials. Journal of Biomedical Materials Research Part A. 2004;71A(1):172–180. doi: 10.1002/jbm.a.30149. [DOI] [PubMed] [Google Scholar]
- 36.Cushing MC, Liao JT, Anseth KS. Activation of valvular interstitial cells is mediated by transforming growth factor-beta1 interactions with matrix molecules. Matrix Biol. 2005;24(6):428–37. doi: 10.1016/j.matbio.2005.06.007. [DOI] [PubMed] [Google Scholar]
- 37.Chen WL, Likhitpanichkul M, Ho A, Simmons CA. Integration of statistical modeling and high-content microscopy to systematically investigate cell-substrate interactions. Biomaterials. 2010;31(9):2489–97. doi: 10.1016/j.biomaterials.2009.12.002. [DOI] [PubMed] [Google Scholar]
- 38.Chen CS, Mrksich M, Huang S, Whitesides GM, Ingber DE. Geometric control of cell life and death. Science. 1997;276(5317):1425–8. doi: 10.1126/science.276.5317.1425. [DOI] [PubMed] [Google Scholar]
- 39.Liu AC, Gotlieb AI. Characterization of cell motility in single heart valve interstitial cells in vitro. Histol Histopathol. 2007;22(8):873–82. doi: 10.14670/HH-22.873. [DOI] [PubMed] [Google Scholar]
- 40.Martin P. Wound healing--aiming for perfect skin regeneration. Science. 1997;276(5309):75–81. doi: 10.1126/science.276.5309.75. [DOI] [PubMed] [Google Scholar]
- 41.Rowlands AS, George PA, Cooper-White JJ. Directing osteogenic and myogenic differentiation of MSCs: interplay of stiffness and adhesive ligand presentation. Am J Physiol Cell Physiol. 2008;295(4):C1037–44. doi: 10.1152/ajpcell.67.2008. [DOI] [PubMed] [Google Scholar]
- 42.Frey MT, Wang YL. A photo-modulatable material for probing cellular responses to substrate rigidity. Soft Matter. 2009;5:1918–1924. doi: 10.1039/b818104g. [DOI] [PMC free article] [PubMed] [Google Scholar]
- 43.Pedersen JA, Swartz MA. Mechanobiology in the third dimension. Ann Biomed Eng. 2005;33(11):1469–90. doi: 10.1007/s10439-005-8159-4. [DOI] [PubMed] [Google Scholar]
- 44.John J, Quinlan AT, Silvestri C, Billiar K. Boundary stiffness regulates fibroblast behavior in collagen gels. Ann Biomed Eng. 2010;38(3):658–73. doi: 10.1007/s10439-009-9856-1. [DOI] [PMC free article] [PubMed] [Google Scholar]