Abstract
Introduction:
There is great disparity in tobacco outlet density (TOD), with density highest in low-income areas and areas with greater proportions of minority residents, and this disparity may affect cancer incidence. We sought to better understand the nature of this disparity by assessing how these socio-demographic factors relate to TOD at the national level.
Methods:
Using mixture regression analysis and all of the nearly 65,000 census tracts in the contiguous United States, we aimed to determine the number of latent disparity classes by modeling the relations of proportions of Blacks, Hispanics, and families living in poverty with TOD, controlling for urban/rural status.
Results:
We identified six disparity classes. There was considerable heterogeneity in relation to TOD for Hispanics in rural settings. For Blacks, there was no relation to TOD in an urban moderate disparity class, and for rural census tracts, the relation was highest in a moderate disparity class.
Conclusions:
We demonstrated the utility of classifying census tracts on heterogeneity of tobacco risk exposure. This approach provides a better understanding of the complexity of socio-demographic influences of tobacco retailing and creates opportunities for policy makers to more efficiently target areas in greatest need.
INTRODUCTION
Smoking prevalence varies greatly by socioeconomic status (SES), with smoking being a more prominent health risk factor among the poor and less educated than any other group. Whereas the overall prevalence of smoking among U.S. adults is 19.7%, prevalence varies markedly by education level (Thorne, Malarcher, Maruice, & Carabally, 2008). For instance, smoking prevalence is highest among adults with the least education (44% among adults with a general educational development (GED) diploma and 33% among adults with 9–11 years of education) but lowest among adults with an undergraduate (11.4%) or graduate degree (6.2%). These disparities may impact cancer incidence, particularly lung cancer. Indeed, there is socio-demographic variation in incidence and death rates (Siegel, Ward, Brawley, & Jemal, 2011). Males with the lowest education (≤12 years) have a five-fold greater risk of lung cancer than males with the greatest education (≥16 years). The incidence of cancers of the lungs and bronchus is also 23% higher for Black than for White males. Moreover, in a cross-national study assessing death rates among males aged 35–69 years, there was a 12% absolute difference in the risk of being killed by smoking between males at the lowest (17% risk) and highest (5% risk) social strata (Jha et al., 2006). These socio-demographic-related disparities in smoking and smoking-related health outcomes, therefore, suggest the need for policies to ameliorate risk factors for smoking that are more prevalent among individuals and communities of low SES.
One factor that may affect socio-demographic-related health disparities is tobacco outlet density (TOD). TOD is disproportionally high in areas of disadvantage (areas with low median household incomes), as well as in areas including a greater proportion of Hispanic and Black residents (Hyland et al., 2003; Peterson, Lowe, & Reid, 2005; Rodriguez, Carlos, Adachi-Mejia, Berke, & Sargent, 2012; Schneider, Reid, Peterson, Lowe, & Hughey, 2005; Yu, Peterson, Sheffer, Reid, & Schnieder, 2010). This raises the question of whether high TOD in disadvantaged neighborhoods and neighborhoods with greater proportions of Blacks and Hispanics contribute to higher tobacco usage in those areas, and what policies could ameliorate this disparity. Another important question is whether socio-demographic indicators of disadvantage and race/ethnicity affect TOD equally across the entire “contiguous” United States. Answering this question could lead to more informed research into the relation between TOD and tobacco use, and as a consequence help us determine how best to target policy interventions to those living in areas at greatest risk for high tobacco use. For instance, the proportion of families living in poverty, or the proportion of Blacks or Hispanics, may have a stronger relation with TOD in some regions yet a negligible relation in other regions. Certainly, regional differences exist in smoking rates among minorities. For instance, whereas the proportion of Black males regularly smoking was 24% nationally, it was 74% in the Black Belt region of Alabama (Shuaib et al., 2011).
In our own work, we found differences in how the proportion of Hispanics and Blacks relates to TOD when comparing rural and urban census tracts (Rodriguez et al., 2012). The association between the proportion of Hispanics and outlet density was greater in urban than in rural census tracts, but greater in rural than in urban census tracts for Blacks. These results indicate heterogeneity in how socio-demographic characteristics relate to density and that a policy addressing TOD disparities equally ignoring such heterogeneity, although well intentioned, may be less effective than a policy-taking heterogeneity into account. Yet, it is possible there is greater heterogeneity in how these socio-demographic factors relate to density than simple urban/rural differences. Further study would therefore be useful to indicate if indeed additional heterogeneity exists and provide critical information to inform future policies before they are developed. This could result in a tremendous saving in public health funding as resources could be directed to the communities at greatest risk from excessive exposure.
Building upon our prior work (Rodriguez et al., 2012), we aimed to address this important issue by assessing whether latent heterogeneity exists in the “relations” between the above socio-demographic risk factors and TOD beyond those found comparing rural and urban census tracts. If greater heterogeneity exists, high disparity areas can be identified regionally, informing future studies on the relation of tobacco outlet density to tobacco usage, and consequently public policy approaches could be tailored to target census tracts within high disparity areas. Such data could lead to a more effective, targeted approach to reducing disparities in how tobacco is sold and perhaps health disparities.
METHODS
Tobacco Outlet Density
A national dataset of tobacco outlets was created using North American Industry Classification System (NAICS) codes (Table 1). The Office of Management and Budget developed NAICS for use by Federal statistical agencies, classifying all business establishments based on their primary self-reported activity. We obtained geocoded data from the NAICS Association (www.naics.com) for all likely points of sale for tobacco products in 2007, including establishments coded as tobacco stores, grocery stores, gas stations, and convenience stores, identifying 306,695 addresses nationwide. Although some researchers have raised concerns that commercial datasets may underestimate the number of tobacco outlets (Longacre et al., 2011), our prior validation of NAICS Association data using license data at the state level supports its validity as an indicator of TOD (Rodriguez et al., 2012).
Table 1.
North American Industry Classification System Codes
| Code | Outlet |
|---|---|
| 445310 | Beer, wine, and liquor stores |
| 445120 | Convenience stores |
| 722410 | Drinking places (alcoholic beverages) |
| 447190 | Other gasoline stations |
| 445110 | Supermarkets and other grocery (except convenience) stores |
We wished to adjust our dependent measure for population density so that the relation between socio-demographics and TOD could be interpreted as a health disparity; in some census tracts, we expected the relation between poverty and TOD to be much higher than expected given the population density. We produced a nationwide density surface for the tobacco outlets with adaptive bandwidth kernel density estimation (Carlos, Shi, Sargent, Tanski, & Berke, 2010; Shi, 2010) using the LandScan™ Global Population Data Set (Oak Ridge National Laboratory, 2007). This method allows for the influence (bandwidth) of each tobacco outlet to be limited to a surrounding population, which in our case encompassed 1,000 people. This mathematically constrains the influence of a single outlet to a small spatial area in regions where the population density is high (e.g., urban areas), whereas in rural areas the influence of the tobacco outlet is allowed to be larger geographically. For sparsely populated regions, we limited the influence of each outlet to a 25-km radius to prevent the density calculation from expanding beyond a distance one might reasonably expect to travel to purchase tobacco. We then used this density surface to calculate the mean TOD for each of the 64,909 census tracts in the contiguous United States by averaging the densities contained within each polygonal census tract. The resultant density unit, our dependent variable, is therefore measured in tobacco outlets per 1,000 population.
Socio-Demographic Variables
Several socio-demographic variables were used to define and characterize disparity classes based on how these variables relate with TOD. Guided by the U.S. Census 2000 tract level data, our socioeconomic and ethnic group indicators of disparity were the proportions of Blacks, Hispanics, and families with income below the poverty level within a census tract (US Census Bureau, 2002a, 2002b). We selected these variables as they have known relations with smoking (CDC, 2010). The socio-demographic variables were divided into quartiles to facilitate interpreting their associations with TOD. A two-tier urban/rural classification scheme derived from the Rural-Urban Commuting Area (RUCA) classification system (Berke et al., 2010; Using RUCA Data, 2006; Washington State Department of Health, 2008) was also used as a known-group variable; our prior research suggested differences in the relations of these socio-demographic indicators with TOD between rural and urban census tracts (Rodriguez et al., 2012).
Statistical Analysis
To understand the effects of socio-demographic characteristics on TOD, we conducted a latent variable mixture modeling method (LVMM; Lubke & Muthén, 2005; Muthén, 2001a), mixture regression analysis (MRA; Muthén & Muthén, 1998–2010). Similar to latent profile analysis (LPA) and latent class analysis (LCA), MRA allows one to assess for unobserved (latent) heterogeneity. Unlike LPA and LCA, however, which assess for latent heterogeneity in a set of observed variables, MRA assesses for latent heterogeneity in multiple regression analysis, allowing one to assess whether the relations between a set of predictor variables and an outcome variable are homogenous or differ across sample/population units. In the present study, we assessed for latent heterogeneity in the relations between three socio-demographic predictor variables (proportions of Blacks, Hispanics, and families living in poverty) and TOD across all census tracts within the contiguous United States. Latent variable mixture modeling was also used to identify the optimal number of latent disparity classes, employing a combination of empirical and substantive criteria; we operationalized the term disparity to infer that with high disparity classes, the relation between SES, race/ethnicity, and tobacco outlet density is much higher than would be expected given population density. The term “disparity class” therefore is indicative of “inequality” in how tobacco outlets are distributed across the latent classes, with TOD being disproportionately higher in some classes than others. Given our interest in identifying latent disparity classes, this precluded using methods such as discriminant analysis with which researchers aim to find the best function discriminating participants grouped in predetermined categories (Stevens, 2009). Further, MRA and other LVMM methods (e.g., LCA, LPA) were deemed more appropriate for our purposes than more traditional clustering methods such as K-means clustering, as LVMM methods are model based, provide empirical criteria for selecting the optimal number of classes, allow for the use of multiple variable scales beyond simple interval/ratio data, and allow for the inclusion of predictors in the models (Magidson & Vermunt, 2002). That said, the empirical criteria used to determine the optimal number of disparity classes included the Bayesian information criterion (BIC) and the adjusted BIC (aBIC) along with classification quality (Entropy) (Nylund, Asparouhov, & Muthén, 2007). Lower values of each information criterion are preferred. Entropy (ε) refers to the likelihood of a sample unit (i.e., census tract) being placed in its correct class, with values closer to 1.0 preferable. Regarding substantive criteria, as a large number of classes may produce classes that are statistically but not practically different, and small class sizes may result in classes that are difficult to interpret meaningfully (Huang, 2012), we stopped adding classes when the smallest class size was less than 5% of the number of census tracts. Latent variable mixture modeling was conducted using Mplus 6.11 software (Muthen & Muthen, 1998–2011).
Our model also controlled for known urban/rural differences in TOD, as the results of our prior work showed clear urban/rural differences in TOD (Rodriguez et al., 2012). Controlling for these two known groups (urban/rural) meant that the number of classes found would double. If, for instance, three latent classes were found across all census tracts, before accounting the urban/rural known-group difference, dividing our sample into urban versus rural census tracts would now result in six classes (three latent classes × two known groups = six classes). This affected our substantive interpretation of classes. Finally, we employed multinomial logistic regression analysis to characterize class membership on our three socio-demographic variables, providing the odds of a census tract belonging to a given class in relation to a comparison class (Muthén, 2001a, 2001b).
RESULTS
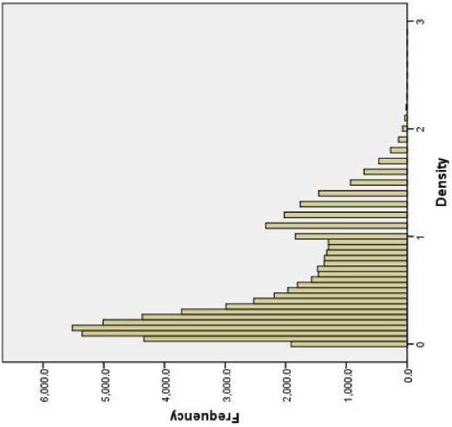
Table 2 (row 1) presents the mean log transformed TOD (with histograms), proportion of urban and rural, and the proportion of Blacks, Hispanics, and families living in poverty for the 64,909 census tracts overall. Of these census tracts, 45,000 (69%) were considered urban by the two-tier RUCA classification. Mean TOD overall was 0.52 outlets per 1,000 people; the histogram clearly supports two classes with respect to outlet density alone, given its bimodality. As with TOD, distributions for the proportions of families living in poverty, Blacks, and Hispanics were skewed left, with means of 0.10, 0.14, and 0.11, respectively.
Table 2.
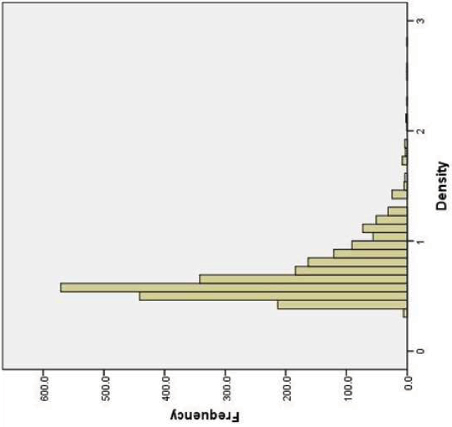
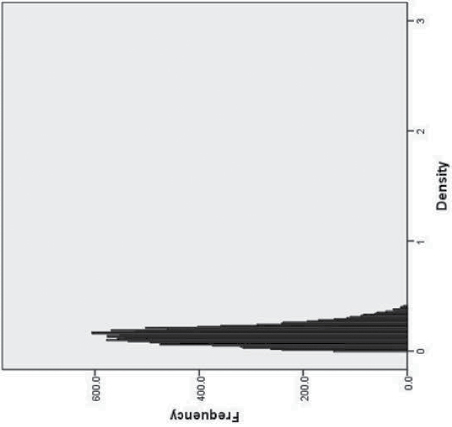
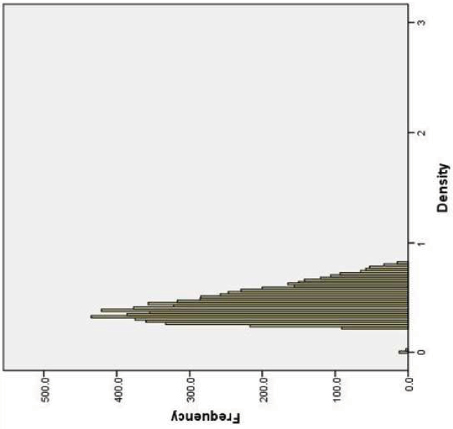
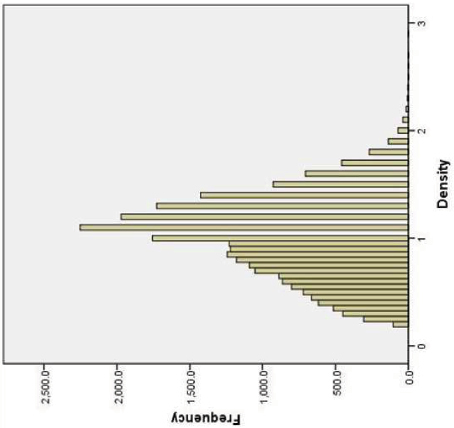
Mean Tobacco Outlet Density and Proportions of Families Living in Poverty, Blacks, and Hispanics per Census Tract for the Entire Sample and Divided by Latent Disparity Class, With Accompanying Density Histograms
| Urban/rural | Disparity class | Tracts | Density | % Hispanic | % Black | % Poverty | |||||
|---|---|---|---|---|---|---|---|---|---|---|---|
| M | SD | M | SD | M | SD | M | SD | ||||
|
Overall | 64863 | .52 | .45 | .12 | .19 | .14 | .24 | .10 | .10 | |
|
Rural | Low | 5623 | .06 | .04 | .06 | .13 | .06 | .13 | .09 | .08 |
|
Rural | Moderate | 12203 | .25 | .10 | .05 | .11 | .08 | .15 | .10 | .07 |
|
Rural | High | 2402 | .69 | .27 | .09 | .18 | .09 | .19 | .12 | .09 |
|
Urban | Low | 12915 | .15 | .08 | .08 | .14 | .11 | .19 | .07 | .08 |
|
Urban | Moderate | 7022 | .44 | .14 | .15 | .20 | .18 | .25 | .12 | .11 |
|
Urban | High | 24698 | .97 | .38 | .17 | .23 | .20 | .29 | .12 | .13 |
Our model selection process was used to compare models with four, six, and eight latent classes. Each model was constrained by the binary known-class variable urban/rural status, limiting our number of classes to multiples of two (see Methods). The BIC and the aBIC, two information criterions used to identify the optimal number of latent classes, improved as our model changed from four to six and then to eight classes. However, when examining the final class counts and proportions based on the posterior probabilities, the model with eight latent disparity classes included one class containing less than 5% of census tracts, our substantive minimum class size (see Methods). Thus, we stopped at six classes, with low, moderate, and high disparity for urban and rural census tracts (3×2).
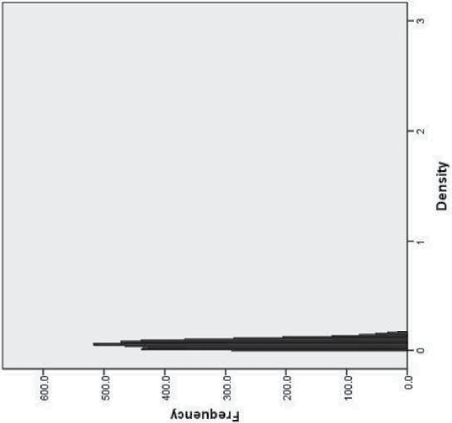
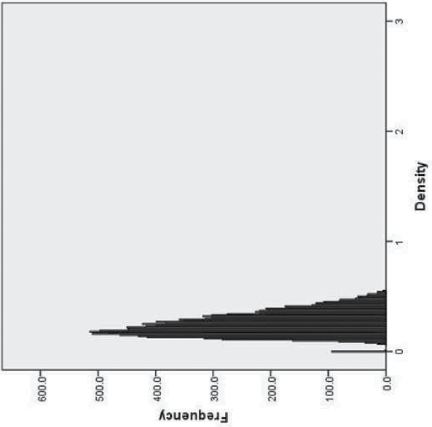
Descriptive statistics for the six disparity classes are presented in Table 1. We labeled our disparity classes based on (a) urban/rural status, and (b) the size of the relations between the proportion of Hispanics, Blacks, and families living in poverty, and log transformed TOD. Although the means for TOD and its demographic predictors tended to be higher in the higher disparities classes, there was considerable overlap (illustrated for TOD by the frequency histograms in Table 2). That is, census tracts with relatively low TOD could still be included in the high disparity class if the mixture model indicated a strong relation between poverty and TOD in that tract.
Relation Between Census Descriptors and Tobacco Outlet Density Across Classes
Table 3 presents the multiple regression analysis results within each disparity class. Each multiple regression analysis within the disparity classes included three predictor variables: the proportion of Hispanics, the proportion of Blacks, and the proportion of families living in poverty within a census tract. To facilitate interpretation, we provide the percent change in TOD for a quartile increase in each of our three predictor variables. Regarding rural classes, each quartile increase in the proportion of Hispanics was associated with a 5.7% increase in TOD for high disparity tracts, but only a 1% and a 1.5% “decrease” for low and moderate disparity tracts, respectively. Regarding poverty, each quartile increase in the proportion of families living in poverty was associated with a 9% increase in TOD for high disparity tracts, a 4.3% increase for moderate disparity tracts, and 0.8% increase for low disparity tracts. However, for Blacks, there was less difference across disparity class in the rural census tracts. Each quartile increase in the proportion of Blacks within a census tract was associated with a 0.8% increase in TOD for high and low disparity tracts, respectively, and a 1.4% increase for moderate disparity tracts.
Table 3.
Percentage Change (and p Values) in Tobacco Outlet Density for a Quartile Increase in the Proportion of Hispanics, Blacks, and Families Living in Poverty, Stratified by Urban and Rural Disparity (Low, Moderate, and High) Class
| % Change | p value | % Change | p value | |
|---|---|---|---|---|
| Rural low | Urban low | |||
| Hispanic | −1.0 | <.0001 | .20 | .12 |
| Black | 0.80 | <.0001 | 1.40 | <.0001 |
| Poverty | 0.80 | <.0001 | 2.40 | <.0001 |
| Rural moderate | Urban moderate | |||
| Hispanic | −1.50 | <.0001 | 7.30 | <.0001 |
| Black | 1.40 | <.0001 | 2.20 | <.0001 |
| Poverty | 4.30 | <.0001 | 9.00 | <.0001 |
| Rural high | Urban high | |||
| Hispanic | 5.70 | <.0001 | 10.70 | <.0001 |
| Black | 0.80 | .18 | 5.70 | <.0001 |
| Poverty | 8.70 | <.0001 | 14.40 | <.0001 |
With respect to the urban classes, each quartile increase in proportion of Hispanics was associated with a 10.7% increase in TOD for high disparity tracts, and a 7.3% and a 0.2% increase for moderate and low disparity tracts, respectively. Each quartile increase in proportion of Blacks within a census tract was associated with a 5.7% increase in TOD for high disparity tracts, a 2.2% increase for moderate disparity tracts, and a 1.4% increase for low disparity census tracts. Finally, each quartile increase in proportion of families in poverty was associated with a 14.4% increase in TOD for high disparity tracts, a 9% increase for moderate disparity tracts, and a 2.4% increase for low disparity tracts.
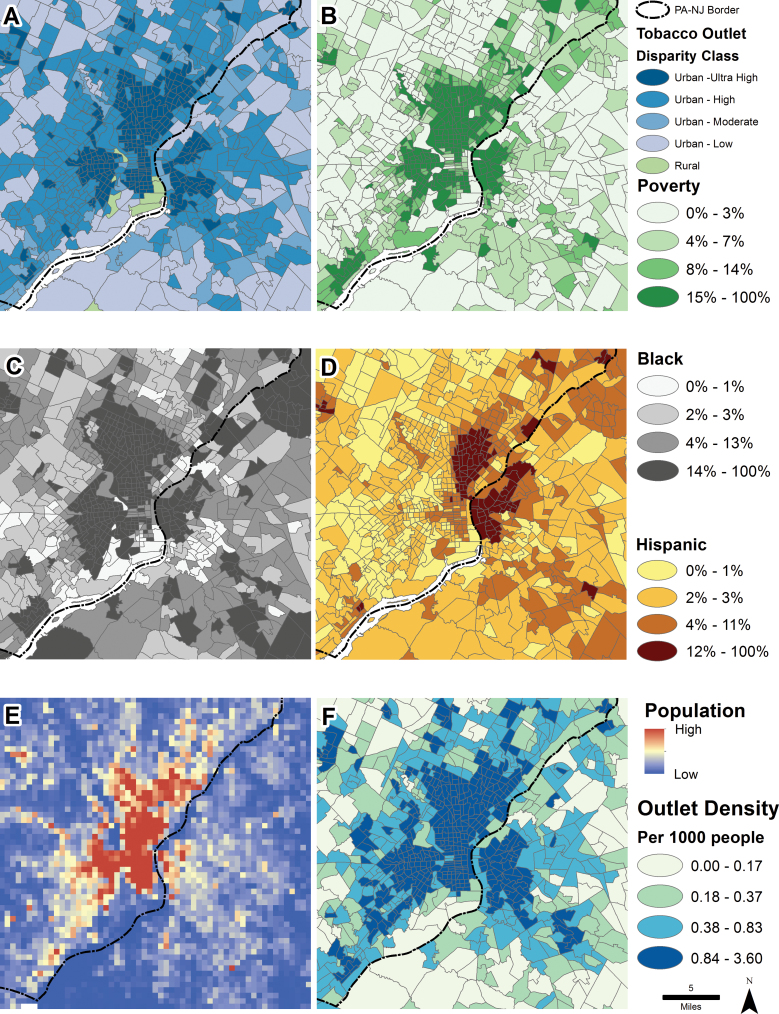
Figure 1 presents a map of Philadelphia, PA, and Camden, NJ, and their suburbs broken down by disparity class and the proportion of Blacks, Hispanics, and families living in poverty within a census tract. As we selected an urban setting, we lumped the three rural disparity classes together into a single urban class for simplicity of presentation. Further, as the majority of both urban centers (Philadelphia and Camden) are high disparity, we further divided the high disparity class into two categories based on TOD (≥1 per thousand persons vs. <1 per thousand persons). Map A illustrates how we can map disparity classes derived from mixture regression analysis to target areas of highest disparity for intervention. Maps B, C, and D allow for comparison with the proportion of Blacks, Hispanics, and families living in poverty in census tracts. Most of the areas in Map A with ultrahigh TOD disparity are also areas with high proportions of Blacks, Hispanics, and families living in poverty. These are also, especially in Philadelphia, areas of high population density (Map E), illustrating the residual correlation between high TOD disparity and high population density. Figure 1 may provide a useful tool for policy makers to illustrate the excessively high TOD faced by poor and minority families.
Figure 1.
Visual comparison of latent classes and related socio-demographic variables in the greater Philadelphia, PA/Camden, NJ, area. All maps except (E) show census tract boundaries, and all except (A) and (E) are categorized in quartiles. (A) illustrates the three disparity classes, (B) the percentage of families with income below the poverty level, (C) the percentage of Blacks, (D) the percentage of Hispanics, (E) shows population counts and the settlement pattern using the LandScan™ Global Population Data Set (Oak Ridge National Laboratory), and (F) is a map of tobacco outlet density categorized in quartiles.
Characterizing Class Membership on Socio-Demographic Variables
The results of the multinomial logistic regression analysis predicting class membership from the proportion families living in poverty, Blacks, and Hispanics are presented in Table 4. A total of six comparisons were made. Thus, to maintain an overall probability of a Type I error at .05, each comparison was deemed significant only if the p value was ≤.01. As there are large differences between urban and rural classes, we assessed urban and rural classes separately. However, each multinomial logistic regression model included all three socio-demographic predictor variables.
Table 4.
Multinomial Logistic Regression Analysis Odds Ratios (OR) and 95% Confidence Intervals (CI) Predicting Disparity Class (Low, Moderate, and High) Membership for a Quartile Increase in the Proportion Hispanics, Blacks, and Families Living in Poverty Within a Census Tract, Stratified by Rural/Urban Status
| Predictor | Rural census tracts | Urban census tracts | ||
|---|---|---|---|---|
| OR | 95% CI | OR | 95% CI | |
| Low versus high | Low versus high | |||
| Hispanic | 0.91 | 0.87, 0.95 | 0.68 | 0.67, 0.70 |
| Black | 0.95 | 0.90, 0.99a | 0.91 | 0.89, 0.93 |
| Poverty | 0.78 | 0.74, 0.82 | 0.68 | 0.67, 0.70 |
| Moderate versus high | Moderate versus high | |||
| Hispanic | 0.82 | 0.78, 0.85 | 1.05 | 1.02, 1.08 |
| Black | 1.02 | 0.97, 1.06 | 1.08 | 1.05, 1.11 |
| Poverty | 0.83 | 0.79, 0.87 | 1.03 | 1.01, 1.06 |
| Low versus moderate | Low versus moderate | |||
| Hispanic | 1.12 | 1.08, 1.15 | 0.65 | 0.63, 0.67 |
| Black | 0.93 | 0.90, 0.96 | 0.84 | 0.82, 0.87 |
| Poverty | 0.93 | 0.90, 0.96 | 0.66 | 0.64, 0.68 |
Note. aDue to the overall large number of comparisons (n = 6), we did a Bonferonni correction to maintain an overall α of .05. Thus, to be considered significant, each p value must be ≤.01. For the effect of a quartile increase in the proportion of Blacks on low versus high disparity, p =.02; thus, we did not consider this effect significant despite the 95% CI not including 1.00.
Among rural census tracts, each quartile increase in proportion of families in poverty was associated with a 22% decrease (odds ratio [OR] = 0.78, 95% CI = 0.74, 0.82) in the odds of a census tract being a rural low than a rural high disparity class. Similarly, a quartile increase in proportion of Hispanics (OR = 0.91, 95% CI = 0.87, 0.95) and Blacks (OR = 0.95, 95% CI = 0.90, 0.99) was associated with a decrease in the odds of a census tract being a rural low versus a rural high disparity class.
Comparing the rural moderate with the rural high latent class, each quartile increase in proportion of families in poverty (OR = 0.83, 95% CI = 0.79, 0.87) and Hispanics (OR = 0.82, 95% CI = 0.78, 0.85) was associated with a decrease in the odds of a census tract being a rural moderate versus a rural high disparity class. However, there was no difference in proportion of Blacks between the rural moderate and the rural high latent class.
Comparing the rural low with the rural moderate latent class, each quartile increase in proportion of families living in poverty was associated with at 7% decrease (OR = 0.93, 95% CI = 0.90, 0.96) in the odds of a census tract being a rural low than a rural moderate disparity class. Similarly, a quartile increase in proportion of Blacks (OR = 0.93, 95% CI = 0.90, 0.96) was associated with a 7% decrease in the odds of a census tract being a rural low versus a rural moderate disparity class. By contrast a quartile increase in proportion of Hispanics was associated with 12% increase (OR = 1.12, 95% CI =1.08, 1.15) in the odds of a census tract being a rural low versus a rural moderate disparity class.
Among urban census tracts, in comparing the low with the high disparity classes, each quartile increase in proportion of families living in poverty was associated with 32% decrease (OR = 0.68, 95% CI = 0.67, 0.70) in the odds of a census tract being an urban low compared with an urban high disparity class. Similarly, each quartile increase in proportion of Hispanics (OR = 0.68, 95% CI = 0.67, 0.70) and Blacks (OR = 0.91, 95% CI = 0.89, 0.93) was associated with a decrease in the odds of a census tract being an urban low versus an urban high disparity class.
In comparing the urban moderate with the urban high disparity class, each quartile increase in proportion of families living in poverty was associated with at 3% increase (OR = 1.03, 95% CI = 1.01, 1.06) in the odds of a census tract being an urban moderate compared with an urban high disparity class. Further, a quartile increase in proportion of Hispanics (OR = 1.05, 95% CI = 1.02, 1.08) and Blacks (OR = 1.08, 95% CI = 1.05, 1.11) was associated with an increase in the odds of a census tract being an urban moderate versus an urban high disparity class.
Finally, in comparing the urban low with the urban moderate disparity classes, each quartile increase in proportion of families living in poverty was associated with 34% decrease (OR = 0.66, 95% CI = 0.64, 0.68) in the odds of a census tract being an urban low compared with an urban moderate disparity class. Similarly, each quartile increase in proportion of Hispanics (OR = 0.65, 95% CI = 0.63, 0.67) and Blacks (OR = 0.84, 95% CI = 0.82, 0.87) was associated with a decrease in the odds of a census tract being an urban low versus an urban moderate disparity class.
DISCUSSION
Researchers have found disparities in TOD related to socio-demographic factors, especially the proportion of Blacks, Hispanics, and families living in poverty within a community (Hyland et al., 2003; Peterson et al., 2005; Rodriguez et al., 2012; Schneider et al., 2005; Yu et al., 2010). In our prior work, we augmented these important results with the finding that known disparities in TOD differ depending upon rural and urban settings (Rodriguez et al., 2012). This significant finding suggests that ignoring known sources of heterogeneity in analyzing relations between socio-demographic community factors and TOD may lead to drastically misunderstanding how the environment influences tobacco-related health disparities. With respect to public health policy, broadly targeting public health interventions to areas without first accounting for such known-group differences may be an ineffective if not fiscally wasteful approach. With budgetary constraints and other bureaucratic factors influencing policy making, a more sound approach would be to first undertake additional study of the factors influencing these TOD disparities and determine if the relation of key socio-demographic characteristics with TOD is best defined by simple rural–urban differences or if there is even further latent heterogeneity. Doing so would not only help us to subsequently identify which areas are at greatest need for intervention but also areas of no relation and areas in which the relations may even be reversed. This is precisely what we undertook in the present study, with our ultimate aim being to provide public health researchers with a specific method to identify populations and regions at greatest risk for tobacco-related disease, providing specific targets for policy intervention.
As the results of this study suggest, the relations between the proportions of Hispanics, Blacks, and families living in poverty and TOD are not as simple as portrayed by methods not accounting for unobserved heterogeneity (e.g., logistic regression analysis, discriminant analysis) or even methods (e.g., K-means clustering) which although allowing for the assessment of heterogeneity do not permit assessment of heterogeneity in the relations among predictors and an outcome variable (Magidson & Vermunt, 2002). Consistent with our prior study (Rodriguez et al., 2012), we found that the relation between the proportion of Hispanics in a census tract and TOD was stronger in urban than in rural settings. However, exploring latent classes, we uncovered additional heterogeneity within urban and rural settings, a finding that could result in considerable savings when designing interventions aimed at reducing tobacco exposure and tobacco-related health disparities among Hispanics. For instance, although it appears that the relation between socio-demographic characteristics and density is stronger for Hispanics in urban than in rural settings, exploring latent heterogeneity, we found that there are rural census tracts in which this relation is strong and others in which it is even reversed, with the proportion of Hispanics associated with a reduction in TOD. This suggests that targeting resources to Hispanics within rural census tracts equally regardless of disparity class would likely yield little benefit and could represent a substantial waste of resources better directed elsewhere. At minimum, these results suggest more research must be undertaken to understand what processes affect the distribution of tobacco outlets within rural Hispanic communities.
Unlike the results for the proportion of Hispanics, those related to the proportion of Blacks and families living in poverty were more consistent with a positive relation between density and disparity in the distribution of tobacco outlets, with the greatest effects being in urban compared with rural settings. However, even considering Blacks, there was heterogeneity in the results. For instance, within rural census tracts, the proportion of Blacks did not discriminate between moderate and high disparity census tracts. Further, each quartile increase in the proportion of Blacks within a census tract was associated with an 8% increase (OR = 1.08, 95% CI = 1.05, 1.11) in the odds of being an urban moderate than an urban high disparity class. This was an unexpected result as based on the results of our prior study (Rodriguez et al., 2012), it would appear that the proportion of Blacks was linearly associated with density and should therefore be highest in the highest disparity class. Still further, when exploring relations within classes, the relation between proportion Blacks and TOD was strongest in the moderate disparity rural class. This finding could explain why we saw a stronger relation for the proportion of Blacks with TOD in rural compared with urban census tracts in our prior study (Rodriguez et al., 2012). Thus, irrespective of the socio-demographic factor analyzed, it would appear unwise to undertake policy without first thoroughly studying heterogeneity in relations. Indeed, in an era of restricted resources and shrinking public health prevention budgets, wisely targeting communities at highest risk of tobacco exposure has the potential to offer the greatest impact. A reasonable first step could be to define latent disparity classes as done here and then to map census tracts nationally by disparity class (see Figure 1). Such maps, besides providing important visual stimuli to policy makers, could be used to identify regions for further study to identify the community and cultural factors driving TOD disparities, whether differences in TOD actually influence smoking uptake, particularly in youth as they are at greatest risk for initiation and progression to regular smoking and nicotine dependence (Audrain-McGovern et al., 2004), and quitting among established smokers, and most importantly, prompt policy action to reduce disparities.
Although this study represents an important start, further studies should be undertaken to now examine the role of TOD in behavior, especially in areas with minorities. Other possible applications of this method include examining different exposure risks linked to poor health and socio-demographic variation, such as alcohol and fast-food consumption (Berke et al., 2010; Boone-Heinonen et al., 2011; Chartier & Caetano, 2010; Gregson, 2011). It is only through such a thoughtful approach that we will ensure the greatest impact for our investment in public health.
This study has a number of limitations. We are not measuring tobacco use directly but only retail outlets that sell tobacco; therefore, it is premature to assume that density is positively associated with use. Future studies will need to assess the relation between the two. Similarly, our use of business list data captures business types historically known to sell tobacco but does not exclude or include specific stores that might have individual policies regarding tobacco sales. It is impractical to collect licensee lists for all 50 states at the same point in time due to variation in recording, data availability, and variability in the year data are recorded. However, as noted previously, in a sensitivity analysis between tobacco licensing in Washington State and business list data, the two were similar (Rodriguez et al., 2012). Further, our measure of TOD does not perfectly control for population density. Thus, population density may still confound the relations found between our three socio-demographic variables and TOD. However, by controlling for urban/rural status in addition to accounting for population density as we did in developing our TOD measure, we attempted to minimize the possible confounding. We did not study other racial or ethnic groups, which may display different risk patterns than Blacks and Hispanics. Further, we did not incorporate educational attainment into the model. We only selected those variables consistent with prior research and which have been found to be significant predictors of TOD (Hyland et al., 2003; Peterson et al., 2005; Schneider et al., 2005; Siahpush, Jones, Singh, Timsina, & Martin, 2010; Yu et al., 2010). Finally, it is important to note that associations found in the present analysis may change over time, particularly with changing demographics, economic circumstances, and changing attitudes about smoking. It would be interesting to attempt to replicate these findings prospectively, using repeated measures of TOD and time-varying measures of socio-demographic factors.
Despite these limitations, we demonstrated the potential power of classifying census tracts based on heterogeneity of risk of exposure to tobacco. This approach provides a better understanding of the complexity of socioeconomic and demographic influences of tobacco retailing and creates an opportunity for those committed to tobacco prevention to more efficiently target areas in greatest need, with a better understanding of the factors leading to greater exposure risk. As such, this study suggests a need to address heterogeneity of relations when examining large regional and national datasets, and consequently forms a basis for applying policies to limit new tobacco retailing in locations where poor and minorities face excessively high tobacco density.
FUNDING
This study was funded by a grant from the National Institutes of Health, National Cancer Institute (R01 CA077026). EMB was supported by the National Institute of Aging 1K23AG036934.
DECLARATION OF INTERESTS
None declared.
REFERENCES
- Audrain-McGovern J., Rodriguez D., Tercyak K. P., Cuevas J., Rodgers K., Patterson F. (2004). Identifying and characterizing adolescent smoking trajectories. Cancer Epidemiology, Biomarkers & Prevention, 13, 2023–2034 [PubMed] [Google Scholar]
- Berke E. M., Tanski S. E., Demidenko E., Alford-Teaster J., Shi X., Sargent J. D. (2010). Alcohol retail density and demographic predictors of health disparities: A geographic analysis. American Journal of Public Health, 100, 1967–1971.10.2105/ajph.2009.170464 [DOI] [PMC free article] [PubMed] [Google Scholar]
- Boone-Heinonen J., Gordon-Larsen P., Kiefe C. I., Shikany J. M., Lewis C. E., Popkin B. M. (2011). Fast food restaurants and food stores: Longitudinal associations with diet in young to middle-aged adults: The CARDIA study. Archives of Internal Medicine, 171, 1162–1170.10.1001/archinternmed.2011.283 [DOI] [PMC free article] [PubMed] [Google Scholar]
- Carlos H. A., Shi X., Sargent J., Tanski S., Berke E. M. (2010). Density estimation and adaptive bandwidths: A primer for public health practitioners. International Journal of Health Geographics, 9, 39. 10.1186/1476- 072X-9-39 [DOI] [PMC free article] [PubMed] [Google Scholar]
- CDC (2010). Vital signs: Current cigarette smoking among adults aged ≥ 18 years—United States, 2009. Morbidity and Mortality Weekly Report, 59, 1135–1140 [PubMed] [Google Scholar]
- Chartier K., Caetano R. (2010). Ethnicity and health disparities in alcohol research. Alcohol Research & Health, 33, 152–160 [PMC free article] [PubMed] [Google Scholar]
- Gregson J. (2011). Poverty, sprawl, and restaurant types influence body mass index of residents in California counties. Public Health Reports, 126(Suppl. 1), 141–149 [DOI] [PMC free article] [PubMed] [Google Scholar]
- Huang D. (2012). Frequently asked questions Retrieved from http://www.caldar.org/html/faq.html
- Hyland A., Travers M. J., Cummings K. M., Bauer J., Alford T., Wieczorek W. F. (2003). Tobacco outlet density and demographics in Erie County, New York. American Journal of Public Health, 93, 1075–1076. 10.2105/AJPH.93.7.1075 [DOI] [PMC free article] [PubMed] [Google Scholar]
- Jha P., Peto R., Zatonski W., Boreham J., Jarvis M. J., Lopez A. D. (2006). Social inequalities in male mortality, and in male mortality from smoking: Indirect estimation from national death rates in England and Wales, Poland, and North America. Lancet, 368, 367–370.10.1016/S0140-6736(06)68975–7 [DOI] [PubMed] [Google Scholar]
- Longacre M. R., Primack B. A., Owens P. M., Gibson L., Beauregard S., Mackenzie T. A., Dalton M. A. (2011). Public directory data sources do not accurately characterize the food environment in two predominantly rural states. Journal of the American Dietetic Association, 111, 577–582.10.1016/j.jada.2011.01.008 [DOI] [PMC free article] [PubMed] [Google Scholar]
- Lubke G. H., Muthén B. (2005). Investigating population heterogeneity with factor mixture models. Psychological Methods, 10, 21–39. 10.1037/1082-989X.10.1.21 [DOI] [PubMed] [Google Scholar]
- Magidson J., Vermunt J. K. (2002). Latent class models for clustering: A comparison with K-means. Canadian Journal of Marketing Research, 20, 37–44 [Google Scholar]
- Muthén B. O. (2001a). Latent variable mixture modeling. In Marcoulides G. A., Schumaker R. E. (Eds.), New developments and techniques in structural equation modeling (pp. 1–33). Mahwah, NJ: Lawrence Erlbaum Associates [Google Scholar]
- Muthén B. O. (2001b). Second-generation structural equation modeling with a combination of categorical and continuous latent variables: New opportunities for latent class/latent growth modeling. In Collins L., Sayer A. (Eds.), New methods for the analysis of change (pp. 291–322). Washington, DC: APA [Google Scholar]
- Muthen L. K., Muthen B. O. (1998–2011). Mplus user’s guide (6th ed). Los Angeles, CA: Muthen & Muthen [Google Scholar]
- Muthén L. K., Muthén B. O. (1998–2010). Mplus User’s Guide (6th ed). Los Angeles, CA: Muthen & Muthen [Google Scholar]
- Nylund K. L., Asparouhov T., Muthén B. O. (2007). Deciding on the number of classes in latent class analysis and growth mixture modeling. A Monte Carlo simulation study. Structural Equation Modeling, 14, 535–569.10.1080/10705510701575396 [Google Scholar]
- Oak Ridge National Laboratory (2007) LandScan Global Population Database Oak Ridge, TN: Retrieved from http://www.ornl.gov/sci/landscan [Google Scholar]
- Peterson N. A., Lowe J. B., Reid R. J. (2005). Tobacco outlet density, cigarette smoking prevalence, and demographics at the county level of analysis. Substance Use & Misuse, 40, 1627–1635. 10.1080/10826080500222685 [DOI] [PubMed] [Google Scholar]
- Rodriguez D., Carlos H. A., Adachi-Mejia A. M., Berke E. M., Sargent J. D. (2012). Predictors of tobacco outlet density nationwide: A geographic analysis. Tobacco Control.10.1136/tobaccocontrol-2011–050120 [DOI] [PMC free article] [PubMed] [Google Scholar]
- Schneider J. E., Reid R. J., Peterson N. A., Lowe J. B., Hughey J. (2005). Tobacco outlet density and demographics at the tract level of analysis in Iowa: Implications for environmentally based prevention initiatives. Prevention Science, 6, 319–325. 10.1007/s11121-005-0016-z [DOI] [PubMed] [Google Scholar]
- Shi X. (2010). Selection of bandwidth type and adjustment side in kernal density estimation over inhomogeneious backgrounds. International Journal of Geographical Information Science, 24, 643–660. 10.1080/13658810902950625 [Google Scholar]
- Shuaib F., Foushee H. R., Ehiri J., Bagchi S., Baumann A., Kohler C. (2011). Smoking, sociodemographic determinants, and stress in the Alabama Black Belt. The Journal of Rural Health, 27, 50–59.10.1111/j.1748-0361.2010.00317.x [DOI] [PubMed] [Google Scholar]
- Siahpush M., Jones P. R., Singh G. K., Timsina L. R., Martin J. (2010). Association of availability of tobacco products with socio-economic and racial/ethnic characteristics of neighbourhoods. Public Health, 124, 525–529. 10.1016/j.puhe.2010.04.010 [DOI] [PubMed] [Google Scholar]
- Siegel R., Ward E., Brawley O., Jemal A. (2011). Cancer statistics, 2011: The impact of eliminating socioeconomic and racial disparities on premature cancer deaths. CA: A Cancer Journal for Clinicians, 61, 212–236.10.3322/caac.20121 [DOI] [PubMed] [Google Scholar]
- Stevens J. P. (2009). Applied multivariate statistics for the social sciences (5th ed). New York, NY: Routledge [Google Scholar]
- Thorne S. L., Malarcher A., Maruice E., Carabally R. (2008). Cigarette smoking among adults—United States, 2007. Morbidity and Mortality Weekly Report, 57, 1221–1226 [PubMed] [Google Scholar]
- US Census Bureau (2002a). Census 2000 summary file 1. Washington, DC: US Census Bureau [Google Scholar]
- US Census Bureau (2002b). Census 2000 summary file 3. Washington, DC: US Census Bureau [Google Scholar]
- Using RUCA Data (2006). Retrieved from http://depts.washington.edu/uwruca/ruca-uses.php
- Washington State Department of Health (2008). Guidelines for using rural-urban classification systems for public health assessment Retrieved from http://www.doh.wa.gov/data/guidelines/RuralUrban2.htm
- Yu D., Peterson N. A., Sheffer M. A., Reid R. J., Schnieder J. E. (2010). Tobacco outlet density and demographics: Analysing the relationships with a spatial regression approach. Public Health, 124, 412–416. 10.1016/j.puhe.2010.03.024 [DOI] [PubMed] [Google Scholar]


