Abstract
Purpose
To investigate the relationship between long-term glycemic control and photopic negative response (PhNR) changes in the blue flash ERG in adolescents with type 1 diabetes (T1D) without diabetic retinopathy (DR).
Methods
After light adaptation, ERG responses to 1.60 cd·s/m2 blue (420 nm) flashes (blue flash ERG) and 3.0 cd·s/m2 white flashes (LA 3.0 ERG) were recorded in 22 patients (age range, 12 to 19 years) and 28 age-similar control subjects. The primary outcome measure was the amplitude of the PhNR. Secondary outcome measures were the amplitude and implicit time of the a-wave and b-wave. Multiple regression analyses were conducted with glycated hemoglobin (HbA1c) values and the time since diagnosis of T1D as covariates.
Results
Blue flash ERG PhNR amplitudes were reduced (P = 0.005) in patients compared with control subjects. Multiple regression analysis demonstrated that a 1-unit increase in HbA1c was associated with a 15% decrease in the blue flash ERG PhNR amplitude (r = 0.61, P = 0.003). Compared with controls blue flash ERG a-waves (P = 0.03) and b-waves (P = 0.02) were delayed in patients but were not significantly associated with HbA1c or time since diagnosis of T1D. None of the ERG measures in the LA 3.0 ERG were significantly different in patients compared with controls.
Conclusions
Poorer long-term glycemic control is associated with worsening inner retinal dysfunction involving short-wavelength cone pathways of adolescents with T1D and no clinically visible DR. Future studies are warranted to determine whether changes in the blue flash ERG PhNR are a predictive marker of subclinical DR.
Diabetic retinopathy (DR) is a chronic microvascular complication of diabetes mellitus and the single leading cause of visual impairment among those of working age in developed countries.1 It affects nearly all people with type 1 diabetes (T1D) with a duration of disease between 15 and 20 years.2 Recent data show that the prevalence of DR has decreased due to improved diabetes management and glycemic control.3 In view of the prevailing diabetes epidemic, however; there is increasing concern about the burden that DR will have on young populations. Every year approximately 78,000 children world-wide are diagnosed with T1D and the incidence increases yearly by 3%.4
Current standards for the diagnosis of DR rely on the presence of clinically visible pathology on retinal examination. These standards are based on the modified Airlie House classi-fication which identifies vascular lesions and related deposits as important clinical features of DR.5 Some of these clinical features are sight-threatening but they are not visible on clinical examination until the disease has progressed to a later stage. Clinical markers of DR in its early stage are needed to reduce the risk of vision loss in adolescents with diabetes.
The function of short-wavelength sensitive (S)-cone pathways in patients with diabetes may have unique clinical relevance for identifying early changes associated with DR. S-cone pathways are particularly vulnerable to disease and insult.6–9 A loss of functional integrity in S-cone pathways occurs before10–13 and worsens with clinically visible vascular changes in patients with diabetes.8,14,15 Functional losses in S-cone pathways occurring in early stage DR are accompanied by less severe or no functional abnormalities in L/M-cone pathways.7
The full-field short-wavelength cone sensitive electroretinogram (S-cone ERG) is an objective measure of functional abnormality in S-cone retinal pathways.16–21 Decreased S-cone ERG b-wave amplitudes are evident in patients with diabetes before the appearance of vascular lesions.22,23 S-cone ERG b-wave implicit times are delayed when vascular changes are clinically visible.24 A negative-going wave appears after the b-wave in the S-cone ERG.17,24–26 This response is known as the photopic negative response (PhNR) and it was identified originally in primates using red flashes on a rod-saturating blue background.27 The PhNR is related to the activity of retinal ganglion and/or amacrine cells.27,28 The reduction of the PhNR in the S-cone ERG of patients with glaucoma is consistent with deficits in the inner retina.25,26 Inner retinal changes occur in patients with diabetes before vascular changes29–32 and with early stage DR.33–35 Considering the unique vulnerability of S-cone pathways to retinal disease,6–9 the S-cone PhNR may be a sensitive marker of DR in adolescents before it is clinically visible.
Glycated hemoglobin (HbA1c) levels are a measure of long-term glycemic control. The Diabetes Control and Complications Trial (DCCT) demonstrated that a high HbA1c, an indicator of poor long-term glycemic control, is a strong risk factor for the increased incidence and progression of DR.36,37 Glycemic control is particularly impaired in adolescents with diabetes. Puberty worsens metabolic control in this age group38,39 and is a high-risk period for the development of clinically visible DR.40,41
The primary purpose of the present study was to investigate the relationship between long-term glycemic control and PhNR changes in the blue flash ERG in adolescents with T1D. The blue flash ERG records responses primarily from S-cone pathways. We conducted a multiple regression analysis with known risk factors for DR, HbA1c, and time since diagnosis, as covariates. Secondary outcome measures of interest were the amplitude and implicit time of the a-wave and b-wave. The light-adapted 3.0 ERG (LA 3.0 ERG) was used to assess the integrity of the cone response in this cohort.
Methods
Subjects
Thirty-six adolescents with T1D were recruited at the Hospital for Sick Children. Inclusion criteria were duration of T1D of at least 5 years, age 12 to 20 years, and normal visual development. Participants with DR were excluded based on seven-field, 30° stereoscopic fundus photographs. These photographs were taken at the time of testing and graded by retinal specialists according to the Airlie House classification. Patients and controls with a refractive error worse than ±5 diopters (D) (spherical equivalent), poor visual acuity (worse than 0.30 logMAR), and/or abnormal color vision test results were excluded. Also excluded were patients with an HbA1c measurement taken >3 months before the ERG test date, hemoglobinopathy, any other eye disease, those with neurologic disorders, and those taking medications affecting visual or retinal function.
Of the 36 patients who were recruited, 14 were excluded. These included three who did not attend the scheduled testing session and one patient who requested to be withdrawn from the study. Ten patients did not meet the inclusion criteria: three patients had vascular retinal abnormalities, two patients had refractive errors greater than − 5D, one patient had protanopia, and four patients had a HbA1c measurement >3 months before the test date. Although another patient had an HbA1c measurement 5 months from the ERG test date, this patient was not excluded, as their HbA1c readings remained relatively unchanged over a year before the ERG recording. HbA1c measurements were obtained at The Hospital for Sick Children using a cation exchange column (Bio-Rad Variant II HPLC; Bio-Rad Laboratories Inc, Hercules, CA). All samples were tested using this equipment. Data from the remaining 22 patients were analyzed. Twenty-eight age-similar participants acted as control subjects. Informed consent was obtained from all participants after the purpose, protocol, and potential harms and benefits of the study were explained. All procedures were approved by the Research Ethics Board at the Hospital for Sick Children and conformed to the tenets of the Declaration of Helsinki.
Data Acquisition
All participants were tested at the Hospital for Sick Children. Because ambient blood glucose levels are known to affect ERG responses in patients with diabetes,42,43 patients’ blood glucose levels were measured by a registered nurse at least three times: before psychophysical testing, before ERG testing, and after ERG testing. Glucose levels were maintained between 4 to 10 mM/L with light exercise and/or the administration of insulin.
Each participant had one eye randomly selected for testing. The untested eye was occluded. Participants had visual acuity (ETDRS, logMAR) and contrast sensitivity (Pelli-Robson) assessed. Color vision was tested using Hardy Rand and Rittler (H.R.R.) Pseudoisochromatic Plates and the Mollon-Reffin Minimalist test. A topical corneal anesthetic (0.5% proparacaine) and dilation eye drops (2.5% phenylephrine and 1% tropicamide) were instilled in the tested eye. A dilated ophthalmic examination was performed on most patients (18/22). It included the measurement of refractive error and funduscopic assessment of ocular media and posterior pole. HbA1c values and the date of diagnosis of T1D were obtained from hospital records.
Full-Field Electroretinography
Blue flash ERGs and LA 3.0 ERGs were recorded in participants. A Ganzfeld stimulator was used to provide all stimulus flashes and background luminance (ColorDome; Diagnosys LLC, Lowell, MA). Blue flashes were obtained by placing a filter (Wratten 47B; Kodak; Rochester, NY) in front of the Ganzfeld Xenon (white) flash. White flashes were obtained through a combination of red, green, blue, and amber LEDs (ColorDome; Diagnosys LLC) with spectral curves peaking at 635 nm, 513 nm, 470 nm, and 594 nm respectively. Recordings were obtained using a visual evoked potential system (Espion V5; Diagnosys LLC). The incoming signal was sampled at 1000 Hz and filtered with a 0.312–300 Hz bandpass filter.
A ground electrode was taped onto the forehead and a bipolar contact lens electrode (Burian-Allen; Hansen Ophthalmic Development Laboratory; Iowa City, IA) was placed on the cornea. Participants were light-adapted for 10 minutes using an ISCEV-recommended 29 cd/m2 white rod-suppressing background and thereafter for 30 seconds using an amber (λmax =594 nm, 11 cd/m2) background. Blue flash ERGs were recorded after light-adaptation using 2 Hz low intensity blue (λmax =420 nm, 1.60 cd · s/m2) flashes on an amber (λmax 594 nm, 11 cd/m2) background. LA 3.0 ERGs were recorded according to ISCEV standards. Flashes in both protocols were brief (4 ms) and presented for 20 seconds.
Data Analysis
Recordings containing obvious and/or large artifacts were identified manually and excluded. The remaining recordings were used to generate an average waveform. The primary outcome measure was the amplitude of the photopic negative response (PhNR). Secondary outcome measures were the amplitude and implicit time of the a-wave and b-wave.
The amplitude of the blue flash ERG PhNR was measured from baseline (0 mV) at 135 ms after flash onset. A fixed time point was chosen because pilot data from 13 controls and 13 patients demonstrated that in most patients blue flash PhNRs did not have a clear voltage minimum. The timing of the group voltage minimum of the PhNR from control data were therefore used to score patient data (Fig. 1).
Figure 1.
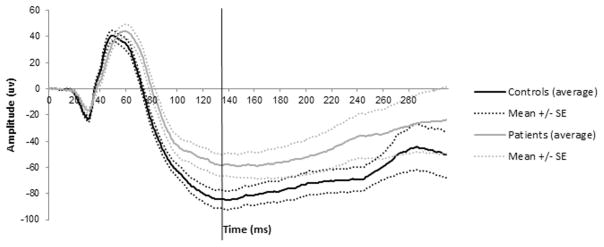
Patient and control blue flash ERG responses (pilot data: 13 controls, 13 patients).
The amplitude of the LA 3.0 ERG PhNR was measured at the maximum negativity between the b-wave and the i-wave in line with previous studies.44–46 The amplitude of the a-wave was measured at the maximum negativity relative to the baseline and the amplitude of the b-wave was measured from the maximum peak relative to the a-wave.
Two-tailed t-tests comparing patient and control PhNR amplitudes and a-wave and b-wave amplitude and implicit times were conducted (P < 0.05 was considered significant). A Mann-Whitney (nonparametric) test was applied to data where the residuals were nonnormally distributed. To correct for multiple comparisons, P values were adjusted using the Šidàk procedure. The Šidàk procedure is less conservative than the traditional Bonferroni procedure.47 ERG measures showing a significant difference from the control group were investigated further in a multiple regression model. Descriptive statistics were performed using statistical software (SPSS version 15.0; SPSS Inc, Chicago, IL) and are reported as the mean ± SD.
Multiple Regression Modeling
The relationship between blue flash ERG abnormalities and long-term glycemic control was examined using a multiple linear regression model. The influence of duration of diabetes was considered in the analysis. A normal multiple regression is used to model data that are continuous, while controlling for other variables in the model. A regression consists of parameter estimates (βs) which are an index of the change in the dependent variable per unit change in the independent variable.48
Multiple regression analysis was conducted on patient data using statistical software (R version 2.8.1; http://www.R-project.org). The outcome variable was the blue flash ERG PhNR amplitude. Covariates considered for inclusion in the model were HbA1c (percentage) closest to the date of testing and time since diagnosis of T1D (years). Two covariates were considered because at least 10 subjects per covariate are required to conduct a multiple regression analysis of adequate power.48 Time since diagnosis of T1D and HbA1c were not correlated. This allowed for their simultaneous inclusion in the regression analysis.
A manual backward selection procedure was used to arrive at the final model. P ≥ 0.157 was the criterion used in the preliminary stages of model fitting for the removal of a covariate.48,49 This criterion was used to prevent potential variables from being excluded too early on in the analysis.49 In the final stage, P < 0.05 was used for the covariate to be included in the final model.48
The likelihood ratio test was used to test the null hypothesis that none of the covariates significantly explains the variability in the dependent variable. The presumed final model was therefore compared with a model without covariates (all βs = 0). The likelihood ratio test evaluates how well one model fits the data compared with another.48
Results
Demographic data and psychophysical testing results for patients and controls are shown in Table 1. There were no significant differences in age, visual acuity, or contrast sensitivity between patients and controls. Color vision results in both groups were within normal limits. Most patients (19/22) were diagnosed with T1D before the age of 10 years. Approximately half of the patients had duration of T1D between 8 and 13 years and an HbA1c value between 7.4% and 8.8%. These HbA1c values are higher than the 7.0% target recommended by the Canadian Diabetes Association.50 The average duration of time between HbA1c measurements and ERG recordings was 0.09 ± 1.84 months.
Table 1.
Demographic Data and Psychophysical Testing Results for Patients and Control Subjects
| Patients (n = 22) | Controls (n = 28) | |
|---|---|---|
| Age at testing, y | 15.89 ± 1.65 (12.67 to 18.22) | 16.90 ± 3.26 (12.58 to 25.21) |
| Sex, male/female | 8/14 | 9/19 |
| Time since diagnosis, y | 11.00 ± 3.54 (5.36 to 15.87) | — |
| HbA1c, % | 8.38 ± 1.32 (6.40 to 12.00) | — |
| Visual acuity, logMAR | −0.02 ± 0.10 (−0.20 to 0.24) | −0.03 ± 0.14 (−0.26 to 0.28) |
| Contrast sensitivity | 1.70 ± 0.18 (1.05 to 1.95) | 1.68 ± 0.20 (1.05 to 1.95) |
Data are presented as mean ± SD (range).
Blue flash ERG PhNR amplitudes were reduced (P = 0.005) in patients compared with control subjects. The amplitude of the PhNR in the LA 3.0 ERG was not significantly different in patients compared with controls (Fig. 2).
Figure 2.
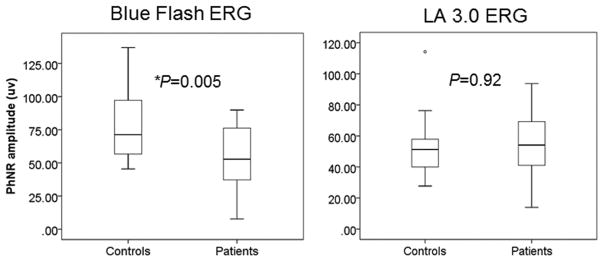
Between-group comparisons of the PhNR amplitude in the blue flash ERG and LA 3.0 ERG (*P < 0.05). Boxes represent the 25th and 75th percentiles, the line represents the median. Whiskers represent 1.5 interquartile range (IQR), circles are data beyond the 1.5 IQR.
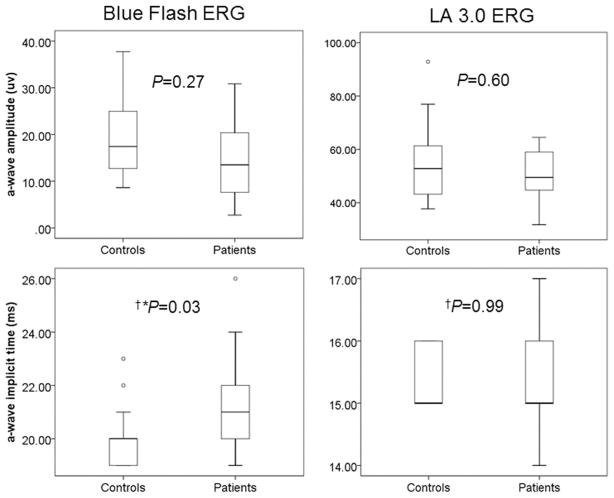
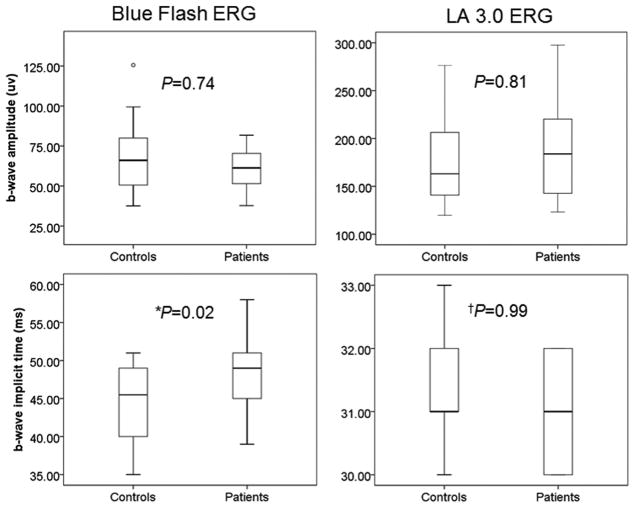
Further, compared with control subjects, blue flash ERG a-waves (P = 0.03; Fig. 3) and b-waves (P = 0.02; Fig. 4) were delayed in patients. No significant changes were found between groups in the a- and b-waves of the LA 3.0 ERG.
Figure 3.
Between group comparisons of a-wave amplitudes and implicit times in the blue flash ERG and LA 3.0 ERG (*P < 0.05, †Mann-Whitney test). Boxes represent the 25th and 75th percentiles, the line represents the median. Whiskers represent 1.5 IQR, circles are data beyond the 1.5 IQR.
Figure 4.
Between group comparisons of b-wave amplitudes and implicit times in the blue flash ERG and LA 3.0 ERG (*P < 0.05, †Mann-Whitney test). Boxes represent the 25th and 75th percentiles, the line represents the median. Whiskers represent 1.5 IQR, circles are data beyond the 1.5 IQR.
Average waveforms of the blue flash ERG are shown in Figure 5. In individual records, 16 of the 21 patients with a recordable blue flash ERG PhNR had no detectable trough. Four patients had clearly detectable troughs between 120 and 140 ms and one patient had a trough at 100 ms. Average waveforms of the LA 3.0 ERG are shown in Figure 6.
Figure 5.
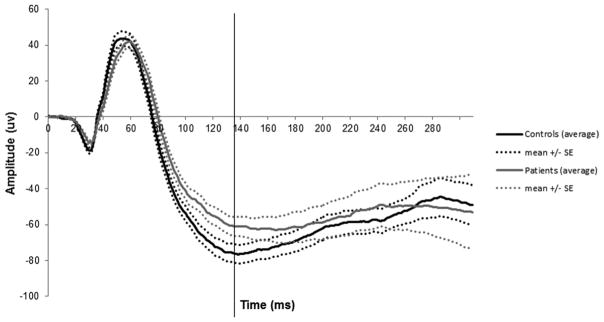
Patient and control blue flash ERG responses.
Figure 6.
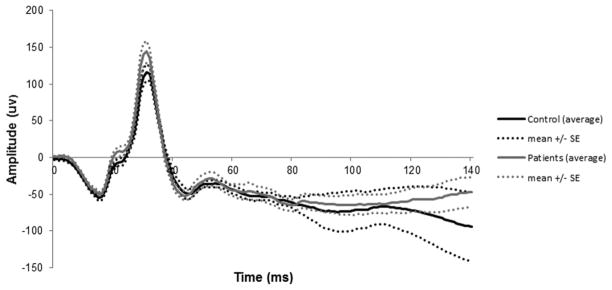
Patient and control LA 3.0 ERG responses.
Multiple Regression Modeling Based on Blue Flash ERG PhNR Amplitudes
Multiple regression analysis using PhNR amplitudes of the blue flash ERG yielded significant findings. However, regression analyses using a- and b-wave blue flash ERG data did not yield significant findings with HbA1c or time since diagnosis.
One iteration of the backward selection procedure was performed using blue flash ERG PhNR data. The first model showed that time since diagnosis did not significantly explain the variation in the patient PhNR amplitudes (P = 0.94). Therefore, time since diagnosis was excluded as a covariate. This led to the final model which included HbA1c as the independent variable (P < 0.157) and blue flash ERG PhNR data as the dependent variable (Table 2).
Table 2.
Description and Results of Final Model Including HbA1c as a Covariate
| β | Standard Error | 95% Confidence Interval | P | |
|---|---|---|---|---|
| Intercept, β0 | 149.54 | 30.03 | 0.005 to 299.07 | 0.00008 |
| HbA1c, % | −11.79 | 3.53 | −23.57 to 0.00 | 0.003* |
P < 0.05.
A likelihood ratio test comparing the final model to the null model (all βs = 0) was significant (P = 0.001). This means that the final model explains better the variability in the dependent variable than the null model. The final model demonstrated that a one-unit increase in HbA1c was associated with a decrease in the amplitude of the blue flash ERG PhNR response by 12 μV or by 15%. A scatterplot of this univariate correlation (Fig. 7) was significant with a Pearson’s r of 0.61 (P = 0.003).
Figure 7.
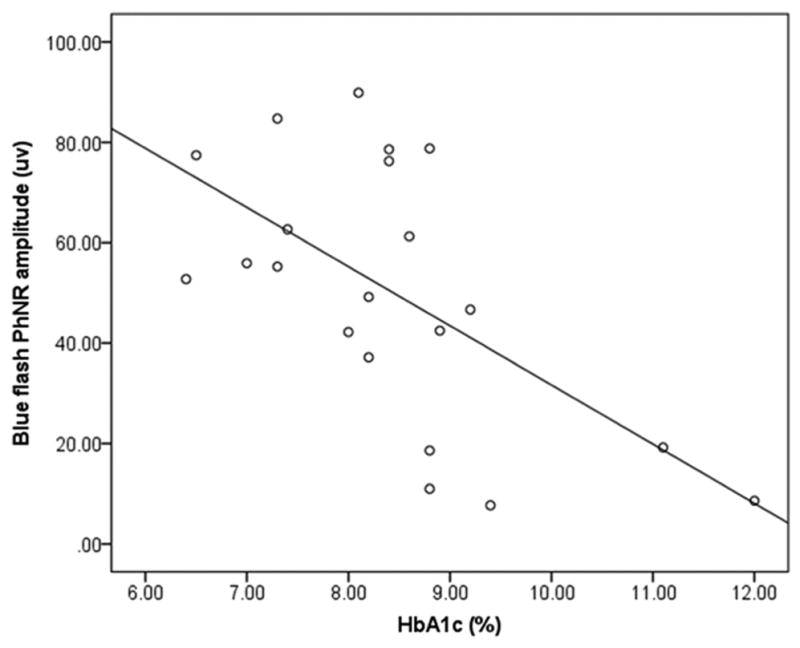
Univariate correlation between HbA1c and blue-flash ERG PhNR amplitudes.
Discussion
The main finding of our study is that poorer long-term glycemic control, as measured by glycated HbA1c, is associated with a reduced amplitude of the inner retinal blue flash ERG response in adolescents with T1D before clinical signs of DR. The importance of this finding is that long-term glycemic control is a strong risk factor for DR. To the best of our knowledge, this is the first study to demonstrate an association between HbA1c and a blue flash electrophysiological measure. This is an important step toward identifying sensitive and specific biomarkers of subclinical DR.
The results of the present study differ from those of Mort-lock et al.24 who found no changes in the S-cone ERG PhNR before clinical signs of DR. The difference in scoring methods for the PhNR may account for the discrepancy in results. In the Mortlock study, the amplitude of the PhNR was measured from the trough of the PhNR to the peak of the b-wave. The variation in the PhNR amplitudes at different time points in addition to the variation in b-wave amplitudes across subjects may have contributed to the lack of significant difference in the measured PhNR amplitude between patient and control groups. The present study benefited from the measurement of the blue flash ERG PhNR amplitude from baseline (corrected to 0 mV) at a fixed timing (135 ms). This scoring method reduced the variation of the measured PhNR amplitude.
Although the waveforms produced by Mortlock et al.24 and the present study are similar, the protocols are difficult to compare, as they use fundamentally different techniques. The Mortlock study uses a silent substitution technique in which two light stimuli are subjectively matched in intensity for L- and M-cones by flicker photometry. These stimuli are presented in counterphase on a rod-suppressing background. The silent substitution technique corrects for differences in media absorption by virtue of the flicker photometry performed by each subject. This is an important factor to take into consideration with regard to patients with diabetes. Increased short-wavelength absorption, such as that caused by lens yellowing, is a prominent feature in adults (median, 30 years) with diabetes51 and is associated with attenuated S-cone ERG responses.52 While the blue flash technique is not able to correct for individual variations in media absorption, the young age of our cohort (mean age, 16 years) reduced the prospect of lens yellowing as a confounder.
The white flash used in this study (LA 3.0 ERG) receives contribution from the three cone types. The major contribution would reflect L/M-cone pathways. While the PhNR from adolescents tested before evidence of vascular lesion was not different significantly from control subjects (Fig. 2), previous studies show that the PhNR of the white flash ERG is reduced in patients with nonproliferative (NP) DR.44,53 This L/M-cone pathway dominated response from the inner retina may show marked dysfunction when vascular lesions are apparent, but not before this time.
The blue flash used in the present study is a higher intensity than that used conventionally for S-cone recordings. The advantage of using a higher intensity is the ease of measurement of the higher amplitude PhNR response in comparison with the low amplitude PhNR response (1–10 μV) in the S-cone ERG traditionally recorded.16,17,24–26 We showed previously no significant rod photoreceptor response to a 0.01 cd · s/m2 flash in scotopic conditions for at least 15 minutes after light adaptation conditions used for the blue flash protocol.54 However, we cannot say that rod intrusion was completely eliminated. Arden et al.18 calculated rod intrusion in a range of S-cone protocols covering a range of stimulus and background intensities. In addition to possible rod intrusion from the standard rod response (slow rod pathway) there may be additional rod intrusion from the fast rod pathway through the suggested rod-cone gap junctions.55 Abnormalities in the rod system do occur in patients with diabetes before vascular changes.56–58 The lack of significant correlations between rod system sensitivity and the level of retinopathy,59 however, minimizes the probability that rod system function would be a useful predictor of progression of early stage DR.
To the best of our knowledge, this is the first study to demonstrate a delay in both the a-wave and the b-wave of the blue flash ERG in patients with diabetes before clinical evidence of DR. Delays were not found in the LA 3.0 ERG a- or b-waves. Multiple regression modeling with blue flash a- and b-wave ERG measures could not demonstrate any significant relationship with glycemic control or time since diagnosis. The results suggest that there is outer and middle retina dysfunction in short-wavelength sensitive cone pathways in patients with diabetes that are attributed to factors other than HbA1c and duration of disease.
Inner retinal dysfunction in S-cone pathways may be an important component in the pathogenesis of subclinical DR. Our finding of reduced blue-flash ERG PhNR amplitudes with increasing HbA1c may be related to a loss of integrity of small bistratisfied ganglion cells found only in S-cone pathways.60,61 Small bistratisfied ganglion cells selectively enlarge, an indication of cell death, after a few months of uncontrolled hyperglycemia.60 Glycemic control may play an important role in the loss of integrity of these cells. Hyperglycemia increases levels of retinal glutamate which are toxic to inner retinal cells.62,63 Hyperglycemia also contributes to retinal hypoxia,64 presumably by decreasing retinal blood flow,65–67 which reduces markedly the basal spiking rate of retinal ganglion cells.68 Although there are contributions to the amplitude of the blue-flash ERG PhNR from the upstream outer and middle retina, in the present study, there was no significant blue flash a-wave (Fig. 3) or b-wave ERG amplitude reduction (Fig. 4). Mild delays were found for the outer and middle short-wavelength responses; however a 1 or 2 ms timing delay would not affect the amplitude of the PhNR due to the slow and extended nature of the trough in the group with diabetes. Changes in the PhNR provide an easily measurable clinical marker for retinal dysfunction caused by diabetes.
Glycated hemoglobin levels are a widely used clinical measure to assess average glycemic control over the preceding 3 to 4 months69,70 and are strongly associated with complications of diabetes.36,37 It is interesting to note, however, that this index of glycemic control is weighted heavily on more recent history71,72 and may not provide complete information about a patient’s long-term glycemic control. It has been suggested that variability in ambient blood glucose levels better captures a patient’s glycemic control over time73,74 and is a risk factor for complications of diabetes.75,76 However, given conflicting results77 and the lack of consensus on a measure that best reflects glycemic variability,78–81 glycated hemoglobin levels closest to the date of testing were chosen as the best measure of glycemic control in this study. An examination of HbA1c values from 11 patients who had more than one value available in the 12 months previous to the date of testing demonstrated that HbA1c values were relatively stable over this time (mean variation = 0.40, SD = 1.33). We therefore believe that the HbA1c value is a good approximate of glycemic control in our adolescent cohort over the long-term.
The maintenance of ambient blood glucose levels is an important factor when testing patients with diabetes, as hyperglycemia affects ERG responses.42,43 In the present study, blood glucose levels were monitored and maintained within 4 to 10 mM throughout the testing session. This broad range is close to physiological norms and was chosen in lieu of the small window of time available for testing. Glucose control can be difficult in adolescents with T1D due to hormonal changes and noncompliance to glucose monitoring techniques. The broad range allowed for the safe adjustment of blood glucose levels during testing. While it is likely that ambient blood glucose levels may have changed slightly during testing, blood glucose levels were adjusted in consultation with a nurse to ensure that any changes that occurred during data acquisition were within the 4 to 10 mM/L range.
There are a few limitations in this study that must be considered. Although a strong association was found between HbA1c and the blue flash ERG PhNR, the relatively small sample size of subjects reduces the statistical power of the linear model. Also, HbA1c values were not obtained at the time of testing which may introduce systematic bias.
The results of this study offer insight about the integrity of S-cone pathways in adolescents with diabetes. S-cone pathways are particularly disrupted in adolescents with diabetes before vascular changes are apparent. Poorer long-term glycemic control is associated with worsening inner retinal dysfunction in S-cone pathways before DR is clinically visible. The blue-flash ERG PhNR may be a useful marker of early stage inner retinal damage. By virtue of its association with HbA1c, it may also be a potential biomarker of subclinical DR.
Acknowledgments
Supported by the Canadian Institutes of Health Research (CIHR 219857), Juvenile Diabetes Research Foundation (JDRF 1-2005-1116), the Vision Science Research Program Graduate Studentship (MM), The Banting and Best Diabetes Centre University Health Network Graduate Awards (MM), and a University of Toronto Fellowship (MM).
The authors thank Cynthia VandenHoven for fundus photography; Wai-Ching Lam and Shelly Boyd for grading fundus photographs; Howard Bunting, Arun Reginald, and Amila De Alwis for performing dilated fundus examinations; Marcia Wilson for titrating and monitoring patient blood glucose levels; Melissa Cotesta for conducting refraction; and Ajoy Vincent for comments on the manuscript.
Footnotes
Disclosure: M. McFarlane, None; T. Wright, None; D. Stephens, None; J. Nilsson, None; C. A. Westall, None
References
- 1.Klein R, Knudtson M, Lee K, Gangnon R, Klein B The Wisconsin Epidemiologic Study of Diabetic Retinopathy XXII. The twenty-five-year progression of retinopathy in persons with type 1 diabetes. Ophthalmology. 2008;115:1859–1868. doi: 10.1016/j.ophtha.2008.08.023. [DOI] [PMC free article] [PubMed] [Google Scholar]
- 2.Klein R, Klein B, Moss S, Davis M, DeMets D. The Wisconsin epidemiologic study of diabetic retinopathy. II. Prevalence and risk of diabetic retinopathy when age at diagnosis is less than 30 years. Arch Ophthalmol. 1984;102:520–526. doi: 10.1001/archopht.1984.01040030398010. [DOI] [PubMed] [Google Scholar]
- 3.LeCaire T, Palta M, Zhang H, Allen C, Klein R, D’Alessio D. Lower-than-expected prevalence and severity of retinopathy in an incident cohort followed during the first 4–14 years of type 1 diabetes: the Wisconsin Diabetes Registry Study. Am J Epidemiol. 2006;164:143–150. doi: 10.1093/aje/kwj166. [DOI] [PubMed] [Google Scholar]
- 4.International Diabetes Federation (IDF) The Diabetes Atlas. Brussels, Belgium: IDF; 2011. Diabetes in the Young: a Global Perspective. [Google Scholar]
- 5.ETDRS. Grading diabetic retinopathy from stereoscopic color fundus photographs–an extension of the modified Airlie House classification. ETDRS report number 10. Ophthalmology. 1991;98:786–806. [PubMed] [Google Scholar]
- 6.Hood D, Benimoff N, Greenstein V. The response range of the blue-cone pathways: a source of vulnerability to disease. Invest Ophthalmol Vis Sci. 1984;25:864–867. [PubMed] [Google Scholar]
- 7.Greenstein VC, Hood DC, Ritch R, Steinberger D, Carr RE. S (blue) cone pathway vulnerability in retinitis pigmentosa, diabetes and glaucoma. Invest Ophthalmol Vis Sci. 1989;30:1732–1737. [PubMed] [Google Scholar]
- 8.Greenstein V, Sarter B, Hood D, Noble K, Carr R. Hue discrimination and S cone pathway sensitivity in early diabetic retinopathy. Invest Ophthalmol Vis Sci. 1990;31:1008–1014. [PubMed] [Google Scholar]
- 9.Swanson W, Birch D, Anderson J. S-cone function in patients with retinitis pigmentosa. Invest Ophthalmol Vis Sci. 1993;34:3045–3055. [PubMed] [Google Scholar]
- 10.Daley M, Watzke R, Riddle M. Early loss of blue-sensitive color vision in patients with type I diabetes. Diabetes Care. 1987;10:777–781. doi: 10.2337/diacare.10.6.777. [DOI] [PubMed] [Google Scholar]
- 11.Muntoni S, Serra A, Mascia C, Songini M. Dyschromatopsia in diabetes mellitus and its relation to metabolic control. Diabetes Care. 1982;5:375–378. doi: 10.2337/diacare.5.4.375. [DOI] [PubMed] [Google Scholar]
- 12.Kurtenbach A, Wagner U, Neu A, Schiefer U, Ranke MB, Zrenner E. Brightness matching and colour discrimination in young diabetics without retinopathy. Vision Res. 1994;34:115–122. doi: 10.1016/0042-6989(94)90262-3. [DOI] [PubMed] [Google Scholar]
- 13.Kurtenbach A, Schiefer U, Neu A, Zrenner E. Preretinopic changes in the colour vision of juvenile diabetics. Br J Ophthalmol. 1999;83:43–46. doi: 10.1136/bjo.83.1.43. [DOI] [PMC free article] [PubMed] [Google Scholar]
- 14.Terasaki H, Hirose H, Miyake Y. S-cone pathway sensitivity in diabetes measured with threshold versus intensity curves on flashed backgrounds. Invest Ophthalmol Vis Sci. 1996;37:680–684. [PubMed] [Google Scholar]
- 15.Bresnick G, Condit R, Palta M, Korth K, Groo A, Syrjala S. Association of hue discrimination loss and diabetic retinopathy. Arch Ophthalmol. 1985;103:1317–1324. doi: 10.1001/archopht.1985.01050090069034. [DOI] [PubMed] [Google Scholar]
- 16.Marmor M, Cabael L, Shukla S, Hwang J, Marcus M. Clinical S-cone ERG recording with a commercial hand-held full-field stimulator. Doc Ophthalmol. 2004;109:101–107. doi: 10.1007/s10633-004-3299-7. [DOI] [PubMed] [Google Scholar]
- 17.Chiti Z, North R, Mortlock K, Drasdo N. The S-cone electroretinogram: a comparison of techniques, normative data and age-related variation. Ophthalmic Physiol Opt. 2003;23:370–376. doi: 10.1046/j.1475-1313.2003.00129.x. [DOI] [PubMed] [Google Scholar]
- 18.Arden G, Wolf J, Berninger T, Hogg C, Tzekov R, Holder G. S-cone ERGs elicited by a simple technique in normals and in tritanopes. Vision Res. 1999;39:641–650. doi: 10.1016/s0042-6989(98)00182-5. [DOI] [PubMed] [Google Scholar]
- 19.Simonsen S, Rosenberg T. Reappraisal of a short-wavelength-sensitive (S-cone) recording technique in routine clinical electroretinography. Doc Ophthalmol. 1995;91:323–332. doi: 10.1007/BF01214650. [DOI] [PubMed] [Google Scholar]
- 20.Gouras P, MacKay C. Electroretinographic responses of the short-wavelength-sensitive cones. Invest Ophthalmol Vis Sci. 1990;31:1203–1209. [PubMed] [Google Scholar]
- 21.Sawusch M, Pokorny J, Smith V. Clinical electroretinography for short wavelength sensitive cones. Invest Ophthalmol Vis Sci. 1987;28:966–974. [PubMed] [Google Scholar]
- 22.Yamamoto S, Kamiyama M, Nitta K, Yamada T, Hayasaka S. Selective reduction of the S cone electroretinogram in diabetes. Br J Ophthalmol. 1996;80:973–975. doi: 10.1136/bjo.80.11.973. [DOI] [PMC free article] [PubMed] [Google Scholar]
- 23.Yamamoto S, Takeuchi S, Kamiyama M. The short wavelength-sensitive cone electroretinogram in diabetes: relationship to systemic factors. Doc Ophthalmol. 1997;94:193–200. doi: 10.1007/BF02582978. [DOI] [PubMed] [Google Scholar]
- 24.Mortlock K, Chiti Z, Drasdo N, Owens D, North R. Silent substitution S-cone electroretinogram in subjects with diabetes mellitus. Ophthalmic Physiol Optic. 2005;25:392–399. doi: 10.1111/j.1475-1313.2005.00299.x. [DOI] [PubMed] [Google Scholar]
- 25.Drasdo N, Aldebasi Y, Chiti Z, Mortlock K, Morgan J, North R. The S-cone PHNR and pattern ERG in primary open angle glaucoma. Invest Ophthalmol Vis Sci. 2001;42:1266–1272. [PubMed] [Google Scholar]
- 26.Wakili N, Horn F, Jünemann A, et al. The photopic negative response of the blue-on-yellow flash-electroretinogram in glaucomas and normal subjects. Doc Ophthalmol. 2008;117:147–154. doi: 10.1007/s10633-008-9116-y. [DOI] [PubMed] [Google Scholar]
- 27.Viswanathan S, Frishman L, Robson J, Harwerth R, Smith E., 3rd The photopic negative response of the macaque electroretinogram: reduction by experimental glaucoma. Invest Ophthalmol Vis Sci. 1999;40:1124–1136. [PubMed] [Google Scholar]
- 28.Viswanathan S, Frishman L. Evidence that negative potentials in the photopic electroretinograms of cats and primates depend upon spiking activity of retinal ganglion cell axons (abstract) Soc Neurosci. 1997;123:1024. [Google Scholar]
- 29.Lopes de Faria J, Russ H, Costa V. Retinal nerve fibre layer loss in patients with type 1 diabetes mellitus without retinopathy. Br J Ophthalmol. 2002;86:725–728. doi: 10.1136/bjo.86.7.725. [DOI] [PMC free article] [PubMed] [Google Scholar]
- 30.Zhang L, Inoue M, Dong K, Yamamoto M. Retrograde axonal transport impairment of large-and medium-sized retinal ganglion cells in diabetic rat. Curr Eye Res. 2000;20:131–136. [PubMed] [Google Scholar]
- 31.Kern TS, Barber AJ. Retinal ganglion cells in diabetes. J Physiol. 2008;586:4401–4408. doi: 10.1113/jphysiol.2008.156695. [DOI] [PMC free article] [PubMed] [Google Scholar]
- 32.Qin Y, Xu G, Wang W. Dendritic abnormalities in retinal ganglion cells of three-month diabetic rats. Curr Eye Res. 2006;31:967–974. doi: 10.1080/02713680600987674. [DOI] [PubMed] [Google Scholar]
- 33.Van Dijk HW, Kok PHB, Garvin M, et al. Selective loss of inner retinal layer thickness in type 1 diabetic patients with minimal diabetic retinopathy. Invest Ophthalmol Vis Sci. 2009;50:3404–3409. doi: 10.1167/iovs.08-3143. [DOI] [PMC free article] [PubMed] [Google Scholar]
- 34.Oshitari T, Hanawa K, Adachi-Usami E. Changes of macular and RNFL thicknesses measured by Stratus OCT in patients with early stage diabetes. Eye (Lond) 2009;23:884–889. doi: 10.1038/eye.2008.119. [DOI] [PubMed] [Google Scholar]
- 35.Ozdek S, Lonneville YH, Onol M, Yetkin I, Hasanreisoglu BB. Assessment of nerve fiber layer in diabetic patients with scanning laser polarimetry. Eye (Lond) 2002;16:761–765. doi: 10.1038/sj.eye.6700207. [DOI] [PubMed] [Google Scholar]
- 36.The effects of intensive diabetes treatment on the development and progression of longterm complications in insulin-dependent diabetes mellitus. The Diabetes Control and Complications Trial. N Engl J Med. 1993;329:977–986. doi: 10.1056/NEJM199309303291401. [DOI] [PubMed] [Google Scholar]
- 37.Effect of intensive diabetes treatment on the development and progression of long-term complications in adolescents with insulin-dependent diabetes mellitus: Diabetes Control and Complications Trial. Diabetes Control and Complications Trial Research Group. J Pediatr. 1994;125:177–188. doi: 10.1016/s0022-3476(94)70190-3. [DOI] [PubMed] [Google Scholar]
- 38.Daneman D, Wolfson DH, Becker DJ, Drash AL. Factors affecting glycosylated hemoglobin values in children with insulin-dependent diabetes. J Pediatr. 1981;99:847–853. doi: 10.1016/s0022-3476(81)80005-4. [DOI] [PubMed] [Google Scholar]
- 39.Mortensen H, Villumsen J, Vølund A, Petersen K, Nerup J. Relationship between insulin injection regimen and metabolic control in young Danish type 1 diabetic patients. Diabet Med. 1992;9:834–839. doi: 10.1111/j.1464-5491.1992.tb01902.x. [DOI] [PubMed] [Google Scholar]
- 40.Klein B, Moss S, Klein R. Is menarche associated with diabetic retinopathy? Diabetes Care. 1990;13:1034–1038. doi: 10.2337/diacare.13.10.1034. [DOI] [PubMed] [Google Scholar]
- 41.Murphy R, Nanda M, Plotnick L, Enger C, Vitale S, Patz A. The relationship of puberty to diabetic retinopathy. Arch Ophthalmol. 1990;108:215–218. doi: 10.1001/archopht.1990.01070040067032. [DOI] [PubMed] [Google Scholar]
- 42.Klemp K, Larsen M, Sander B, Vaag A, Brockhoff P, Lund-Andersen H. Effect of short-term hyperglycemia on multifocal electroretinogram in diabetic patients without retinopathy. Invest Ophthalmol Vis Sci. 2004;45:3812–3819. doi: 10.1167/iovs.03-1260. [DOI] [PubMed] [Google Scholar]
- 43.Klemp K, Sander B, Brockhoff P, Vaag A, Lund-Andersen H, Larsen M. The multifocal ERG in diabetic patients without retinopathy during euglycemic clamping. Invest Ophthalmol Vis Sci. 2005;46:2620–2626. doi: 10.1167/iovs.04-1254. [DOI] [PubMed] [Google Scholar]
- 44.Kizawa J, Machida S, Kobayashi T, Gotoh Y, Kurosaka D. Changes of oscillatory potentials and photopic negative response in patients with early diabetic retinopathy. Jpn J Ophthalmol. 2006;50:367–373. doi: 10.1007/s10384-006-0326-0. [DOI] [PubMed] [Google Scholar]
- 45.Machida S, Gotoh Y, Tanaka M, Tazawa Y. Predominant loss of the photopic negative response in central retinal artery occlusion. Am J Ophthalmol. 2004;137:938–940. doi: 10.1016/j.ajo.2003.10.023. [DOI] [PubMed] [Google Scholar]
- 46.Gotoh Y, Machida S, Tazawa Y. Selective loss of the photopic negative response in patients with optic nerve atrophy. Arch Ophthalmol. 2004;122:341–346. doi: 10.1001/archopht.122.3.341. [DOI] [PubMed] [Google Scholar]
- 47.Wright S. Adjusted p-values for simultaneous inference. Biometrics. 1992;48:1005–1013. [Google Scholar]
- 48.Dunteman G, Ho M. An introduction to generalized linear models. San Francisco: Sage Publications; 2006. pp. 1–15. [Google Scholar]
- 49.Hosmer D, Lemeshow S. Applied Logistic Regression. New York: John Wiley & Sons; 1989. [Google Scholar]
- 50.CDA. Clinical practice guidelines for the prevention and management of diabetes in Canada. Canadian Journal of Diabetes. 2008;32:S1–S201. doi: 10.1016/j.jcjd.2013.01.009. [DOI] [PubMed] [Google Scholar]
- 51.Lutze M, Bresnick G. Lenses of diabetic patients “yellow” at an accelerated rate similar to older normals. Invest Ophthalmol Vis Sci. 1991;32:194–199. [PubMed] [Google Scholar]
- 52.Gouras P, MacKay C, Yamamoto S. The human S-cone electroretinogram and its variation among subjects with and without L and M-cone function. Invest Ophthalmol Vis Sci. 1993;34:2437–2442. [PubMed] [Google Scholar]
- 53.Park S, Sun H, Lee H, Park T, Ohn Y. The role of electroretinography in assessing the progression of diabetic retinopathy. Journal of the Korean Ophthalmological Society. 2010;51:693–699. [Google Scholar]
- 54.Nilsson J, Wright T, Westall C. A promising S-cone isolating protocol (abstract) Doc Ophthalmol. 2008;117:40. [Google Scholar]
- 55.Sharpe LT, Stockman A. Rod pathways: the importance of seeing nothing. Trends Neurosci. 1999;22:497–504. doi: 10.1016/s0166-2236(99)01458-7. [DOI] [PubMed] [Google Scholar]
- 56.Henson D, North R. Dark adaptation in diabetes mellitus. Br J Ophthalmol. 1979;63:539–541. doi: 10.1136/bjo.63.8.539. [DOI] [PMC free article] [PubMed] [Google Scholar]
- 57.Phipps JA, Yee P, Fletcher EL, Vingrys AJ. Rod photoreceptor dysfunction in diabetes: activation, deactivation, and dark adaptation. Invest Ophthalmol Vis Sci. 2006;47:3187–3194. doi: 10.1167/iovs.05-1493. [DOI] [PubMed] [Google Scholar]
- 58.Ostroy SE, Frede SM, Wagner EF, Gaitatzes CG, Janle EM. Decreased rhodopsin regeneration in diabetic mouse eyes. Invest Ophthalmol Vis Sci. 1994;35:3905–3909. [PubMed] [Google Scholar]
- 59.Greenstein VC, Thomas SR, Blaustein H, Koenig K, Carr RE. Effects of early diabetic retinopathy on rod system sensitivity. Optom Vis Sci. 1993;70:18–23. doi: 10.1097/00006324-199301000-00005. [DOI] [PubMed] [Google Scholar]
- 60.Gastinger M, Kunselman A, Conboy E, Bronson S, Barber A. Dendrite remodeling and other abnormalities in the retinal ganglion cells of Ins2 Akita diabetic mice. Invest Ophthalmol Vis Sci. 2008;49:2635–2642. doi: 10.1167/iovs.07-0683. [DOI] [PubMed] [Google Scholar]
- 61.Calkins D. Color vision: from genes to perception. In: Gengenfurtner K, Sharpe L, editors. Color Vision: from Genes to Perception. New York: Cambridge University Press; 1999. pp. 163–180. [Google Scholar]
- 62.Li Q, Puro D. Diabetes-induced dysfunction of the glutamate transporter in retinal Muller cells. Invest Ophthalmol Vis Sci. 2002;43:3109–3116. [PubMed] [Google Scholar]
- 63.Lucas D, Newhouse J. The toxic effect of sodium L-glutamate on the inner layers of the retina. AMA Arch Ophthalmol. 1957;58:193–201. doi: 10.1001/archopht.1957.00940010205006. [DOI] [PubMed] [Google Scholar]
- 64.Linsenmeier RA, Braun RD, McRipley MA, et al. Retinal hypoxia in long-term diabetic cats. Invest Ophthalmol Vis Sci. 1998;39:1647–1657. [PubMed] [Google Scholar]
- 65.Kawagishi T, Nishizawa Y, Emoto M, et al. Impaired retinal artery blood flow in IDDM patients before clinical manifestations of diabetic retinopathy. Diabetes Care. 1995;18:1544. doi: 10.2337/diacare.18.12.1544. [DOI] [PubMed] [Google Scholar]
- 66.Feke G, Buzney S, Ogasawara H, et al. Retinal circulatory abnormalities in type 1 diabetes. Invest Ophthalmol Vis Sci. 1994;35:2968–2975. [PubMed] [Google Scholar]
- 67.Bursell S, Clermont A, Kinsley B, Simonson D, Aiello L, Wolpert H. Retinal blood flow changes in patients with insulin-dependent diabetes mellitus and no diabetic retinopathy. Invest Ophthalmol Vis Sci. 1996;37:886–897. [PubMed] [Google Scholar]
- 68.Alder V, Constable I. Effect of hypoxia on the maintained firing rate of retinal ganglion cells. Invest Ophthalmol Vis Sci. 1981;21:450–456. [PubMed] [Google Scholar]
- 69.Nathan D, Kuenen J, Borg R, Zheng H, Schoenfeld D, Heine R. Translating the A1C assay into estimated average glucose values. Diabetes Care. 2008;31:1473–1478. doi: 10.2337/dc08-0545. [DOI] [PMC free article] [PubMed] [Google Scholar]
- 70.Wilson DM, Kollman C, Xing D, et al. Relationship of A1c to glucose concentrations in children with type 1 diabetes: assessments by high frequency glucose determinations by sensors. Diabetes Care. 2008;31:381–385. doi: 10.2337/dc07-1835. [DOI] [PMC free article] [PubMed] [Google Scholar]
- 71.Tahara Y, Shima K. The response of GHb to stepwise plasma glucose change over time in diabetic patients. Diabetes Care. 1993;16:1313–1314. doi: 10.2337/diacare.16.9.1313. [DOI] [PubMed] [Google Scholar]
- 72.Goldstein D, Little R, Wiedmeyer H, England J, Rohlfing C. Glycohemoglobin testing in diabetes mellitus: assay methods and clinical interpretation. Drugs in Development. 1:253–267. [Google Scholar]
- 73.Hirsch IB, Brownlee M. Should minimal blood glucose variability become the gold standard of glycemic control? J Diabetes Complications. 2005;19:178–181. doi: 10.1016/j.jdiacomp.2004.10.001. [DOI] [PubMed] [Google Scholar]
- 74.Hirsch IB, Brownlee M. Beyond hemoglobin A1c - need for additional markers of risk for diabetic microvascular complications. JAMA. 2010;303:2291–2292. doi: 10.1001/jama.2010.785. [DOI] [PubMed] [Google Scholar]
- 75.Ceriello A. The emerging role of post-prandial hyperglycaemic spikes in the pathogenesis of diabetic complications. Diabet Med. 1998;15:188–193. doi: 10.1002/(SICI)1096-9136(199803)15:3<188::AID-DIA545>3.0.CO;2-V. [DOI] [PubMed] [Google Scholar]
- 76.Ceriello A. The possible role of postprandial hyperglycaemia in the pathogenesis of diabetic complications. Diabetologia. 2003;46(suppl 1):M9–M16. doi: 10.1007/s00125-002-0931-5. [DOI] [PubMed] [Google Scholar]
- 77.Kilpatrick E, Rigby A, Atkin S. For debate. Glucose variability and diabetes complication risk: we need to know the answer. Diabet Med. 2010;27:868–871. doi: 10.1111/j.1464-5491.2010.02929.x. [DOI] [PubMed] [Google Scholar]
- 78.Service F, Molnar G, Rosevear J, Ackerman E, Gatewood L, Taylor W. Mean amplitude of glycemic excursions, a measure of diabetic instability. Diabetes. 1970;19:644–655. doi: 10.2337/diab.19.9.644. [DOI] [PubMed] [Google Scholar]
- 79.McCall A, Cox D, Crean J, Gloster M, Kovatchev B. A novel analytical method for assessing glucose variability: using CGMS in type 1 diabetes mellitus. Diabetes Technol Ther. 2006;8:644–653. doi: 10.1089/dia.2006.8.644. [DOI] [PubMed] [Google Scholar]
- 80.Kovatchev B, Cox D, Gonder-Frederick L, Young-Hyman D, Schlundt D, Clarke W. Assessment of risk for severe hypoglycemia among adults with IDDM: validation of the low blood glucose index. Diabetes Care. 1998;21:1870–1875. doi: 10.2337/diacare.21.11.1870. [DOI] [PubMed] [Google Scholar]
- 81.Molnar G, Taylor W, Ho M. Day-to-day variation of continuously monitored glycaemia: a further measure of diabetic instability. Diabetologia. 1972;8:342–348. doi: 10.1007/BF01218495. [DOI] [PubMed] [Google Scholar]


