Abstract
Spatial–temporal partial least squares (ST-PLS) is a multivariate statistical analysis that has improved the analysis of modern imaging techniques. Multifocal electroretinograms (mfERGs) contain a large amount of data, and averaging and grouping have been used to reduce the amount of data to levels that can be handled using traditional statistical methods. In contrast, using all acquired data points, ST-PLS enables statistically rigorous testing of changes in waveform shape and in the distributed signal related to retinal function. We hypothesise that ST-PLS will improve analysis of the mfERG. Two mfERG protocols, a 103 hexagon clinical protocol and a slow-flash mfERG (sf-mfERG) protocol, were recorded from an adolescent population with type 1 diabetes and an age similar control population. The standard mfERGs were analysed using a template-fitting algorithm and the sf-mfERG using a signal-to-noise measure. The results of these traditional analysis techniques are compared with those of the ST-PLS analysis. Traditional analysis of the mfERG recordings revealed changes between groups for implicit time but not amplitude; however, the spatial location of these changes could not be identified. In contrast, ST-PLS detected significant changes between groups and displayed the spatial location of these changes on the retinal map and the temporal location within the mfERG waveforms. ST-PLS confirmed that changes to diabetic retinal function occur before the onset of clinical pathology. In addition, it revealed two distinct patterns of change depending on whether the multifocal paradigm was optimised to target outer retinal function (photoreceptors) or middle/inner retinal function (collector cells).
Keywords: mfERG, Partial least squares, Diabetes, Signal averaging
Introduction
Clinical electroretinography (ERG) records the electrical potentials generated by the massed cells of the retina in response to stimulation by light. The multifocal electroretinogram (mfERG) uses a patterned stimulus to simultaneously test multiple retinal areas in the central visual field. Each retinal area generates a complex waveform that was initially described by three cardinal points (N1, P1 and N2) [1]. Retinal dysfunction is represented by changes in either the amplitude or timing of these features. Typically, 61 or 103 retinal areas are simultaneously tested with each area generating an independent waveform [2]. Typically sampled at 1,000 Hz or above, a 100-ms recording will generate 100 data points, multiplied by 103 retinal areas generating 10,300 data points.
A difficulty common to all multifocal electrophysiology testing is how to analyse the tremendous amount of data that are collected. Often, analysis involves averaging multiple areas together, for example to produce retinal rings or quadrants. Such averaging reduces the spatial resolution available in the recording. A single recorded electrophysiological potential is often dominated by a few large components. These large components may be formed by the summation of multiple smaller electrical potentials in turn generated by the action of many individual cells [3]. Traditional analysis techniques summarise these data by selecting the cardinal points of major features of interest [2, 4].
Spatial–temporal partial least squares (ST-PLS) is a multivariate statistical analysis, introduced to the neuroimaging community by McIntosh et al. [5]. PLS analysis has been used to characterise distributed signals measured by neuroimaging methods like positron emission tomography (PET), functional magnetic resonance imaging (fMRI), event-related potentials (ERP) and magnetoencephalography (MEG). This statistical method allows for the simultaneous analysis of both temporal changes, that is, changes to the shape of the recorded waveforms and the spatial distribution of these changes across the recorded area (in this case, the retina). The underlying mechanism of the PLS analysis is the calculation of an optimal least squares correlation between a matrix X containing the recorded data and a second matrix Y that contains information about the experimental design. In this way, analysis of variations in the recorded data is constrained to those that are affected by the experimental manipulation [6]. An advantage of the PLS technique is its ability to handle large quantities of data, as such it does not require the data to be summarised as cardinal points or spatial averages.
The purpose of this paper is not to present the formal mathematical description of PLS analysis, which has been covered in depth previously [5–7]. Instead, it is to present a practical application of the technique, namely for investigating mfERG data recorded from patients with suspected retinal dysfunction. We have specifically looked at a population with type 1 diabetes before the onset of any clinically recognisable diabetic retinopathy.
Type 1 diabetes mellitus (DM) is a chronic disease with decreased pancreatic insulin production caused by an auto immune reaction destroying the β-cells of the pancreas. The disease can progress sub-clinically for many years but is usually diagnosed before age 30 years [8]. The reduced ability of the body to control levels of blood glucose (glycemic control) can, over time, lead to many complications affecting major body organs including the cardiac and vascular systems, nervous system, visual system and kidneys [9].
A common ophthalmologic complication of diabetes is diabetic retinopathy (DR). Studies have reported incidence rates of DR up to 97.5 % in people with DM for >15 years [10]. DR is a progressive deterioration of the retina, initially there may be no visual symptoms; however; if left uncontrolled, it can lead to blindness [11]. Clinical diagnosis of early DR is made by directly examining the retina (ophthalmoscopy) or from photographs of the retina (fundus photography). The earliest clinical symptoms are damage to the vascular system of the retina, including micro-aneurisms and fluid leakage. Changes to the electrophysiology of the retina occur before the onset of clinically significant DR [12, 13]. The oscillatory potentials (OPs), a complex response that is thought to originate with the amacrine cells of the middle retina layers, seem to be particularly sensitive [14, 15]. Studies using the mfERG have revealed that changes to the retinal electrophysiology are spatially localised [16–18], correlate with glycemic control [8, 19], and may predict areas that later develop clinically significant features of DR [20–22]. The analysis techniques of these previously published studies required summarising the data. In the spatial domain, this involved averaging rings, quadrants or zones of responses together [8, 16, 18], or selecting an exemplary, ‘most abnormal’, response from a spatial area [21–23]. In the temporal domain, several techniques were used to reduce the data; several studies used a template-fitting algorithm that reduces the data to two values representing the amplitude and implicit times, respectively [17, 19–22], other studies used signal-to-noise ratios that have the effect of reducing the entire waveform of interest to one value [16]. ST-PLS analysis allows us to compare data from two groups of patients without needing to reduce either the spatial or temporal domains.
Methods
Sixty-two adolescent subjects (mean age 15.5 ± 1.8 years; 32 female and 30 male) with type 1 diabetes were recruited from the endocrinology clinic at The Hospital for Sick Children. Fifty-four control subjects (mean age 17.5 ± 4 years; 32 female and 22 male) were also recruited from the community. Subjects with preexisting conditions that could affect their visual system were excluded from the study. All subjects had 7 field stereoscopic fundus photographs taken, photographs were graded by a retinal specialist according to the modified Arlie House classification [11] or had a fundus examination performed by an ophthalmologist. Subjects with any signs of diabetic retinopathy or other retinal abnormalities were excluded from the analysis. Blood sugar levels of patients with diabetes were checked before starting the mfERG using a blood glucose meter (OneTouch Ultra, LifeScan Inc., Milpitas, CA, USA) to ensure blood glucose levels were between 4 and 10 mmol/l. All research was performed according to the tenets of the Declaration of Helsinki and was approved by the research ethics board at the Hospital for Sick Children. Multifocal electroretinogram recordings were performed using the Veris FMSII system (EDI Redwood, CA, USA).
One eye was randomly selected from each subject and pharmacologically dilated (tropicamide 0.5 % and phenylephrine hydrochloride 2.5 %). All subjects undertook two mfERG protocols. The first protocol was a standard clinical protocol consisting of 103 hexagons. Hexagons size was scaled according to eccentricity to produce responses with similar signal-to-noise ratio (SNR) as previously described [24]. Frames were presented at 60 Hz in photopic conditions, in every frame each hexagon had an approximately 50 % chance of being illuminated (mean luminance 100 cd/m2) according to a pseudo-random M sequence (M = 215 – 1) resulting in recording sessions requiring approximately 9 min. The stimulus was centred on the fovea and stimulated approximately 40° of the retina. Each session was split into 16 segments of equal length, subject fixation was monitored and segments with fixation loss were repeated. Retinal potentials were recorded using a bipolar Burian-Allen electrode, amplified by a factor of 10,000 and analogue band-pass filtered 10–300 Hz. This protocol produces retinal responses that are thought to be dominated by potentials arising from the photoreceptors and on- and off-bipolar cells [25].
The second protocol, referred to as a slow-flash multifocal electroretinogram (sf-mfERG) consists of a 61 hexagon stimulus, each multifocal frame was followed by 5 frames where all hexagons were dark. To reduce the recording times, the M sequence length was reduced to M = 212 – 1 resulting in a recording time of ~7 min. The mean luminance of the multi-focal frame was 100 cd/m2, the luminance of the dark frames was <2 cd/m2. The blank frames increased the time between stimulating frames to 100 ms. This allows the development of a more complex inner retinal response. Retinal potentials were recorded as before but an additional 75-Hz high-pass filter was applied. The response extracted in this manner resembles the oscillatory potentials isolated from single flash ERGs that are thought to originate from amacrine cells located in the middle and inner retinal layers [16, 18].
The data were first analysed using traditional methods: individual hexagon analysis and spatial averaging analysis, respectively. For the individual hexagon analysis, no spatial averaging was performed. Data from the standard mfERG protocol were analysed using a stretch-fitting algorithm that has been described previously [26, 27]. In summary, a template was generated for each hexagon by averaging waveforms from all the control subjects. The template waveform is then stretched in both amplitude and time to achieve the best match between it and the target waveform. This results in two values, the amplitude stretch factor and the implicit time stretch factor for each hexagon from each subject. The quality of the fit was measured using a statfit statistic (Eq. 1). S(t) represents the signal waveform at time point t, T(t) is the template waveform at time t and S-bar the mean value of the signal waveform. A statfit approaching 0 indicates a perfect fit, while a statfit approaching 1 indicates the fit is no better than to a straight line at the waveform mean. Recordings with>2 hexagons with a statfit>0.8 would be rejected, 5 control recordings and 7 subject recordings were excluded for meeting this criteria. Recordings with ≤2 poor hexagons were not excluded as this often represented the attenuated waveforms recorded from the optic disc. In addition, 3 recordings from subjects without diabetes were identified as having abnormally large mean amplitudes (>95 % CI). These tests were confirmed as outliers using the Tietjen–Moore test [28] and were excluded. Excluded tests were removed from all further analysis, and a new template was generated.
| (1) |
A signal-to-noise ratio (SNR) analysis was performed on the sf-mfERG ring average responses. The signal window was chosen to be between 14 and 53 ms and the noise window between 107 and 146 ms. The SNR was calculated according to Eq. 2 where s = signal, n = noise and t = time point.
| (2) |
Ring averaging and quadrant averaging was used for the spatial averaging analysis of the mfERG and sf-mfERG recordings, respectively. For the mfERG, ring averaging was performed, whereby responses from the same retinal eccentricity were averaged together creating 6 ring responses (Fig. 1a). The stretch-fitting algorithm described previously was then performed on these ring responses. As the sf-mfERG responses are not symmetrical around the retina, hexagons from each retinal quadrant were averaged together. Hexagons falling between multiple quadrants were excluded from the averages (Fig. 1b). Again a SNR analysis was performed as described previously.
Fig. 1.
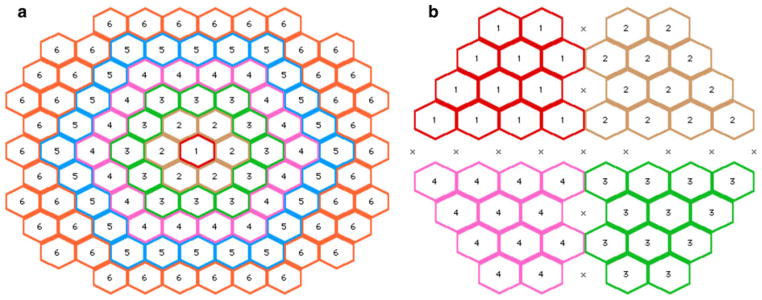
Groups used for spatial averaging analyses. a Ring analysis for standard mfERG, b quadrant analysis for sf-mfERG
Differences in the response amplitudes and timing (mfERG responses) and SNR (sf-mfERG) between the control and diabetes groups were analysed using analysis of variance (ANOVA). Post hoc analysis of differences significant at the 0.05 level was performed using Tukey’s “honest significant difference” method. This conventional analysis was used for comparison with the PLS analysis.
PLS analysis was performed using the PLSGui program (version 5.1102241) from the Rotman Research Institute (Toronto, Canada) which runs in the Matlab® (Mathworks, Natick, MA, USA) environment.
PLS analysis has been described in detail previously [6]. A summary of the underlying theory is presented in an “Appendix”.
Results
Traditional analysis
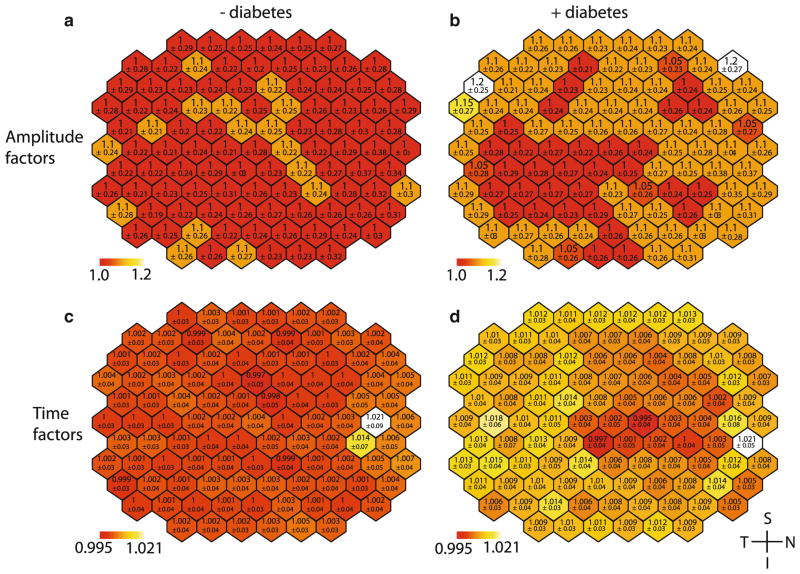
Analysis of the individual hexagon data from the standard mfERG was unable to identify any significant differences in the waveform amplitude stretch factors between groups. A small but significant increase of 0.01 (p <0.001) was observed between groups in the implicit time stretch factor, this is approximately equivalent to a 0.2-ms delay at P1 for the group with diabetes (Fig. 2b). Analysis indicated no significant differences between the implicit time variables for hexagons (Fig. 2d). As there was no significant interaction between group and hexagon, this analysis was unable to locate the changes in implicit time to specific retinal locations. The ring averaged data also indicated an increase in the stretch factor between groups (p <0.1) with no observable difference in the amplitude.
Fig. 2.
Spatial distribution of mean stretch factors across mfERG. Top a, b amplitude stretch factors, bottom c, d time stretch factors. Left column a, c control data, right column b, d subject data. All images are shown in right eye orientation. Lower values represent 1 standard deviation. Colour scales are consistent across results. The red end of the scale represents the minimum mean hexagon value for controls and subjects. Values towards the white end of the scale represent the maximum mean hexagon value. The colour scale is separated into 50 equal-sized divisions spanning the entire range
Analysis of the sf-mfERG SNR values showed no difference between groups (Fig. 3); however, there was a difference between spatial locations within a group for both the hexagon analysis (p <0.001) and quadrant analysis (p <0.001). Post hoc examination of the averaged quadrants indicated that the differences were significant between quadrant 3 (inferior temporal) and the quadrants 1 (p <0.01) and quadrant 2 (p <0.001), these quadrants represent the superior retina.
Fig. 3.
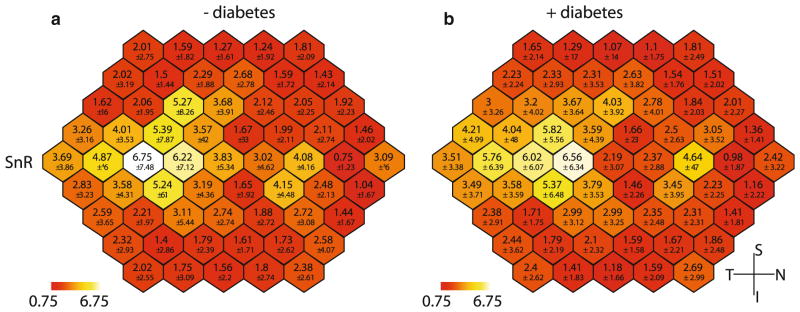
Spatial distribution of mean SNR values from sf-mfERG recordings. a Mean of control data, b mean of subject data. All images are shown in right eye orientation. Lower values represent 1 standard deviation
PLS analysis
The retinal response scores of the standard mfERG’s recorded from the subjects with diabetes and control subjects reveal an overall difference between groups (p <0.05).
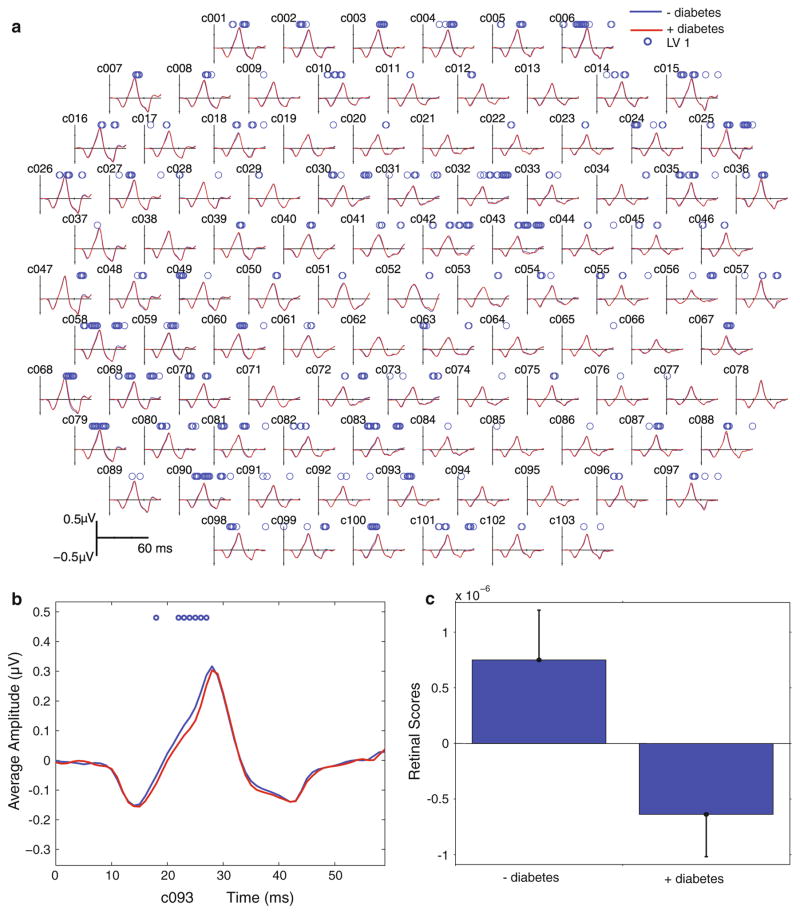
When the saliences were projected back onto the recorded data, it is possible to see both the spatial and temporal distribution of the group differences. In general, the waveform was delayed in subjects with diabetes. Figure 4 shows that the waveform delays were distributed across the entire retina possibly with a greater proportion affecting the temporal (c.f nasal) retinal area. In 28 retinal locations, the delays occurred primarily on the leading edge of the principle multi-focal component (before P1), and these delays would be reflected as a delay in the P1 implicit time. In 20 locations, the delays occurred on the falling edge (after P1). Thirteen hexagons showed significant delays both before and after P1, and 42 locations showed no significant differences (Fig. 4).
Fig. 4.
a Group average standard mfERG waveforms. Average mfERG waveforms from 103 retinal areas are shown. Red lines are the average waveform from subjects with diabetes, and blue lines are the average from control subjects. Circles above the waveforms indicate time points that are significantly different between groups. b Close-up from a hexagon in the inferior retina (c093) with significant time points on the rising edge of P1. c Retina response scores for LV1 associated with the 2 groups. Whiskers indicate the confidence bars. The upper and lower bounds for the 95 % confidence interval are the computed percentiles of the bootstrapped distribution
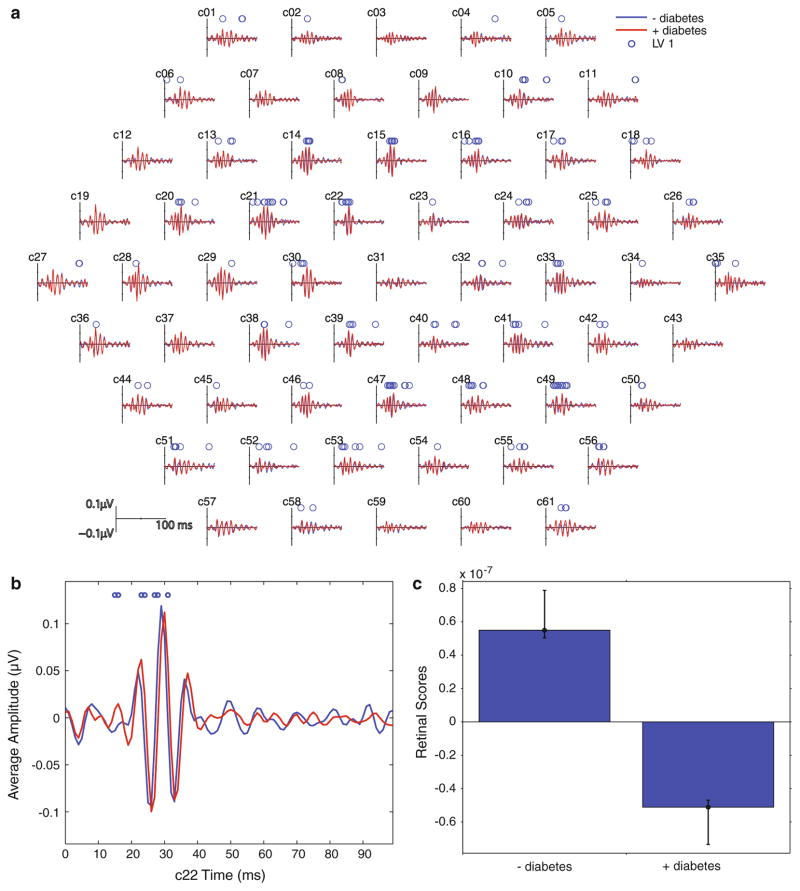
The slow-flash mfERG protocol generated waveforms with 2–4 peaks occurring between 10 and 50 ms after stimulation. Examination of the retinal response scores revealed that there was a significant difference (p <0.001) between subject with diabetes and those without. Examination of the spatial distribution of the waveforms showed a delay in the OPs, localised to a parafoveal ring, for the group with diabetes compared with the control group (Fig. 5).
Fig. 5.
a Group average slow-flash mfERG waveforms. b Close-up of one retinal area (c22). Red lines are the average waveform from subjects with diabetes, and blue lines are the average from control subjects. Circles above the waveforms indicate time points that are significantly different between groups. c Retinal response scores for LV1 associated with the 2 groups. Whiskers indicate the confidence bars. The upper and lower bounds for the 95 % confidence interval are the computed percentiles of the bootstrapped distribution
Discussion
Typically, analysis of mfERG waveforms involves techniques that are designed to reduce the amount of data, making it more amenable to traditional statistical methods but potentially loosing important information. The data reduction methods can be divided into two classes spatial and temporal: spatial averaging reduces the spatial resolution of the data. Many averaging schemes have been used, such as ring and quadrant averaging highlighted in this study. Which, if any, averaging scheme is used requires careful consideration? To maximise sensitivity, the chosen scheme must match the expected pattern of response changes. For example, changes occurring in localised retinal regions, such as those occurring in early Stargardt macular dystrophy, may not be identified if affected areas of the retina are averaged together with normally functioning retinal areas. The second class of data reduction methods involves reducing the information in the temporal domain. Often, a complex waveform is reduced to 3 cardinal points (N1, P1 and N2). In this study, we highlight two temporal reduction methods that have been shown to be sensitive to retinal function changes due to diabetes. Data analysis using spatial and temporal data reduction methods is compared with a multivariate analysis technique, ST-PLS, that requires no reduction of data in either the spatial or temporal domains.
Template analysis was able to identify delays in the mfERG occurring in subjects with diabetes, before the onset of retinopathy. This finding is in accordance with previous reports [19, 23, 29]. The technique has been successfully used to predict sites of subsequent diabetic retinopathy [20–22]. A study comparing the template-stretching algorithm with the analysis of the amplitude and implicit times of the N1, P1 and N2 components of the mfERG concluded that implicit time measured by template stretching was the most sensitive measure of changes to retinal function occurring due to diabetic retinopathy. This study did not find that the later components were more delayed than the earlier components and rejected the supposition that stretching was an accurate description of the underlying changes [30]. This is important information as the precise nature of changes to the mfERG waveform can provide information about the cell types and processes involved [25].
In this study, the sf-mfERG protocol always followed the mfERG protocol. While the mean luminance of the sf-mfERG protocol was higher than that used in previous studies, it is still lower than that of the mfERG. Since the mfOPs are thought to reflect the interaction of the rod and cone visual systems [31], it is possible that adaptation due to the protocol order may have modified the responses. However, as the order of recording was the same in both subject groups this would not invalidate the identified group differences. SNR have previously been used to analyse the sf-mfERG response. Using our data, signal-to-noise analysis confirmed that responses vary according to retinal location, but it was not able to find a group effect. PLS analysis, however, was able to identify a difference between the two subject groups for both the standard mfERG and sf-mfERG,, and to display the spatial distribution of these changes across the retinal map.
In contrast to the traditional analysis methods described previously, ST-PLS allows changes in the waveforms to be examined, while making no assumptions about the spatial or temporal nature of the changes. ST-PLS therefore promises to be a powerful tool for the analysis of mfERG data. Because the ST-PLS analysis is able to consider all the information present in the recordings, it could in this study distinguish significant differences between subjects with diabetes and control subjects in both the standard mfERG and sf-mfERG recordings. In addition, because the PLS technique preserves the spatial and temporal position of all the data, it is easy to visualise the patterns of changes that occur.
This study confirms that functional changes are observable in the retinas of subjects with type 1 diabetes before any clinical diabetic retinopathy is visible. The use of two different multifocal protocols targeting different retinal structures suggests different distributions of retinal dysfunction. Qualitative analysis of the spatial distribution of changes in the mfERG, identified by ST-PLS, suggests a greater proportion of the changes occur in the temporal retina (Fig. 4). Delays identified in the sf-mfERG seem to concentrate in the para-foveal regions.
As previously reported, the slow-flash mfERG waveforms recorded from healthy eyes are not evenly distributed across the retina, with those generated from more temporal retinal locations having larger amplitudes [31]. The parafoveal spatial distribution of defects in the slow-flash mfERG recorded from patients with diabetes has also been previously reported [15] and may represent the location of the thickest regions of the nerve fibre layer, providing more evidence that this stimulus protocol preferentially isolated responses originating from inner retinal structures.
The temporal pattern of changes is harder to interpret, ST-PLS revealed changes to the leading edge of the mfERG P1 component that could reflect the changes identified by peak-picking analyses. In addition, it was able to identify changes occurring in the trailing edge that would not be identified by analyses focused on the P1 peak. There is no clear spatial pattern to the distribution of time points identified by ST-PLS around the P1 peak, and it is currently unclear why adjacent retinal areas should show different response profiles. The leading edge of the P1 component is formed by the interaction of depolarising ON-bipolar cells and the recovery of the OFF-bipolar cells, while the trailing edge is the interaction of depolarisation of the OFF-bipolar cells and the recovery of the ON-bipolar cells [25]. This may suggest that diabetes-related retinal defects affect both the activation and recovery phases of the retinal bipolar cells.
We have demonstrated that partial least squares analysis methods can be applied to the analysis of multifocal electroretinogram data. While the ST-PLS analysis does not require data reduction in either the spatial or temporal domains, a clear limitation of the technique is the requirement to collapse all data within groups. While it is possible to use the technique to measure waveform differences for individual subjects, it is not possible to generate robust statistics for any differences. This problem is not unique to ST-PLS and could be overcome if multiple recordings are available. The PLS analysis provides insight into both the spatial and temporal distribution of waveform changes. This information is useful for identifying differences between affected and control groups and will also be useful in directing the development of more traditional analyses.
Acknowledgments
This study was partially funded by the Juvenile Diabetes Research Foundation (JDRF 1-2005-1116) and the Canadian Institute of Health Research (CIHR 219857). Author JN was supported by grants from Region Västra Götaland, Sweden (“Agreement concerning research and education of doctors” ALFGBG-146731). The funding sources had no input in the conduct of this research or the preparation of this article.
Appendix
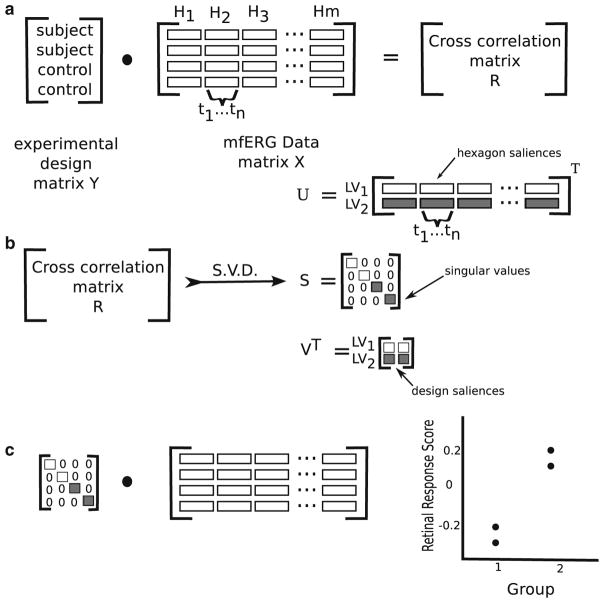
In summary, a vector is formed containing the concatenated waveforms from all the hexagons in a recording. These are assembled into a matrix X where each row represents the amplitudes of mfERG data from a single subject: each column represents a single time point from a single retinal location. A second matrix Y contains information about the experimental design. Each row represents a subject and each column an experimental factor. For this study, the design matrix Y contains only one variable representing the diabetic status of each subject. The scalar product of X and Y creates a third matrix R, the cross-correlation matrix (Eq. 3, Fig. 6a).
Fig. 6.
Diagram illustrating the steps in the ST-PLS analysis of mfERG data. a The cross-correlation between the experimental design (diabetes/no diabetes) and the mfERG recordings (Hn hexagon, tn time point). b The singular value decomposition (SVD) of the cross-correlation matrix (LV latent variable). c Multiplication of the mfERG data matrix with the singular values from the SVD to obtain the retinal response scores. Figure adapted by the author from [5]
| (3) |
This matrix R represents the correlations between X and Y. The primary analytical tool for PLS is the singular value decomposition (SVD), this decomposes the data into three matrices USV (Eq. 4, Fig. 6b). The SVD is a method for transforming the data points in R (derived in Eq. 3) such that they are expressed along a series of orthogonal dimensions. This allows the identification and ordering of the dimensions along which the data points of matrix R have the most variation.
| (4) |
The matrices U and V that result from the SVD of the correlation matrix R are referred to as saliences. The design salience U represents the experimental design factors (matrix Y), and the hexagon signal salience V represents the features of the recordings in time and space (matrix X) that best characterise R. When the saliences are projected back onto the original matrices X and Y two latent variable matrices are created (Eqs. 5a and 5b).
| (5a) |
| (5b) |
The latent variable matrix LX consists of values representing information about the recorded wave-forms. Latent variable LY contains information about the experimental design. Each pair of vectors from LX and LY (LXi and LYi) represents a relationship between the recorded waveforms and experimental design.
The third output of the SVD is a vector of singular values S. The singular values represent the covariance of the experimental effect with the mfERG amplitude for each latent variable. When the singular values S are multiplied back against original data X a single value, the retinal response score is obtained (Fig. 6c). The values are arbitrary; however, the sign and magnitude indicate the relative amount of difference between the diabetes and control groups. The greater the distance of the value from 0, the more significant the difference between groups. Values with the same sign would indicate similarities between the groups. Values with opposite sign indicate differences between groups.
Two techniques are used to determine which saliences are statistically significant. First, a permutation test is used where the rows (i.e. subjects) in matrix X are randomly re-ordered while matrix Y remains unchanged. When this is repeated many times, a distribution of possible saliences is assembled allowing the likelihood of the observed salience to be calculated. The stability of the signal recorded from each hexagon saliences was determined using a bootstrapping technique that samples, with replacement, rows from both X and Y matrices. Multiple repetitions of this process allow estimation of the standard errors of the salience values. The ratio of the salience to the bootstrapped standard deviation is approximately equivalent to a z score [32]. Bootstrap ratios >3 (equivalent to p <0.001) were taken to indicate stable saliences, that is, time points where a hexagon’s signal amplitude differed significantly from 0.
Footnotes
A preliminary version of this work was presented at the XLVI ISCEV symposia 2008 [33].
Conflict of interest: None.
Contributor Information
Tom Wright, Department of Clinical Neuroscience, Institute of Neuroscience and Physiology, The Sahlgrenska Academy at the University of Gothenburg, Göteborg, Sweden. Ophthalmology and Vision Sciences, The Hospital for Sick Children, Toronto, ON M5G 1X8, Canada.
Filomeno Cortese, Seaman Family MR Research Centre, Hotchkiss Brain Institute, University of Calgary, Calgary, Canada.
Josefin Nilsson, Department of Clinical Neuroscience, Institute of Neuroscience and Physiology, The Sahlgrenska Academy at the University of Gothenburg, Göteborg, Sweden.
Carol Westall, Ophthalmology and Vision Sciences, The Hospital for Sick Children, Toronto, ON M5G 1X8, Canada. Ophthalmology and Vision Sciences, University of Toronto, Toronto, Canada.
References
- 1.Sutter EE. Imaging visual function with the multi-focal m-sequence technique. Vision Res. 2001;41:1241–1255. doi: 10.1016/s0042-6989(01)00078-5. [DOI] [PubMed] [Google Scholar]
- 2.Hood DC, Bach M, Brigell M, et al. ISCEV standard for clinical multifocal electroretinography (mfERG) (2011 edition) Doc Ophthalmol Adv Ophthalmol. 2012;124:1–13. doi: 10.1007/s10633-011-9296-8. [DOI] [PMC free article] [PubMed] [Google Scholar]
- 3.de Rouck AF. History of the electroretinogram. In: Heckenlively JR, Arden GB, editors. Principals and practice of clinical electrophysiology of vision. MIT Press; Massachusetts: 2006. pp. 3–11. [Google Scholar]
- 4.Marmor MF, Fultona B, Holder GE, et al. ISCEV Standard for full-field clinical electroretinography (2008 update) Doc Ophthalmol Adv Ophthalmol. 2009;118:69–77. doi: 10.1007/s10633-008-9155-4. [DOI] [PubMed] [Google Scholar]
- 5.McIntosh AR, Bookstein FL, Haxby JV, et al. Spatial pattern analysis of functional brain images using partial least squares. NeuroImage. 1996;3:143–157. doi: 10.1006/nimg.1996.0016. [DOI] [PubMed] [Google Scholar]
- 6.Krishnan A, Williams LJ, McIntosh AR, et al. Partial least squares (PLS) methods for neuroimaging: a tutorial and review. Neuroimage. 2011;56:455–475. doi: 10.1016/j.neuroimage.2010.07.034. [DOI] [PubMed] [Google Scholar]
- 7.Protzner AB, Cortese F, Alain C, et al. The temporal interaction of modality specific and process specific neural networks supporting simple working memory tasks. Neuropsychologia. 2009;47:1954–1963. doi: 10.1016/j.neuropsychologia.2009.03.007. [DOI] [PubMed] [Google Scholar]
- 8.Khan MI, Barlow RB, Weinstock RS. Acute hypoglycemia decreases central retinal function in the human eye. Vision Res. 2011;51:1623–1626. doi: 10.1016/j.visres.2011.05.003. [DOI] [PMC free article] [PubMed] [Google Scholar]
- 9.Melendez-Ramirez LY, Richards RJ, Cefalu WT. Complications of type 1 diabetes. Endocrinol Metab Clin North Am. 2010;39:625–640. doi: 10.1016/j.ecl.2010.05.009. [DOI] [PubMed] [Google Scholar]
- 10.Klein R, Klein BE, Moss SE, et al. The Wisconsin epidemiologic study of diabetic retinopathy. II. Prevalence and risk of diabetic retinopathy when age at diagnosis is less than 30 years. Arch Ophthalmol. 1984;102:520–526. doi: 10.1001/archopht.1984.01040030398010. [DOI] [PubMed] [Google Scholar]
- 11.Grading diabetic retinopathy from stereoscopic color fundus photographs—an extension of the modified Airlie House classification. ETDRS report number 10. Early Treatment Diabetic Retinopathy Study Research Group. Ophthalmology. 1991;98:786–806. [PubMed] [Google Scholar]
- 12.Shirao Y, Kawasaki K. Electrical responses from diabetic retina. Progr Retin Eye Res. 1998;17:59–76. doi: 10.1016/s1350-9462(97)00005-0. [DOI] [PubMed] [Google Scholar]
- 13.Arden GB, Hamilton aM, Wilson-Holt J, et al. Pattern electroretinograms become abnormal when background diabetic retinopathy deteriorates to a preproliferative stage: possible use as a screening test. Br J Ophthalmol. 1986;70:330–335. doi: 10.1136/bjo.70.5.330. [DOI] [PMC free article] [PubMed] [Google Scholar]
- 14.Miyake Y. Macular oscillatory potentials in humans. Macular OPs. Doc Ophthalmol Adv Ophthalmol. 1990;75:111–124. doi: 10.1007/BF00146547. [DOI] [PubMed] [Google Scholar]
- 15.Onozu H, Yamamoto S. Oscillatory potentials of multifocal electroretinogram retinopathy. Doc Ophthalmol. 2003;106:327–332. doi: 10.1023/a:1022903627332. [DOI] [PubMed] [Google Scholar]
- 16.Bearse MA, Han Y, Schneck ME, et al. Local multi-focal oscillatory potential abnormalities in diabetes and early diabetic retinopathy. Invest Ophthalmol Vis Sci. 2004;45:3259–3265. doi: 10.1167/iovs.04-0308. [DOI] [PubMed] [Google Scholar]
- 17.Bearse MA, Han Y, Schneck ME, et al. Retinal function in normal and diabetic eyes mapped with the slow flash multifocal electroretinogram. Invest Ophthalmol Vis Sci. 2004;45:296–304. doi: 10.1167/iovs.03-0424. [DOI] [PubMed] [Google Scholar]
- 18.Kurtenbach A, Langrova H, Zrenner E. Multifocal oscillatory potentials in type 1 diabetes without retinopathy. Invest Ophthalmol Vis Sci. 2000;41:3234–3241. [PubMed] [Google Scholar]
- 19.Lakhani E, Wright T, Abdolell M, et al. Multifocal ERG defects associated with insufficient long-term glycemic control in adolescents with type 1 diabetes. Invest Ophthalmol Vis Sci. 2010;51:5297–5303. doi: 10.1167/iovs.10-5200. [DOI] [PMC free article] [PubMed] [Google Scholar]
- 20.Han Y, Bearse MA, Schneck ME, et al. Multifocal electroretinogram delays predict sites of subsequent diabetic retinopathy. Invest Ophthalmol Vis Sci. 2004;45:948–954. doi: 10.1167/iovs.03-1101. [DOI] [PubMed] [Google Scholar]
- 21.Harrison WW, Bearse MA, Ng JS, et al. Multifocal electroretinograms predict onset of diabetic retinopathy in adult patients with diabetes. Invest Ophthalmol Vis Sci. 2011;52:772–777. doi: 10.1167/iovs.10-5931. [DOI] [PMC free article] [PubMed] [Google Scholar]
- 22.Ng JS, Bearse MA, Schneck ME, et al. Local diabetic retinopathy prediction by multifocal ERG delays over 3 years. Invest Ophthalmol Vis Sci. 2008;49:1622–1628. doi: 10.1167/iovs.07-1157. [DOI] [PubMed] [Google Scholar]
- 23.Han Y, Adams AJ, Bearse MAJ, et al. Multifocal electroretinogram and short-wavelength automated perimetry measures in diabetic eyes with little or no retinopathy. Arch Ophthalmol. 2004;122:1809–1815. doi: 10.1001/archopht.122.12.1809. [DOI] [PubMed] [Google Scholar]
- 24.Bearse MAJ, Sutter EE. Imaging localized retinal dysfunction with the multifocal electroretinogram. J Opt Soc Am A. 1996;13:634–640. doi: 10.1364/josaa.13.000634. [DOI] [PubMed] [Google Scholar]
- 25.Hood DC, Frishman LJ, Saszik S, et al. Retinal origins of the primate multifocal ERG: implications for the human response. Invest Ophthalmol Vis Sci. 2002;43:1673–1685. [PubMed] [Google Scholar]
- 26.Wright T, Nilsson J, Gerth C, et al. A comparison of signal detection techniques in the multifocal electroretinogram. Doc Ophthalmol Adv Ophthalmol. 2008;117:163–170. doi: 10.1007/s10633-008-9121-1. [DOI] [PubMed] [Google Scholar]
- 27.Hood D, Li J. A technique for measuring individual multifocal ERG records. Trends Opt Photon. 1997;11:280–293. [Google Scholar]
- 28.Filliben JJ, Heckert A. Exploratory Data Analysis. [Accessed 31 Mar2012];NIST/ SEMATECH e-Handbook of Statistical Methods. 2003 http://www.itl.nist.gov/div898/handbook/
- 29.Fortune B, Schneck ME, Adams AJ. Multifocal electroretinogram delays reveal local retinal dysfunction in early diabetic retinopathy. Invest Ophthalmol Vis Sci. 1999;40:2638–2651. [PubMed] [Google Scholar]
- 30.Schneck ME, Bearse MAJ, Han Y, et al. Comparison of mfERG waveform components and implicit time measurement techniques for detecting functional change in early diabetic eye disease. Doc Ophthalmol. 2004;108:223–230. doi: 10.1007/s10633-004-8745-z. [DOI] [PubMed] [Google Scholar]
- 31.Bearse MA, Shimada Y, Sutter EE. Distribution of oscillatory components in the central retina. Doc Ophthalmol Adv Ophthalmol. 2000;100:185–205. doi: 10.1023/a:1002783719958. [DOI] [PubMed] [Google Scholar]
- 32.Itier RJ, Taylor MJ, Lobaugh NJ. Spatiotemporal analysis of event-related potentials to upright, inverted, and contrast-reversed faces: effects on encoding and recognition. Psychophysiology. 2004;41:643–653. doi: 10.1111/j.1469-8986.2004.00183.x. [DOI] [PubMed] [Google Scholar]
- 33.Wright T, Cortese F, Westall C. A novel approach analyzing multifocal ERGs: spatiotemporal partial least squares (ST-PLS) Doc Ophthal. 2008;117:49. [Google Scholar]


