Abstract

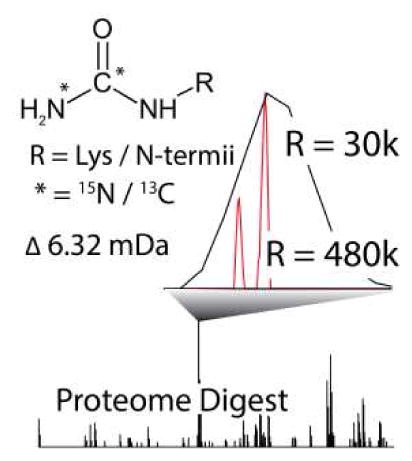
We describe a chemical tag for duplex proteome quantification using neutron encoding (NeuCode). The method utilizes the straightforward, efficient, and inexpensive carbamylation reaction. We demonstrate the utility of NeuCode carbamylation by accurately measuring quantitative ratios from tagged yeast lysates mixed in known ratios and by applying this method to quantify differential protein expression in mice fed a either control or high-fat diet.
Introduction
Recently we described a fresh approach to MS1-based proteome quantification by metabolic labeling that increases plexing capacity by compressing the “light” and “heavy” partner spacing by ~ 103, i.e., from several Da to several mDa [1]. To achieve mDa spacing we grew cells on two isotopologues of lysine – each having eight additional neutrons, one including 13C and 15N and the other with 2H. Here “light” and “heavy” peptide partners were spaced by 36 mDa and are distinguished from one another with MS1 mass resolving powers in excess of ~ 100,000. Such resolution is readily accessed with modern Fourier Transform mass analyzers such as Ion Cyclotron Resonance (FT-ICR) and Orbitraps. Because the method exploits the subtle differences in neutron binding energy of the various stable isotopes we called this method neutron-encoded quantification (NeuCode). Note the phenomenon of mass defect has been previously exploited in proteomics. Prior uses include peptide labeling with amine- or cysteine-reactive tags containing heavier isotopes, such as 79Br, to impart large and unique mass defects and move peptide ions into regularly unoccupied spectral space [2]. Orlando and colleagues used mass defect by permethylating glycans with labels incorporating either 1H or 2H. Because each glycan accepted several labels mass differences in excess of 50 mDa could be induced and distinguished with MS resolving powers of 25,000 [3]. Building on these ideas, NeuCode uses multiple isotopes (C, H, N, and O) and typically engineers mass differences ranging from 6 to 36 mDa into peptides and requires resolving powers in excess of 100,000.
Here we expand the NeuCode method by the design of a simple and readily accessible chemical tag. Certain samples, including biological tissues and fluids, are challenging to label metabolically, hence, chemical approaches to introduce stable isotopes are key to many applications. Further, if well-chosen, reagents for chemical labeling can be quite inexpensive. We selected urea (CH4N2O) as it can carbamylate free amines with excellent efficiency under simple conditions (i.e., urea + heat). For each site of carbamylation on a peptide, typically two for proteins digested with LysC, a 6.3 mDa mass difference is encoded. Here, we evaluate the quantitative accuracy and precision of these duplex NeuCode chemical tags using complex mixtures of proteins from yeast and mouse tissues.
Methods
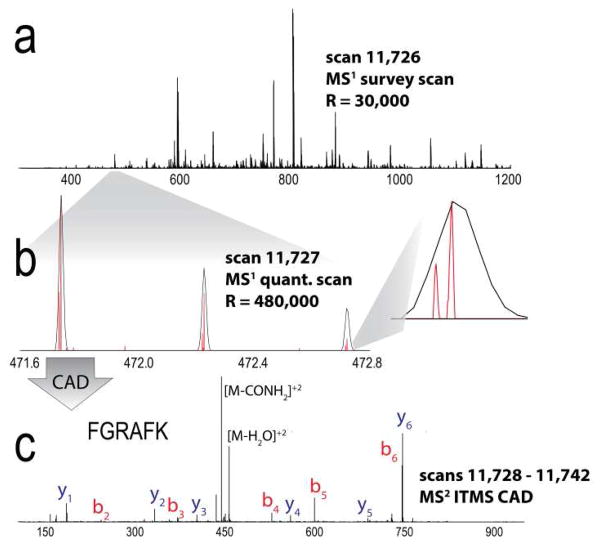
CAST/EiJ mice (Jackson Laboratory, Bar Harbor, Maine) were fed a control diet or a high fat/high sucrose diet for 5 months. Proteomic samples from either mouse liver or yeast cultures were performed as previously described [1, 4, 5]. Isotopically labeled urea (15N2 or 13C1) was purchased from Cambridge Isotope Laboratories (Tewksbury, MA). Peptides were carbamylated by incubating at pH 8 with a large excess of aqueous 8 M urea at 80°C for 4 hours and remaining urea was removed by desalting (Online Resource 1) [6]. Fractionation of the murine peptides was performed by offline high pH reverse-phase separation [4]. Peptide mixtures were separated using self-prepared capillary LC columns and analyzed upon elution using an Orbitrap Elite mass spectrometer with conditions described elsewhere (Thermo Scientific, San Jose, CA) [1]. Figure 1 presents an overview of the scan methods. Resulting data was searched against a target-decoy database (1% FDR) using the Open Mass Spectrometry Search Algorithm (OMSSA) [7–9]. Proteins were quantified by extracting the sum of all contributing peptide intensities using a custom, in-house algorithm (manuscript in preparation). Abundance ratios were normalized to account for differences in total material.
Figure 1.
Data acquisition method for analysis of carbamyl NeuCode tagged peptides. (a) Orbitrap MS1 survey scan (R = 30,000). (b) Orbitrap quantitation scan (MS1, R = 480,000) reveals the quantitative information. (c) Ion trap CAD MS/MS scan of carbamyl NeuCode tagged peptide having the sequence FGRAFK
Results
Carbamylation with isotopically light and 13C and 15N enriched urea, which incorporates a 2 Da mass difference, has been previously described for MS1-based protein quantification [6]. Building on this research, we selected the carbamylation reaction for NeuCode labeling for three reasons. First, carbamylation of amines with urea is straightforward, simple, and well-established. Second, carbamylation only modestly increases overall peptide mass (44 Da). Third, isotopic versions of urea are readily available and relatively inexpensive.
Theoretical Background
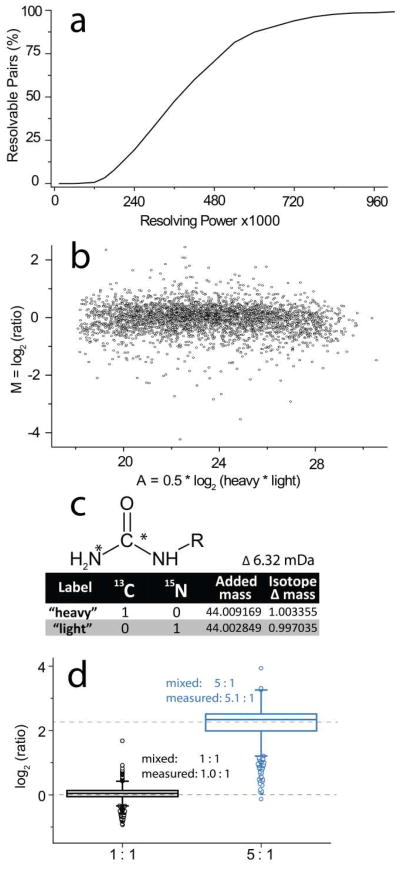
We assembled a library of 36,783 experimentally detected peptide ions – using their observed charge (z) and mass-to-charge (m/z) ratios for in silico calculations. The calculations counted the number of free amines and installed a corresponding number of carbamyl moieties in either NeuCode heavy (13C) or light (15N) flavors. We calculated whether each of the NeuCode partner peaks could be separated (full-width at 10% of maximum, FWTM) at resolving powers up to 106 (Figure 2a, Online Resource 2). This relatively conservative definition only considers NeuCode peak areas overlapping by less than 3.2% as quantifiable. Given that commercial Orbitrap hybrid MS systems can achieve routine resolution of 480,000 (@ m/z 400), we conclude that the majority of peptides labeled by NeuCode carbamylation (71%) are suitable for quantification. Further improvements to Orbitrap analyzer technology, or analysis on a higher resolving power FT-ICR system, will increase the quantifiable percentage. Peptides suitable for quantitation had an average m/z of 698 and an average charge state of 2.41, whereas peptides unsuitable for quantitation at the employed resolving power had an average m/z of 930 and an average charge state of 3.02. Nearly all the carbamyl NeuCode doublets are separable at the highest reported Orbitrap resolution of 106 [10]. Further, FT-ICR devices achieve the highest resolution and could likewise resolve virtually all peptide precursors carrying such labels.
Figure 2.
Overview of the carbamyl NeuCode strategy. (a) Theoretical calculation of the percentage of carbamyl NeuCode tagged peptides that are resolvable, thus, quantifiable, at resolutions up to 106 (full width at 10% max). (b) Fold change (M) for every protein in the murine high-fat diet model versus total intensity (A) of all peptides mapping to a protein. (c) The urea label, isotope substitutions, and mass changes employed to achieve carbamyl NeuCode reagents. (d) Box plots showing the measured and true 1:1 and 1:5 peptide ratios. The box represents the median, 25th, and 75th percentile while the whiskers show 1.5 × interquartile range. The circles show outliers
Reaction and Label
Following carbaminomethylation of cysteine residues, we digested a complex mixture of yeast proteins using LysC and subjected the resulting peptides to a carbamylation reaction with either 13C or 15N labeled urea [6]. We achieved labeling efficiencies in excess of 95%. Only deprotonated amines can be carbamylated. Consequently, R residues will not undergo this reaction at pH 8 (pKa = 12.5). Little evidence for R or H carbamylation was evident − 0.9% of R residues (37/3931) and 1.1% of H residues (24/2092) were carbamylated (1% FDR). Note peptides resulting from LysC digestion accept two carbamyl groups and, thus, incur a mass difference of 12.6 mDa. Further, LysC digestion provides comparable coverage of the yeast proteome as compared to trypsin [11]. The carbamyl NeuCode tagged peptides were loaded onto a nanoflow capillary reversed-phase LC column and were ionized by an integrated electrospray emitter. The resulting protonated peptide ions were mass analyzed using an Orbitrap hybrid MS. The system conducted an initial FT-MS survey scan (30,000 resolving power) to direct data dependent MS/MS scans followed by a high resolution MS1 scan (R = 480,000 @ m/z 400) for quantitation (Figure 1). Note this resolution is available on all Orbitrap Elite MS systems by installation of the manufacturer’s developer’s kit software. MS/MS scans were acquired using the linear ion trap (Figure 1c). As evidenced in Figure 1, the quantitative information is concealed in both the initial MS1 survey scan (R = 30,000 @ m/z 400) and in the ion trap MS/MS scans. The high resolution quantification scan, however, separates the NeuCode pair, revealing the quantitative data. The high resolution MS1 scan is conducted concurrently with the trap MS/MS events to optimize duty cycle.
Effects of high resolution scan cycle
The NeuCode approach combines advantages of other quantitative methods. Similar to metabolic labeling approaches, each peptide’s natural isotope pattern provides multiple isotopic peaks for garnering quantitative measurements. Additionally, as in isobaric tagging strategies, the signal across quantitation channels is combined during survey MS1 scans so that redundant MS/MS scans are not acquired by selection of identical peptide sequences across multiple isotopic clusters. This method thus affords a larger signal and lower spectral complexity for deep sampling of the proteome [12]. Finally, the MS/MS-independence of quantitation of the NeuCode method obviates the need for high precursor ion purity.
The NeuCode scan cycle requires the collection of a high resolution MS1 scan. Today the acquisition of a 480K scan requires collection of a 1.7 second transient. Doubtless the duration required to achieve this resolving power will be reduced as instrumentation continues to evolve; that said, by parallel collection of MS/MS scans, only a very subtle decrease in overall duty cycle is imposed. To document this we injected a digested yeast protein lysate and analyzed it using both the NeuCode scan sequence and a traditional data-dependent method. Despite the addition of a high-resolution FTMS quantitation scan, only 4% fewer peptides were identified from the data resulting from the NeuCode analysis, i.e., 9,276 instead of 9,685 (1% FDR).
Quantitative accuracy. Next we investigated quantitative accuracy – a critical figure of merit of any quantitation method. We combined aliquots of labeled yeast LysC peptides in 1:1 and 5:1 ratios before LC-MS/MS analysis. Each sample was interrogated in triplicate. The median measured ratios for identified peptides were 1.03:1, 1.03:1, and 1.03:1 and 5.07:1, 5.06:1, and 5.03:1. Standard deviations were between 0.21 – 0.23 and 0.52 – 0.61, respectively, on a log2-fold change scale (Figure 2d).
High fat diet induced proteome changes
To further validate the NeuCode method we utilized a mouse model - a typical tissue sample type that is challenging to label using metabolic approaches. We measured the effects of a high fat diet on the proteome of mice from the CAST/EiJ strain, which are highly resistant to diet-induced obesity and diabetes. Liver tissue was homogenized and the cells lysed. Whole protein extracts were digested with LysC, labeled with carbamyl NeuCode tags, fractionated, and measured by nHPLC-MS/MS. In total, we identified 14,718 murine peptides. Of all theoretically separable NeuCode partners, 87% were experimentally quantified. The slight reduction from theory is mostly due to a subset of low signal-to-noise precursors; this is likewise observed in traditional SILAC experiments. Note that closely spaced m/z peaks, such a NeuCode partners, can sometimes be detected as a single entity due to the well-known phenomenon of peak coalescence. We did notice occasional coalescence of the most intense peaks in the high resolution MS1 scans. In those cases our data analysis software uses lower abundance isotopes to extract quantitative information (as described elsewhere) [1].
In accordance with previously published research, proteins associated with peroxisomes were considerably up-regulated in the mice that were fed a high-fat diet (Online Resource 3) [13]. Further, expression of mitochondrial proteins was broadly down-regulated [14]. These findings were established by comparing the population of protein groups up-regulated by at least 50% (184) and protein groups down-regulated by at least 50% (337) to the total population (n = 2,879) of quantified proteins [15]. Finally, we conclude these detected differences were not due to increased variability of lower signal datapoints by comparing the measured fold-change to signal intensity (Figure 2b).
Conclusions
We have demonstrated the feasibility of NeuCode carbamylation via urea isotopologues for relative proteome quantification. The labeling reaction is reproducible, highly efficient, and relatively simple, requiring only a urea solution and a heated reaction vessel. Experimentally measured relative abundances of peptides from a combined yeast digest mixed in known ratios were very close to the true ratios. The major requirement to implement NeuCode urea labeling is a mass spectrometer capable of a resolving power of ~ 500,000 (@ 400 m/z). Current and recent models of Orbitrap MS systems already achieve this performance in commercial platforms. Using 15N and 13C-urea-based labeling affords a robust, accurate, and tissue-compatible implementation of duplex NeuCode quantitation.
Supplementary Material
Sample preparation overview for carbamyl NeuCode method. Enzymatic digestion (a) of proteins is followed by labeling with heavy urea (b). Labeled peptides are mixed (c) and offline fractionation was undertaken (d). Finally, peptides were interrogated by LC-MS/MS (e+f)
Theoretical Calculations are shown in an Excel spreadsheet. Each of 36783 identified peptide spectral matches is categorized as quantifiable at FWTM or not depending on the resolving power, peptide mass, charge, and number of lysine residues. Results are presented in tabular and graphical form
An Excel table with all measured protein fold changes in response to high fat diet is given. A protein description, the number of peptides mapping to each protein, the Uniport Id(s), quantitative ratios, and total signal intensity are provided
Acknowledgments
This work was supported by the National Institutes of Health grants R01 DK066369, DK058037 and DK091207 (A.D.A.), and GM080148 (J.J.C.). A.E.M. gratefully acknowledges support from a National Institutes of Health-funded Genomic Sciences Training Program (5T32HG002760).
Footnotes
Supporting Information Available A supplemental figure describing sample preparation, an Excel spreadsheet showing theoretical calculations, and an Excel spreadsheet showing measured protein fold-changes in the mouse model are available online.
References
- 1.Hebert AS, Merrill AE, Bailey DJ, Still AJ, Westphall MS, Strieter ER, Pagliarini DJ, Coon JJ. Neutron-encoded mass signatures for multiplexed proteome quantification. Nat Methods. 2013 doi: 10.1038/nmeth.2378. [DOI] [PMC free article] [PubMed] [Google Scholar]
- 2.Sleno L. The use of mass defect in modern mass spectrometry. J Mass Spectrom. 2012;47:226–236. doi: 10.1002/jms.2953. [DOI] [PubMed] [Google Scholar]
- 3.Alvarez-Manilla G, Warren NL, Abney T, Atwood J, Azadi P, York WS, Pierce M, Orlando R. Tools for glycomics: relative quantitation of glycans by isotopic permethylation using (CH3I)-C-13. Glycobiology. 2007;17:677–687. doi: 10.1093/glycob/cwm033. [DOI] [PubMed] [Google Scholar]
- 4.Vincent CE, Potts GK, Ulbrich A, Westphall MS, Atwood JA, Coon JJ, Weatherly DB. Segmentation of Precursor Mass Range Using “Tiling” Approach Increases Peptide Identifications for MS1-Based Label-Free Quantification. Anal Chem. 2013;85:2825–2832. doi: 10.1021/ac303352n. [DOI] [PMC free article] [PubMed] [Google Scholar]
- 5.Hebert AS, Dittenhafer-Reed KE, Yu W, Bailey DJ, Selen ES, Boersma MD, Carson JJ, Tonelli M, Balloon AJ, Higbee AJ, Westphall MS, Pagliarini DJ, Prolla TA, Assadi-Porter F, Roy S, Denu JM, Coon JJ. Calorie Restriction and SIRT3 Trigger Global Reprogramming of the Mitochondrial Protein Acetylome. Mol Cell. 2013;49:186–199. doi: 10.1016/j.molcel.2012.10.024. [DOI] [PMC free article] [PubMed] [Google Scholar]
- 6.Angel PM, Orlando R. Quantitative carbamylation as a stable isotopic labeling method for comparative proteomics. Rapid Commun Mass Sp. 2007;21:1623–1634. doi: 10.1002/rcm.2990. [DOI] [PubMed] [Google Scholar]
- 7.Elias JE, Gygi SP. Target-decoy search strategy for increased confidence in large-scale protein identifications by mass spectrometry. Nat Methods. 2007;4:207–214. doi: 10.1038/nmeth1019. [DOI] [PubMed] [Google Scholar]
- 8.Geer LY, Markey SP, Kowalak JA, Wagner L, Xu M, Maynard DM, Yang X, Shi W, Bryant SH. Open mass spectrometry search algorithm. J Proteome Res. 2004;3:958–964. doi: 10.1021/pr0499491. [DOI] [PubMed] [Google Scholar]
- 9.Wenger CD, Phanstiel DH, Lee MV, Bailey DJ, Coon JJ. COMPASS: a suite of pre- and post-search proteomics software tools for OMSSA. Proteomics. 2011;11:1064–1074. doi: 10.1002/pmic.201000616. [DOI] [PMC free article] [PubMed] [Google Scholar]
- 10.Denisov E, Damoc E, Lange O, Makarov A. Orbitrap mass spectrometry with resolving powers above 1,000,000. Int J Mass Spectrom. 2012;325:80–85. [Google Scholar]
- 11.Swaney DL, Wenger CD, Coon JJ. Value of Using Multiple Proteases for Large-Scale Mass Spectrometry-Based Proteomics. J Proteome Res. 2010;9:1323–1329. doi: 10.1021/pr900863u. [DOI] [PMC free article] [PubMed] [Google Scholar]
- 12.Bantscheff M, Schirle M, Sweetman G, Rick J, Kuster B. Quantitative mass spectrometry in proteomics: a critical review. Anal Bioanal Chem. 2007;389:1017–1031. doi: 10.1007/s00216-007-1486-6. [DOI] [PubMed] [Google Scholar]
- 13.Kozawa S, Honda A, Kajiwara N, Takemoto Y, Nagase T, Nikami H, Okano Y, Nakashima S, Shimozawa N. Induction of peroxisomal lipid metabolism in mice fed a high-fat diet. Mol Med Rep. 2011;4:1157–1162. doi: 10.3892/mmr.2011.560. [DOI] [PubMed] [Google Scholar]
- 14.Sparks LM, Xie H, Koza RA, Mynatt R, Hulver MW, Bray GA, Smith SR. A high-fat diet coordinately downregulates genes required for mitochondrial oxidative phosphorylation in skeletal muscle. Diabetes. 2005;54:1926–1933. doi: 10.2337/diabetes.54.7.1926. [DOI] [PubMed] [Google Scholar]
- 15.Huang DW, Sherman BT, Lempicki RA. Systematic and integrative analysis of large gene lists using DAVID bioinformatics resources. Nat Protoc. 2009;4:44–57. doi: 10.1038/nprot.2008.211. [DOI] [PubMed] [Google Scholar]
Associated Data
This section collects any data citations, data availability statements, or supplementary materials included in this article.
Supplementary Materials
Sample preparation overview for carbamyl NeuCode method. Enzymatic digestion (a) of proteins is followed by labeling with heavy urea (b). Labeled peptides are mixed (c) and offline fractionation was undertaken (d). Finally, peptides were interrogated by LC-MS/MS (e+f)
Theoretical Calculations are shown in an Excel spreadsheet. Each of 36783 identified peptide spectral matches is categorized as quantifiable at FWTM or not depending on the resolving power, peptide mass, charge, and number of lysine residues. Results are presented in tabular and graphical form
An Excel table with all measured protein fold changes in response to high fat diet is given. A protein description, the number of peptides mapping to each protein, the Uniport Id(s), quantitative ratios, and total signal intensity are provided


