Abstract
A new method solely based on spatial Fourier analysis (SFA) was developed to completely determine a two dimensional (2D) anisotropic diffusion tensor in fibrous tissues using fluorescence recovery after photobleaching (FRAP). The accuracy and robustness of this method was validated by using computer simulated FRAP experiments. This method was applied to determine the region-dependent anisotropic diffusion tensor in porcine temporomandibular joint (TMJ) discs. The average characteristic diffusivity of 4kDa FITC-Dextran across the disc was 26.05±4.32μm2/s which is about 16% of its diffusivity in water. In the anteroposterior direction, the anterior region (30.99±5.93 μm2/s) had significantly higher characteristic diffusivity than the intermediate region (20.49±5.38μm2/s) and posterior region (20.97±2.46 μm2/s). The ratio of the two principal diffusivities represents the anisotropy of the diffusion and ranged between 0.45~0.51 (1.0=isotropic). Our results indicated that the solute diffusion in TMJ discs is inhomogenous and anisotropic. These findings suggested that diffusive transport in the TMJ disc is dependent upon tissue composition (e.g., water content) and structure (e.g., collagen orientation). This study provides a new method to quantitatively investigate the relationship between solute transport properties and tissue composition and structure.
Keywords: Fluorescence recovery after photobleaching (FRAP), Spatial Fourier analysis (SFA), Confocal laser scanning microscopy (CLSM), Anisotropic diffusion tensor, Temporomandibular joint (TMJ) disc
INTRODUCTION
The temporomandibular joint (TMJ) is a synovial, bilateral joint with unique morphology and function. The TMJ disc, a fibrocartilaginous tissue, is a major component of jaw function by providing stress distribution and lubrication in the joint.23, 24 Disc derangement (e.g., dislocation of the disc) is a common clinical finding in patients with TMJ disorders (affecting more than 10 million Americans).31 It has been suggested that degenerative processes predispose the disc to displacement and result in significant changes in disc morphology, biochemistry, function, and material properties.31, 32
The TMJ disc has a distinctive extracellular matrix (ECM) composition when compared to hyaline cartilage and other fibrocartilaginous tissues [e.g., the intervertebral disc (IVD)]. The TMJ disc is comprised primarily of water with a significant amount of collagen (mainly type I) and a very small amount of proteoglycan.4, 11, 21, 22, 29 The TMJ disc is a large avascular structure with human discs being wider mediolaterally than anteroposteriorly (approximately 19×13 mm).28 The nutrients required by disc cells for maintaining healthy matrix are supplied by synovial fluid at the margins of the disc, as well as from nearby blood vessels at the posterior bilaminar zone connection.7 Diffusive transport of nutrient solutes through the ECM plays a key role in maintaining the normal function of TMJ discs while the dysfunctional transport of those solutes is believed to contribute to the degeneration of the disc over time. Solute diffusivities in articular cartilage and IVD have been measured using a variety of techniques, including magnetic resonance imaging (MRI),10, 12 tracking the net movement of radiolabeled solutes,33, 34 and fluorescence27 or radiotracer desorption.17, 18 However, to our knowledge the solute diffusivities in the TMJ disc have not been determined. Moreover, differences in biochemical composition and structure distinguish the disc into three regions: the anterior band, intermediate zone, and posterior band.28 Collagen fibers in the anterior and posterior bands run primarily in the mediolateral direction, while in the intermediate zone these fibers run predominately in an anteroposterior direction.20 Studies have shown that the mechanical properties of the TMJ disc are region-dependent and anisotropic.7, 15 Therefore, it is reasonable to hypothesize that the solute diffusion in the TMJ disc is inhomogeneous and anisotropic. The objective of this study was to determine the region-dependent anisotropic diffusion tensor in TMJ discs using a new fluorescence recovery after photobleaching (FRAP) technique coupled with spatial Fourier analysis (SFA).
FRAP is a versatile and widely used tool for the determination of local diffusion properties within solutions, tissues, cells, and membranes.19 Due to the high spatial resolution, FRAP offers the possibility to microscopically examine a specific region of a sample. For instance, the site-specific (i.e., inhomogeneous) solute diffusion in articular cartilage has been previously studied using FRAP.9, 16 The basic principle of FRAP is based on photobleaching the fluorescence of molecular probes and analyzing the recovery of the bleached area.1, 13, 25 To date, most FRAP analyses are based on the method proposed by Axelrod et al. for isotropic diffusion.1 Another approach for FRAP analysis is based on the spatial Fourier analysis of the recovery images and has the advantage of potential detection of anisotropic diffusion.3, 14, 26, 30, 35, 38, 39 Tsay and Jacobson, using SFA of FRAP images, developed a method for the determination of a two-dimensional (2D) diffusion tensor along the fixed coordinate system.38 Most recently, Travascio et al. reported a method for calculating an anisotropic diffusion tensor based on two independent analyses of FRAP images: the Fourier transform (FT) and the Karhunen-Loeve transform (KLT).37 The KLT analysis of FRAP images could determine the principal direction of the diffusion tensor. By combining the FT and KLT analyses, all components of the anisotropic diffusion tensor can be solved for in a single FRAP experiment. This method has been used to characterize anisotropic diffusion in knee meniscus and intervertebral disc tissues.36, 37 In this paper, we propose a new method solely based on the SFA to completely determine the anisotropic diffusion tensor, avoiding all of the limitations imposed by KLT analysis.
In this paper, we first discuss the theoretical basis of this new analysis. Next, we apply this analysis to computer simulated anisotropic FRAP experiments to validate the method, as well as make a comparison to the method proposed by Travascio et al. in terms of accuracy and robustness. And finally, we apply this analysis to characterize anisotropic solute diffusion in different regions of the TMJ disc using the new FRAP technique.
THEORY
Diffusional transport is governed by Fick’s second law and in two dimensions, the partial differential equation becomes:6
| (1) |
where (x, y) are the spatial coordinates of the imaging system and t is the time. The function C(x, y,t) represents the spatial concentration distribution of solutes in the x-y plane and D is the diffusion tensor which is assumed symmetric. Within the small observation field of FRAP experiments, it is assumed that the diffusion tensor (D) is independent of position and time. Therefore, Equation (1) could be rewritten as:30
| (2) |
where Dxx, Dxy, and Dyy are components of diffusion coefficient tensor (D) in the (x,y) coordinate system.
Given that is the Fourier transform of C(x, y,t) , with an arbitrary initial condition and a boundary condition that C(x, y,t) is a constant as (x, y) → ±∞, Equation (2) can be solved by using 2D SFA in the frequency domain:3, 30, 35, 37, 38
| (3) |
where is the initial solute concentration and D(u,v) represents the diffusion coefficient in Fourier space (with frequencies u and v) and is defined as:
| (4) |
The function D(u,v) can be determined by curve fitting the light intensity of a time series of fluorescence recovery images (in the Fourier space) to Equation (3).
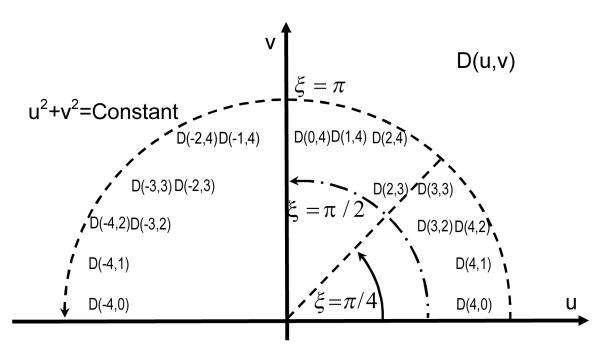
The average of D(u,v) over the arc of a circumference (Integral curve L: u2 + v2 = a2 , a is an arbitrary constant, see Figure 1) over an angle range from α to β can be given as:
| (5) |
The auxiliary variable ξ is a function of the frequencies u and v:35, 37, 38
| (6) |
Based on Equation (5), the average of D(u,v) over the arc from 0 to π can be related to the components of the diffusion tensor D as:35, 37
| (7) |
Similarly, the average of D(u,v) over the arc from 0 to π/2 can be calculated as:37
| (8) |
The average of D(u,v) over the arc from 0 to can be calculated as:
| (9) |
Figure 1.
| (15) |
According to Equations (7), (8) and (9), all components of the diffusion tensor (i.e., Dxx , Dyy and Dxy ) can be obtained and expressed as the functions of and D0,π:
| (10) |
Using all components of the diffusion tensor two principal diffusivities (eigenvalues) of the 2D diffusion tensor can be calculated by:
| (11) |
where DEig_Min is the relatively smaller of the two eigenvalues and DEig_Max is the relatively larger one. The ratio of DEig_Min to DEig_Max can be used to represent the anisotropy of the diffusion.
MATERIALS AND METHODS
Computer Simulation of Anisotropic FRAP Experiment
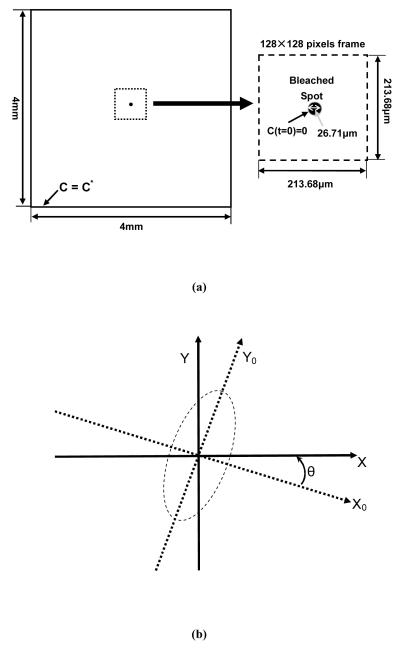
The 2D anisotropic diffusion process of the fluorescent molecule recovery after photobleaching was simulated using finite element analysis software (COMSOL Multiphysics 3.4, COMSOL Inc., Burlington, MA). At the boundaries of the sample (i.e., simulation domain, 4×4mm2), the concentration of the fluorescent molecules satisfied the constancy assumption (C=C*). Initially, the concentration distribution of fluorescent molecules was assumed to be uniform (C=C*) outside the photobleached spot and zero within the photobleached area. The diameter of the bleached area was set to 26.71μm according to the optimum value of 8 for the ratio of the imaging frame size (213.68μm) to the initial diameter of the bleached spot as suggested by Travascio and Gu.37 The mesh used in the simulation experiments included 8,784 quadratic Lagrange triangular elements. The convergence criterion for the solution was the relative error tolerance of less than 0.001. The simulation was stopped when the concentration in the bleached spot reached 95% of C*. For data analysis purposes, an image sequence containing 101 frames (0.6s/frame) representing the FRAP experiment was extracted from the central region of the simulation domain and digitalized to 128pixels×128pixels (Figure 2a). The frame size was set to 213.68×213.68μm2, which was used in the following TMJ disc FRAP experiment.
Figure 2.
(a) The computational domain with the initial and boundary conditions for FRAP simulation experiments. (b) The orientation of pre-defined anisotropic diffusion tensor generated using various rotation angles. θ is the rotation angle from the principal diffusion tensor coordinate (X0, Y0) to the observed diffusion tensor coordinate (X, Y).
Three groups of anisotropic diffusion were investigated in the simulation experiments and there were seven pre-defined diffusion tensors in each group. In the first group, a base diffusion tensor of was selected and rotated at seven different angles θi,i = 0 ~ 6 (θ0~6 =0, π/8, π/6, π/4, π/3, 3π/8, and π/2) using a rotation matrix Ri defined as:
| (12) |
The seven pre-defined diffusion tensors, see Figure 2b, were calculated by:
| (13) |
In the second and third group, the base diffusion tensors were and , respectively. The computer simulations of these three groups allowed investigation into the effects of anisotropy and orientation of the diffusion tensors on the accuracy of the new SFA based FRAP data analysis.
To study the effect of experimental noise on this anisotropic FRAP data analysis photon noise was added to the ideal simulated FRAP images. Although photon noise has a Poisson distribution, for large photon fluxes (e.g., during FRAP experiments) Gaussian noise represents a close approximation of Poisson noise.5 Similarly to previous studies,37, 38, 39 different magnitudes of Gaussian noise were added to the purely simulated recovery images to estimate how image noise affected the analysis. The magnitude of the Gaussian noise was characterized by its standard deviation, σ. Two magnitudes of spatial Gaussian noise (i.e., σ = 5 and 10) were generated by ImageJ software (Version 1.39f, by Wayne Rasband, National Institutes of Health, USA) and were then superimposed onto the simulated recovery images. For each level of σ investigated, ten FRAP experiments were simulated.
FRAP Experiment on Porcine TMJ Disc
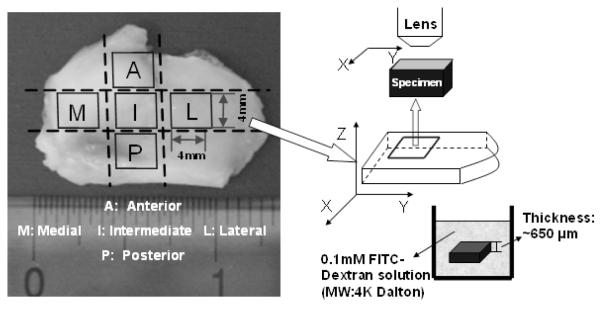
Nine fresh porcine TMJ discs from five young adult pigs (~8-10 months) were used for testing. Razor blades were used to prepare tissue slices from the intermediate, posterior, anterior, lateral, and medial regions of the discs (Figure 3). One tissue slice (about 4×4mm2) was obtained from each region. The final specimens with ~650μm thickness were obtained from each tissue slice using a microtome (SM24000, Leica Microsystems GmbH, Wetzlar, Germany) with a freezing stage (Model BFS-30, Physitemp, Clifton, NJ). The tissue slice was microtomed on both inferior and superior surfaces to remove the natural concave shape of the tissue to maintain a flat cartilage surface for the FRAP experiment. Diffusion tensors for FITC-dextran molecules with a molecular weight of 4kDa (FD4, λex 490 nm; λem 520 nm, Sigma-Aldrich®, St. Louis, MO, USA) were measured with FRAP in the horizontal X-Y plane in Figure 3 (parallel to the surface of the TMJ disc). Correspondingly, the three components (i.e., Dxx, Dyy and Dxy) and two principal diffusivities ( DEig_Min and DEig_Max ) of the anisotropic diffusion tensor were obtained from the FRAP experiment.
Figure 3.
The schematic of FRAP experiments on porcine TMJ discs. Tissue specimens were prepared from the anterior, posterior, intermediate, lateral, and medial regions of the discs. The diffusion tensor of 4kDa FITC-Dextran was measured with FRAP in the horizontal X-Y plane (parallel to the surface of the TMJ disc).
Specimens were immersed in FITC-Dextran solution (0.1mM) for 48 hours (tissue swelling was not significant), to allow the concentration distribution of fluorescent solutes to reach equilibrium throughout the tissue. The FRAP experiment was performed on a Leica TCS-SP2 Confocal Microscope System (Leica Microsystems, Inc., Exton, PA) at room temperature (22°C). The specimen was photobleached using an Ar-488nm laser to create a circular bleached spot with a diameter about 27μm. A Multi-Layer Bleaching (MLB) protocol was used to ensure a 2D fluorescent recovery in the X-Y plane by minimizing the diffusion in the Z-direction along the thickness of the specimen.35 The depth of the bleaching spot was about 70μm from the surface into the specimen and fluorescence recovery was observed on the focal plan at 7μm beneath the surface of the specimen. A HC PlanAPO 20×/0.7NA dry objective (Leica Microsystems, Inc., Exton, PA) was used to collect fluorescent recovery images of 128 ×128 pixels (213.68 ×213.68μm2). For each experiment, 100 frames of recovery images, plus 5 images prior to bleaching, were acquired at a rate of 0.6s per frame. To minimize the contribution of the fluorescence emission of the background, pre-bleaching images were averaged and then subtracted from the post-bleaching image series.
Images and Data Processing
For both computer simulated and experimental FRAP tests, the image processing was completed using custom written codes in MATLAB (MATLAB 7.0, The MathWorks Inc., Natick, MA). Based on Equation (3), the code performed a 2-dimensional Fourier Transform and nonlinear curve-fit to yield solutions for D(u,v), which was the diffusion coefficient in the frequency domain. Based on Equation (5), averaging D(u, v) on ‘Ring 4’ over different angle ranges generated D0,π, and . The selection of Ring 4 was suggested by previous studies,37 and the frequency couples (u,v) for Ring 4 are shown in Figure 1. Using Equation (10), the code calculated all components of the diffusion tensor: Dxx , Dyy and Dxy . Finally, the calculation of the principal diffusivities, DEig_Min and DEig_Max , were completed according to Equation (11). The average values, as well as the ratio of the two principal diffusivities for each specimen were determined.
Statistical Analysis
An independent t-test was performed on the principal diffusivities, DEig_Min and DEig_Max , to examine the anisotropy of solute diffusion in each disc region. One-way ANOVA and Tukey’s post hoc tests were performed on the average diffusivities to examine the regional effect on the diffusion rate in porcine TMJ discs. This effect was also examined through the ratio of the principal diffusivities. SPSS 16.0 software (SPSS Inc., Chicago, IL) was used for all statistical analysis and significant differences were reported at p-values < 0.05.
RESULTS
Validation Using Computer Simulated FRAP Experiments
2D anisotropic FRAP experiments were simulated by using pre-defined components of the anisotropic diffusion tensor. Numerically simulated FRAP digital images were transformed into the frequency domain using SFA. The principal diffusivities of the anisotropic diffusion process were calculated based on our proposed method. The accuracy of the new method was assessed by the relative error (ε) which is defined as:37
| (14) |
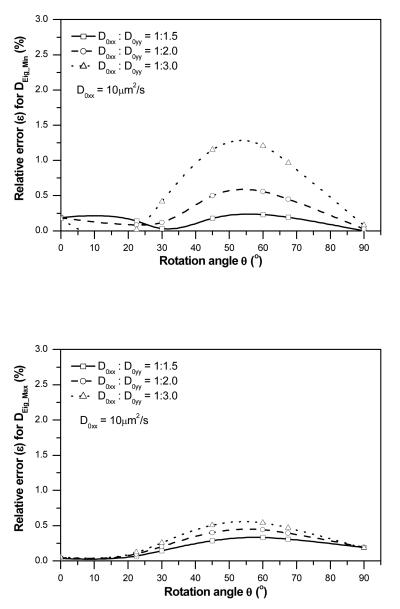
The effects of anisotropic ratio (D0xx/D0yy) and diffusion tensor orientation (θ) on the accuracy of the new method were evaluated. The relative errors (ε) of the two principal diffusivities for three different anisotropic ratios (D0xx:D0yy=1:1.5, 1:2.0 and 1:3.0) with seven diffusion tensor orientations (θ = 0~π/2) are shown in Figure 4. Overall, the relative errors of DEig_Min were less than 1.5% for all simulated cases (Figure 4a), while the relative errors of DEig_Max were less than 1% (Figure 4b). This result indicated that the accuracy of the new method was not significantly sensitive to D0xx:D0yy and θ. The highest accuracy was achieved when the diffusion tensors were oriented in alignment with the axes of the coordinate system (i.e., θ = 0 or π/2). The accuracy slightly decreased when the orientation of the diffusion tensor deviated from the axes of the coordinate system. The accuracy of this method increased when the anisotropic ratio (D0xx:D0yy) decreased.
Figure 4.
Effects of the orientation (θ) and anisotropic ratio (D0xx/D0yy) of the diffusion tensor on the relative error (ε) for the determination of (a) DEig_Min and (b) DEig_Max .
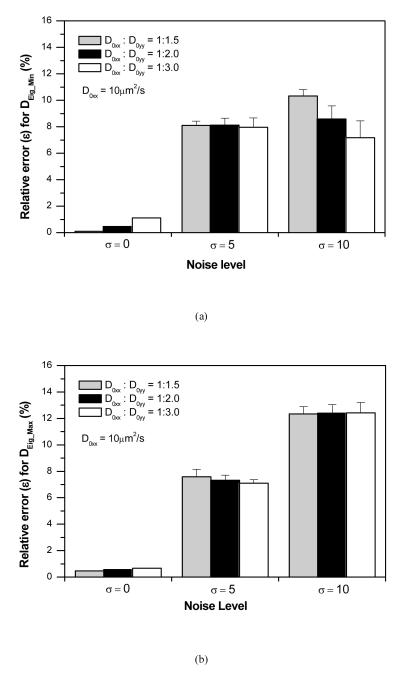
The effects of imaging noise (σ) on the accuracy of the new method were also investigated for the cases of D0xx:D0yy=1:1.5, 1:2.0 and 1:3.0, with θ = π/4. The typical FRAP images with and without spatial Gaussian noise (σ = 0, 5, 10) as well as the corresponding curve-fits to determine D(u, v) are shown in Figure 5. The relative errors of the two principal diffusivities increased with increasing σ. The average relative errors were less than 8% at σ = 5, while the average values were less than 12.5% at σ = 10 (Figure 6). In this study, the accuracy of the new method was not sensitive to the anisotropic ratio.
Figure 5.
Effect of the imaging noise on the determination of the D(u, v). (a) Typical computer simulated FRAP images without and with spatial Gaussian noise (σ = 0, 5, 10). (b) Typical curve-fits to determine D(4,4) for the simulated FRAP image sequences without and with spatial Gaussian noise (σ = 0, 5, 10).
Figure 6.
Effect of the imaging noise on the precision of determined diffusion tensors with different anisotropy: (a) The relative error (ε) for DEig_Min and (b) the relative error (ε) for DEig_Max .
FRAP Experiments on Porcine TMJ Discs
The two principal diffusivities of the 2D anisotropic diffusion tensor of 4kDa FTIC-Dextran in the five regions of porcine TMJ disc were determined using our new method and listed in Table 1. The characteristic diffusivity defined as (DEig_Min + DEig_Max)/2 was calculated to represent the average solute diffusion rate in each disc region. The ratio of DEig_Min to DEig_Max was also calculated to evaluate the anisotropy of solute diffusion in the disc.
Table 1.
The results (mean±SD) of the diffusion tensor of 4kDa FTIC-Dextran in the five regions of porcine TMJ discs. DEig_Min and DEig_Max are the two principal diffusivities of the diffusion tensor. (DEig_Min + DEig_Max)/2 is the characteristic diffusivity that represents the averaged solute diffusion rate in each disc region. DEig_Min/DEig_Max was calculated to evaluate the anisotropy of solute diffusion in each disc region.
| Anterior | Medial | Intermediate | Lateral | Posterior | Average | |
|---|---|---|---|---|---|---|
| DEig_Min (μm2/s) | 18.32±4.18 | 17.10±4.72 | 13.57±3.97 | 15.61±4.28 | 13.37±4.15 | 15.75±1.56 |
| DEig_Max (μm2/s) | 43.67±11.39 | 35.92±8.95 | 27.40±8.31 | 37.80±11.95 | 28.58±5.90 | 36.35±8.66 |
| DEig_Min + DEig_Max/2 (μm2/s) | 30.99±5.93 | 26.51±6.30 | 20.49±5.38 | 26.71±5.50 | 20.97±2.46 | 26.05±4.32 |
| DEig_Min/DEig_Max | 0.45±0.17 * | 0.48±0.10 * | 0.51±0.14 * | 0.47±0.24 * | 0.49±0.18 * | 0.47±0.12 |
( DEig_Max was significantly larger than DEig_Min in each region, p< 0.05).
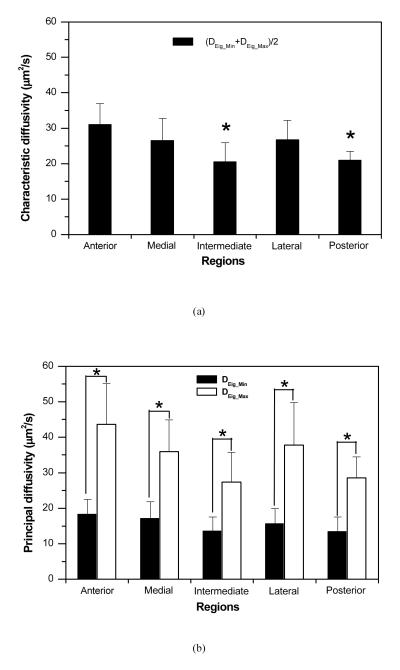
The average characteristic diffusivity across the disc was 26.05±4.32 μm2/s. Regional differences in characteristic diffusivity were observed in the anteroposterior and mediolateral directions (Figure 7a). In the anteroposterior direction, the anterior region (30.99±5.93 μm2/s) had significantly higher characteristic diffusivity than the intermediate region (20.49±5.38μm2/s, p<0.0003) and posterior region (20.97±2.46 μm2/s, p<0.00005). In the mediolateral direction, the medial region (26.51±6.30μm2/s) and lateral region (26.71±5.50μm2/s) had higher characteristic diffusivities than the intermediate region, although this trend was not statistically significant.
Figure 7.
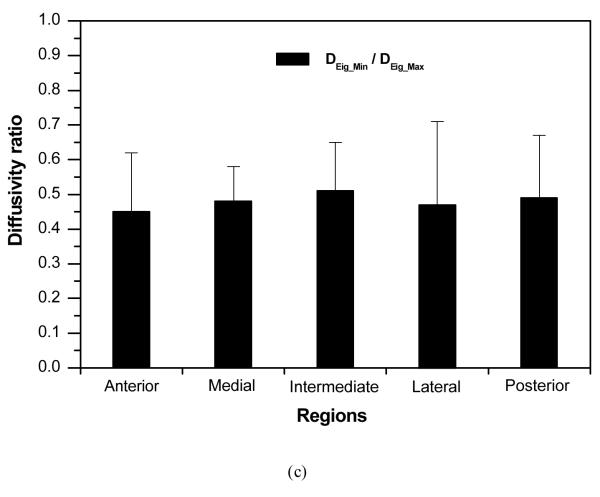
The results of statistical analysis of determined diffusion tensors in porcine TMJ disc. (a) Characteristic diffusivities [(DEig_Min + DEig_Max)/2] were significantly region-dependent (*p<0.05 compared to Anterior). (b) Significant differences between DEig_Min and DEig_Max were detected in all disc regions (*p<0.05). (c) The ratio of DEig_Min to DEig_Max was not region-dependent.
Figure 7b showed that there was a significant difference between DEig_Min and DEig_Max in each disc region (p<0.001). The ratio of DEig_Min to DEig_Max was approximately 0.45~0.51 (with 1.0 indicating isotropic) across the disc without significant regional differences (Figure 7c). These results indicated that the diffusion of 4kDa FTIC-Dextran was highly anisotropic in the porcine TMJ disc.
DISCUSSION
In this study, a new method solely based on the SFA of FRAP images was developed to completely determine the anisotropic diffusion tensor in hydrated soft tissues. This method was used to determine the region-dependent anisotropic diffusion tensor in porcine TMJ discs.
The accuracy and robustness of our new method was validated by the computer simulated FRAP experiments. Our method demonstrated several key advantages over the previous studies on the SFA based FRAP methods for anisotropic diffusion. Most of all, it makes possible to deal with any orientation of the diffusion tensor (θ = 0-π/2). The complete diffusion tenor, including both diagonal and off-diagonal components, can be determined using this new method.
Compared to the method recently reported by Travascio et al.,37 our method is more accurate and robust. In their method, an anisotropic diffusion tensor was determined based on two independent analyses of FRAP images: the Fourier transform and the Karhunen-Loeve transform. The KLT analysis of FRAP images can determine the orientation of the diffusion tensor and by combining the FT and KLT analyses, Travascio’s method can determine all components of the anisotropic diffusion tensor in a single FRAP experiment. In this study, we proposed a method solely based on the SFA to completely determine the anisotropic diffusion tensor which avoids all of the limitations imposed by KLT analysis. For example, due to the limitations of the KLT the Travascio’s method is not applicable when the orientation of the diffusion tensor coincides with the fixed coordinate system (i.e., θ = 0 or π/2).37 More importantly, the major limitation of their method, as recognized by the authors, is the robustness to deal with the imaging noise which is unavoidable in real experiments. In their simulation results the average relative errors reached 40% at σ = 10 noise level, while the average values reached 20% at σ = 5 level.37 Under the same noise conditions the average relative errors of our method were less than 12.5% at σ = 10 level and less than 8% at σ = 5 level. It is apparent that our new method is more robust against the noise and our method only needs one image analysis (i.e., the SFA) resulting in fewer numerical errors for the determination of the diffusion tensor. In our simulation without imaging noise, the relative errors of DEig_Min were less than 1.5% (Figure 4a) while under the similar conditions, the relative errors reached 14% in simulations performed by Travascio et al.37 In the above accuracy comparison, it needs to be noted that the sizes of the bleaching spot and imaging frame in this study were only about half the values of those parameters used in the study by Travascio et al.37 This implies that the imaging sampling might also affect the precision of the results.
This study represents the first measurement of solute diffusion in TMJ disc tissues. The average diffusivity of 4kDa FITC-Dextran in porcine TMJ discs (26 μm2/s) was approximately 16% of the diffusivity in water (162 μm2/s, based on the Stokes-Einstein equation with the hydraulic radius of 1.4nm) and was comparable to the diffusivity of the similar sized solute (3kDa FITC-Dextran) in porcine articular cartilage (75μm2/s) measured by FRAP.16 Most recently, Benavides et al. reported that there is a region-dependency of water diffusion in porcine TMJ disc using diffusion tensor MRI.2 In the anteroposterior direction, the mean water diffusivity was higher in the anterior and posterior bands compared with the intermediate zone. In the mediolateral direction, the mean water diffusivity was higher in the medial and lateral aspects than in the center. Our study of 4kDa FITC-Dextran diffusion showed exactly the same trends.
The results of this study indicated that the diffusion rates of uncharged dextran molecules vary by region in the TMJ disc. The anterior region had higher characteristic diffusivity than the intermediate region and posterior region in the anteroposterior direction, while the medial and lateral regions had higher characteristic diffusivities than the intermediate region in the mediolateral direction. Previous studies showed that solute diffusivity in cartilaginous tissues depended on tissue water content in a manner that a decrease in the solute diffusivity occurs as tissue water content decreased,9, 35, 37 and these findings were also observed in our study. For the porcine TMJ disc, it has been reported that along the anteroposterior axis, the anterior band (74.5±2.9%) had higher water content than the intermediate zone (73.7±3.1%) and posterior band (70.1±4.0%), while along the mediolateral axis, the medial region (75.3±2.1%) had a higher water content than the central (71.3±3.7%) and lateral (71.3±4.1%) regions.8 The correlation between the diffusivity and tissue water content suggests that the diffusive transport in porcine TMJ discs is dependent on tissue composition. The inhomogeneous distribution of tissue components results in region-dependent diffusivity in TMJ disc tissues.
The results of this study also demonstrated that solute diffusive transport in porcine TMJ discs is highly anisotropic with the ratio of DEig_Min to DEig_Max around 0.45~0.51 across the disc. Studies on meniscus and annulus fibrosus showed that the anisotropic solute diffusion in fibrocartilage is due to the orientation of collagen fibers.36, 37 The orientation of the largest principal component ( DEig_Max ) of the diffusion tensor is parallel to the direction of the bundles of collagen fibers, while the smallest principal component ( DEig_Min ) is perpendicular to the fibers. Inside the porcine TMJ disc, Detamore et al. reported that collagen fibers were well organized and had a ring-like structure around the periphery and were oriented anteroposteriorly through the intermediate zone.8 Our results suggested that the diffusive transport in TMJ disc is not only dependent upon tissue composition but also tissue structure, especially collagen structure.
In this study, we measured diffusivities of 4kDa FTIC-Dextran (hydraulic radius equivalent to insulin)16 to examine the region-dependent anisotropic diffusion in porcine TMJ discs. However, it is important to note that the dextran molecules have a linear structure that may not duplicate the molecular structure of other physiologically relevant molecules in the TMJ disc, which may be more globular in structure. Pluen et al. have shown that flexible macromolecules have greater mobility than similarly sized globular molecules in a random fiber matrix.26 It is also important to note that the diffusion tensor was determined in the horizontal plane in this study. The diffusion in the vertical direction (i.e., superior-inferior direction) could be the main pathway for nutrient transport through the TMJ disc. Therefore, in order to fully understand solute transport in the TMJ disc, it is necessary to determine the 3D diffusion tensor in each disc region and correlate it to tissue composition and structure.
In summary, a new method solely based on the SFA has been developed to determine the 2D anisotropic solute diffusion tensor in the fibrous tissues using FRAP. The accuracy and robustness of this method was validated using computer simulated FRAP experiments. The new method was applied to determine the 2D diffusion tensor of 4kDa FITC-Dextran in the porcine TMJ discs. It was determined that the diffusion of this solute in TMJ discs was inhomogeneous and anisotropic. These findings suggested that diffusive transport in TMJ disc is dependent upon tissue composition (e.g., water content) and structure (e.g., collagen orientation). This study provides a new method to quantitatively investigate the relationship between transport properties and tissue composition and structure. The obtained transport properties are crucial for future development of numerical models studying nutritional supply within the TMJ disc.
ACKNOWLEGEMENTS
This project was supported by NIH grants DE018741, RR017696, and AR055775, a NSF RII grant fellowship (EPS-00903795) to CS, and a NIH T32 training grant DE017551 to JK.
REFERENCES
- 1.Axelrod D, Koppel DE, Schlessinger J, Elson E, Webb WW. Mobility measurement by analysis of fluorescence photobleaching recovery kinetics. Biophys J. 1976;16:1055–1069. doi: 10.1016/S0006-3495(76)85755-4. [DOI] [PMC free article] [PubMed] [Google Scholar]
- 2.Benavides E, Bilgen M, Al-Hafez B, Alrefae T, Wang Y, Spencer P. High-resolution magnetic resonance imaging and diffusion tensor imaging of the porcine temporomandibular joint disc. Dentomaxillofac Radiol. 2009;38:148–155. doi: 10.1259/dmfr/19195745. [DOI] [PubMed] [Google Scholar]
- 3.Berk DA, Yuan F, Leunig M, Jain RK. Fluorescence photobleaching with spatial Fourier analysis: measurement of diffusion in light-scattering media. Biophys J. 1993;65:2428–2436. doi: 10.1016/S0006-3495(93)81326-2. [DOI] [PMC free article] [PubMed] [Google Scholar]
- 4.Berkovitz BK, Robertshaw H. Ultrastructural quantification of collagen in the articular disc of the temporomandibular joint of the rabbit. Arch Oral Biol. 1993;38:91–95. doi: 10.1016/0003-9969(93)90161-e. [DOI] [PubMed] [Google Scholar]
- 5.Bevington PR. Data reduction and error analysis for the physical sciences. McGraw-Hill; New York: 1969. p. 36. [Google Scholar]
- 6.Crank J. The mathematics of diffusion. Clarendon Press; Oxford: 1975. p. 5. [Google Scholar]
- 7.Detamore MS, Athanasiou KA. Structure and function of the temporomandibular joint disc: implications for tissue engineering. J Oral Maxillofac Surg. 2003;61:494–506. doi: 10.1053/joms.2003.50096. [DOI] [PubMed] [Google Scholar]
- 8.Detamore MS, Orfanos JG, Almarza AJ, French MM, Wong ME, Athanasiou KA. Quantitative analysis and comparative regional investigation of the extracellular matrix of the porcine temporomandibular joint disc. Matrix Biol. 2005;24:45–57. doi: 10.1016/j.matbio.2004.11.006. [DOI] [PMC free article] [PubMed] [Google Scholar]
- 9.Fetter NL, Leddy HA, Guilak F, Nunley JA. Composition and transport properties of human ankle and knee cartilage. J Orthop Res. 2006;24:211–219. doi: 10.1002/jor.20029. [DOI] [PubMed] [Google Scholar]
- 10.Fischer AE, Carpenter TA, Tyler JA, Hall LD. Visualisation of mass transport of small organic molecules and metal ions through articular cartilage by magnetic resonance imaging. Magn Reson Imaging. 1995;13:819–826. doi: 10.1016/0730-725x(95)00040-n. [DOI] [PubMed] [Google Scholar]
- 11.Gage JP, Virdi AS, Triffitt JT, Howlett CR, Francis MJ. Presence of type III collagen in disc attachments of human temporomandibular joints. Arch Oral Biol. 1990;35:283–288. doi: 10.1016/0003-9969(90)90044-b. [DOI] [PubMed] [Google Scholar]
- 12.Hsu EW, Setton LA. Diffusion tensor microscopy of the intervertebral disc anulus fibrosus. Magn Reson Med. 1999;41:992–999. doi: 10.1002/(sici)1522-2594(199905)41:5<992::aid-mrm19>3.0.co;2-y. [DOI] [PubMed] [Google Scholar]
- 13.Jacobson K, Derzko Z, Wu ES, Hou Y, Poste G. Measurement of the lateral mobility of cell surface components in single, living cells by fluorescence recovery after photobleaching. J Supramol Struct. 1976;5:565(417)–576(428). doi: 10.1002/jss.400050411. [DOI] [PubMed] [Google Scholar]
- 14.Jacobson K, Zhang F, Tsay TT. Fluorescence recovery after photobleaching techniques to measure translational mobility in microscopic samples. Scanning Microsc. 1991;5:357–361. [PubMed] [Google Scholar]
- 15.Kuo J, Zhang L, Bacro T, Yao H. The region-dependent biphasic viscoelastic properties of human temporomandibular joint discs under confined compression. J Biomech. 2010;43:1316–1321. doi: 10.1016/j.jbiomech.2010.01.020. [DOI] [PMC free article] [PubMed] [Google Scholar]
- 16.Leddy HA, Guilak F. Site-specific molecular diffusion in articular cartilage measured using fluorescence recovery after photobleaching. Ann Biomed Eng. 2003;31:753–760. doi: 10.1114/1.1581879. [DOI] [PubMed] [Google Scholar]
- 17.Maroudas A. Distribution and diffusion of solutes in articular cartilage. Biophys J. 1970;10:365–379. doi: 10.1016/S0006-3495(70)86307-X. [DOI] [PMC free article] [PubMed] [Google Scholar]
- 18.Maroudas A. Biophysical chemistry of cartilaginous tissues with special reference to solute and fluid transport. Biorheology. 1975;12:233–248. doi: 10.3233/bir-1975-123-416. [DOI] [PubMed] [Google Scholar]
- 19.Meyvis TK, De Smedt SC, Van Oostveldt P, Demeester J. Fluorescence recovery after photobleaching: a versatile tool for mobility and interaction measurements in pharmaceutical research. Pharm Res. 1999;16:1153–1162. doi: 10.1023/a:1011924909138. [DOI] [PubMed] [Google Scholar]
- 20.Minarelli AM, Del Santo M, Junior, Liberti EA. The structure of the human temporomandibular joint disc: a scanning electron microscopy study. J Orofac Pain. 1997;11:95–100. [PubMed] [Google Scholar]
- 21.Nakano T, Scott PG. A quantitative chemical study of glycosaminoglycans in the articular disc of the bovine temporomandibular joint. Arch Oral Biol. 1989;34:749–757. doi: 10.1016/0003-9969(89)90082-4. [DOI] [PubMed] [Google Scholar]
- 22.Nakano T, Scott PG. Changes in the chemical composition of the bovine temporomandibular joint disc with age. Arch Oral Biol. 1996;41:845–853. doi: 10.1016/s0003-9969(96)00040-4. [DOI] [PubMed] [Google Scholar]
- 23.Nickel JC, McLachlan KR. In vitro measurement of the frictional properties of the temporomandibular joint disc. Arch Oral Biol. 1994;39:323–331. doi: 10.1016/0003-9969(94)90124-4. [DOI] [PubMed] [Google Scholar]
- 24.Nickel JC, McLachlan KR. In vitro measurement of the stress-distribution properties of the pig temporomandibular joint disc. Arch Oral Biol. 1994;39:439–448. doi: 10.1016/0003-9969(94)90175-9. [DOI] [PubMed] [Google Scholar]
- 25.Peters R, Peters J, Tews KH, Bahr W. A microfluorimetric study of translational diffusion in erythrocyte membranes. Biochim Biophys Acta. 1974;367:282–294. doi: 10.1016/0005-2736(74)90085-6. [DOI] [PubMed] [Google Scholar]
- 26.Pluen A, Netti PA, Jain RK, Berk DA. Diffusion of macromolecules in agarose gels: comparison of linear and globular configurations. Biophys J. 1999;77:542–552. doi: 10.1016/S0006-3495(99)76911-0. [DOI] [PMC free article] [PubMed] [Google Scholar]
- 27.Quinn TM, Morel V, Meister JJ. Static compression of articular cartilage can reduce solute diffusivity and partitioning: implications for the chondrocyte biological response. J Biomech. 2001;34:1463–1469. doi: 10.1016/s0021-9290(01)00112-9. [DOI] [PubMed] [Google Scholar]
- 28.Rees LA. The structure and function of the mandibular joint. British Dental Journal. 1954;96:125–133. [Google Scholar]
- 29.Sindelar BJ, Evanko SP, Alonzo T, Herring SW, Wight T. Effects of intraoral splint wear on proteoglycans in the temporomandibular joint disc. Arch Biochem Biophys. 2000;379:64–70. doi: 10.1006/abbi.2000.1855. [DOI] [PubMed] [Google Scholar]
- 30.Smith BA, Clark WR, McConnell HM. Anisotropic molecular motion on cell surfaces. Proc Natl Acad Sci U S A. 1979;76:5641–5644. doi: 10.1073/pnas.76.11.5641. [DOI] [PMC free article] [PubMed] [Google Scholar]
- 31.Stegenga B. Osteoarthritis of the temporomandibular joint organ and its relationship to disc displacement. J Orofac Pain. 2001;15:193–205. [PubMed] [Google Scholar]
- 32.Stegenga B, de Bont LG, Boering G. Osteoarthrosis as the cause of craniomandibular pain and dysfunction: a unifying concept. J Oral Maxillofac Surg. 1989;47:249–256. doi: 10.1016/0278-2391(89)90227-9. [DOI] [PubMed] [Google Scholar]
- 33.Torzilli PA. Effects of temperature, concentration and articular surface removal on transient solute diffusion in articular cartilage. Med Biol Eng Comput. 1993;31(Suppl):S93–98. doi: 10.1007/BF02446656. [DOI] [PubMed] [Google Scholar]
- 34.Torzilli PA, Arduino JM, Gregory JD, Bansal M. Effect of proteoglycan removal on solute mobility in articular cartilage. J Biomech. 1997;30:895–902. doi: 10.1016/s0021-9290(97)00059-6. [DOI] [PubMed] [Google Scholar]
- 35.Travascio F, Gu WY. Anisotropic diffusive transport in annulus fibrosus: experimental determination of the diffusion tensor by FRAP technique. Ann Biomed Eng. 2007;35:1739–1748. doi: 10.1007/s10439-007-9346-2. [DOI] [PMC free article] [PubMed] [Google Scholar]
- 36.Travascio F, Jackson AR, Brown MD, Gu WY. Relationship between solute transport properties and tissue morphology in human annulus fibrosus. J Orthop Res. 2009;27:1625–1630. doi: 10.1002/jor.20927. [DOI] [PMC free article] [PubMed] [Google Scholar]
- 37.Travascio F, Zhao W, Gu WY. Characterization of anisotropic diffusion tensor of solute in tissue by video-FRAP imaging technique. Ann Biomed Eng. 2009;37:813–823. doi: 10.1007/s10439-009-9655-8. [DOI] [PMC free article] [PubMed] [Google Scholar]
- 38.Tsay TT, Jacobson KA. Spatial Fourier analysis of video photobleaching measurements. Principles and optimization. Biophys J. 1991;60:360–368. doi: 10.1016/S0006-3495(91)82061-6. [DOI] [PMC free article] [PubMed] [Google Scholar]
- 39.Wirth MJ. Frequency domain analysis for fluorescence recovery after photobleaching. Appl Spectrosc. 2006;60:89–94. doi: 10.1366/000370206775382794. [DOI] [PubMed] [Google Scholar]


