Abstract
Astrocytes have emerged as active participants of synaptic transmission and are increasingly implicated in neurological disorders including epilepsy. Adult glial fibrillary acidic protein (GFAP)-positive hippocampal astrocytes are not known for ionotropic glutamate receptor expression under basal conditions. Using a chemoconvulsive status epilepticus (SE) model of temporal lobe epilepsy, we show by immunohistochemistry and colocalization analysis that reactive hippocampal astrocytes express kainate receptor (KAR) subunits following SE. In the CA1 region, GluK1, GluK2/3, GluK4, and GluK5 subunit expression was observed in GFAP-positive astrocytes during the seizure free or “latent” period 1 week following SE. At 8 weeks following SE, a time following SE when spontaneous behavioral seizures occur, the GluK1 and GluK5 subunits remained expressed at significant levels. KAR subunit expression was found in astrocytes in the hippocampus and surrounding cortex, but not in GFAP-positive astrocytes of striatum, olfactory bulb, or brainstem. To examine hippocampal KAR expression more broadly, astroglial-enriched tissue fractions were prepared from dissected hippocampi and were found to have greater GluK4 expression following SE than controls. These results demonstrate that astrocytes begin to express KARs following seizure activity and suggest that their expression may contribute to the pathophysiology of epilepsy.
Keywords: Astrogliosis, Epilepsy, Glutamate receptor, Kainic acid
INTRODUCTION
Temporal lobe epilepsy (TLE) is one of the most common acquired seizure disorders. It is often unresponsive to anti-seizure drugs, increases in severity over time, and can result in cognitive decline (1–3). TLE is associated with neuronal cell death and pronounced astrogliosis that is characterized by hypertrophy of astrocyte primary processes with concomitant disruption in domain organization, increases in the expression of intermediate filament proteins such as glial fibrillary acidic protein (GFAP), and changes in expression of a variety of proteins essential for proper astrocyte function (4–6). While numerous studies have focused on the role of neurons in contributing to seizure generation in models of TLE, the contribution of astrocytes to neuronal excitability and seizure generation has recently garnered more interest, which is not surprising because seizures can often initiate in or near gliotic tissue (7). As a consequence of the growing recognition that astrocytes play a dynamic role in normal CNS function via the release of gliotransmitters and other signaling molecules (e.g. tumor necrosis factor (8, 9), many of the functional and structural changes observed in astrocytes in TLE are hypothesized to alter excitability in the same limbic structures that are involved in seizure generation.
Ionotropic glutamate receptors are essential mediators of excitatory drive in the central nervous system and their study, primarily in neurons, has shed light on synaptic transmission mechanisms and alterations that occur in disease states such as epilepsy (10, 11). Interestingly, astrocytes have been shown to express ionotropic glutamate receptors in various preparations from different brain regions. Several groups have demonstrated α-amino-3-hydroxy-5-methyl-4-isoxazolepropionic acid (AMPA) receptor and kainate receptor (KAR) responses in astrocytes from hippocampal preparations (12–14). These responses are often identified in “complex” cells that display low gap junction coupling, voltage dependent current responses, absent or reduced GFAP staining; they are now understood to be a different glial cell type, i.e. the NG2 glia (14, 15). Furthermore, ionotropic glutamate receptor expression is most often found within astrocytic cultures or in slice preparations from young animals (average age: ~postnatal day 10), both preparations that can have substantially different expression profiles vs. adult tissue (16, 17). In the adult hippocampus, electrically passive, GFAP-expressing, protoplasmic astrocytes do not appear to express ionotropic glutamate receptors to any significant degree under basal conditions. In this study, we were interested in determining whether KAR expression is present in astrocytes of the hippocampus following seizure activity in a model of human TLE. Interestingly, KARs and N-methyl-D-aspartate (NMDA) receptors have been reported to be expressed in reactive astrocytes following ischemic insult in rodents (18, 19).
KARs are ionotropic glutamate receptors comprised of the “high-affinity” GluK4 and GluK5 subunits and the “low-affinity” GluK1, 2, and 3 subunits. Whereas the GluK1, 2, and 3 subunits can form functional homomeric KARs in expression systems, the GluK4 and GluK5 subunits cannot. However, GluK4 and GluK5 can assemble with GluK1, 2, or 3 to form functional heteromeric receptors (20). Furthermore, KARs can also couple to G-proteins, thus bestowing a metabotropic signaling mechanism onto these receptors (21, 22). Using immunohistochemistry on fixed whole brain specimens and Western blot analysis on enriched astroglial tissue fractions, we report that GFAP-positive astrocytes in the hippocampus of adult animals dramatically and differentially increase expression of KAR subunits following SE. These results, coupled with an increased understanding of altered properties of astrocytes following SE (23, 24), suggest that ionotropic glutamate receptor expression in reactive astrocytes may contribute to the pathophysiology of epilepsy and warrants future mechanistic studies to unravel the consequence of this expression in diseased astrocytes.
MATERIALS AND METHODS
Animals and Seizure Induction
All experiments were conducted in accordance with the National Institute of Health Guide for the Care and Use of Laboratory Animals and approved by the Institutional Animal Care and Use Committee at the University of Utah. Chemical reagents used in the study were purchased from Sigma Aldrich, St. Louis, MO unless indicated otherwise. Male Sprague-Dawley rats (42–45 days old) were injected with kainic acid ([KA], Nanocs, Boston, MA) to induce SE following the previously described repeated, low-dose KA model of acquired epilepsy (24–27). Briefly, injections of KA (5 mg/kg, i.p.) occurred once every hour until animals exhibited their first stage 4/5 seizure, as defined by the Racine scale (28). Following the onset of the first stage 4/5 seizure, injections were ceased and the time and stage of subsequent seizures was observed. To be included in the study, rats had to exhibit a minimum of 1 stage 4/5 seizure per hour over a 3.5-hour observation period. At the conclusion of behavioral monitoring, rats were given an injection of 0.9% saline (1 ml, s.c.) to prevent dehydration. Rats were then housed individually in a temperature- and light-controlled (12-hour light/dark cycle) environment and allowed access to food and water ad libitum until experimentation. Animals were killed 1 week and 8 weeks following SE. Animals at the 8-week time point were video monitored for 48 hours prior to sacrifice to confirm the presence of unprovoked spontaneous behavioral seizure activity in that cohort of animals. Animals at the 8-week time point included in the study displayed at least 1 stage 4/5 behavior seizure in a 48-hour period. A subset of animals was subjected to pilocarpine-induced SE (as previously described) to compare our results in a mechanistically different model of SE (n = 3) (29). Pilocarpine hydrochloride (50 mg/kg; i.p.) was administered 24 hours after a lithium chloride injection (20 mg/kg; i.p.), which reduces the dose of pilocarpine needed to induce SE. Animals were observed and scored for seizure severity for 1.5 hours before being returned to their home cages. All animals were given 1 ml of 0.9% saline to compensate for the fluid loss induced by excessive cholinergic activation. Numbers of animals used for each experiment are summarized in the Table.
Table 1.
Summary of Numbers of Animals Used in Each Component of the Study
| Experimental Group | Methods | No. of animals |
|---|---|---|
| 1 wk control | IHC, IF | 5 |
| 1 wk control | IHC, DAB | 3 |
| 1 wk post-KA | IHC, IF | 6 |
| 1 week post-KA | IHC, DAB | 3 |
| 8 wk control | IHC, IF | 5 |
| 8 wk post-KA | IHC, IF | 3 |
| 1–4 wk post-pilocarpine | IHC, DAB | 3 |
| 1 wk control | WB | 4 |
| 1 wk post-KA | WB | 4 |
DAB, 3, 3’-diaminobenzidine; IF, immunofluorescence; IHC, immunohistochemistry, KA, kainic acid; WB, Western blotting.
Immunohistochemistry
For immunofluorescence, animals at 1 and 8 weeks following KA-induced SE and age-matched controls were anesthetized with pentobarbital and killed by transcardial perfusion. Animals were quickly perfused with 1X phosphate buffered saline (PBS) to remove blood from the brain. The brains were then immediately removed and flash frozen in 2-methylbutane. Horizontal cryostat sections 30-µm-thick containing the hippocampus were prepared. Tissue samples from KA-treated and control animals were batch processed by placing cryosections from each condition on the same slide. The staining and imaging was performed in triplicate for each individual KAR subunit and GFAP (Table). Frozen slides were brought to room temperature and immersed in 4% paraformaldehyde (PFA) for 1 hour to fix. Sections were then rinsed with TRIS buffer (0.1 M TRIS) then placed into heated TRIS buffer (~85°C) for 1 minute to retrieve antigens. Sections were blocked in a TRIS B solution (0.1% Triton, 0.25% bovine serum albumin, in 0.1 M TRIS buffer) for 1 hour and then incubated overnight at room temperature with goat polyclonal primary antibodies from Santa Cruz Biotechnology (Santa Cruz, CA) directed against GluK1 (sc-7617, 1:100), GluK2/3 (sc-7620, 1:100), GluK4 (sc-8916, 1:100), and GluK5 (sc-8914, 1:100) made up in TRIS B. Sections were rinsed with TRIS B then incubated for 2 hours in anti-goat secondary antibody conjugated to Alexa 546 (Molecular Probes, Grand Island, NY, 1:2000). The slides were rinsed again, re-blocked in TRIS B for 30 minutes and then placed into an anti-GFAP antibody (conjugated to Alexa 488, Chemicon, Billerica, MA, 1:2000) for 2 additional hours. Finally, slides were rinsed with TRIS and coverslipped using Prolong Gold with DAPI counterstain (Molecular Probes).
A subset of animals 1 week post-KA-induced SE and age-matched controls, and animals 1 to 4 weeks post-pilocarpine treatment and age-matched controls were processed for bright field microscopy in a similar manner as above but instead using avidin-biotin complexes and 3,3’-diaminobenzidine (DAB) immunoreactivity. Animals were anesthetized and transcardially perfused with PBS followed by 4% PFA. Brains were removed and allowed to postfix overnight in 4% PFA. Brains were cut on a vibratome into 30-µm sections and stored in TRIS buffer until processing. Sections were mounted onto slides and air-dried for 15 minutes. For staining, slides were placed into heated TRIS buffer (~85°C) for 1 minute to retrieve antigens, blocked for 1 hour in TRIS B, then incubated overnight in primary antibody directed against NeuN (Chemicon, 1:10,000) or polyclonal antibodies from Santa Cruz Biotechnology directed against GluK1 (sc-7617, 1:100), GluK2/3 (sc-7620, 1:100), GluK4 (sc-8916, 1:100), and GluK5 (sc-8914, 1:100) using TRIS B. Slides were washed, then incubated in species-specific biotinylated secondary antibody for 2 hours followed by an incubation for 1 hour with a Standard ABC Elite Kit (Vector Laboratories, Burlingame, CA,1:1000). Following an additional wash step, slides were incubated in a DAB Elite kit (Vector Laboratories, 1:1000). Finally, sections were dehydrated in graded ethanols and then mounted in DPX mounting medium.
The KAR subunit antibodies used for immunohistochemistry were tested for specificity by pre-absorption of the primary antibody with blocking peptides provided by the manufacturer as well as primary omission of the antibody as a negative control. Because certain non-NMDA glutamate receptors can be sensitive to fixation (30), it is sometimes necessary to either use a non-formaldehyde based fixative or an antigen retrieval step (30, 31). We used an antigen retrieval step that resulted in maximal detection using these antibodies. It was not possible to distinguish between GluK2 and GluK3 expression.
Imaging and Colocalization
Images were captured with an Olympus FV1000 confocal microscope (IX81 inverted microscope, Olympus America) using a 20x/NA 0.75 air and 60x/NA 1.20 water immersion objectives and utilizing FluoView Software. Sections stained with DAB were imaged in brightfield mode. For immunofluorescence, the stratum radiatum of CA1 and other regions of interest were initially identified using a 100W halogen lamp and a filter set for DAPI to avoid selection bias. Once the region was selected, laser-scanning mode was used to collect images in the z-axis from the GFAP and KAR subunit channels. Laser output, photomultiplier, gain, and offset settings were corrected to minimize saturated pixels and maximize signal with respect to noise. Once optimized, the laser settings were held constant between images acquired from control and KA-treated tissue sections of the same slide. Each fluorescent channel was excited and captured sequentially to minimize bleed-through. A minimum of 12 z-stack optical images (1 µm thick) were imaged for each subunit stain from triplicate sections from animals at 1 week and 8 weeks following SE, and from age-matched controls. We focused optical imaging and colocalization analysis on the CA1 region of the hippocampus but additional regions within and outside the hippocampus were also imaged. Finally, only z-stack images collected from the center of the section were further analyzed to avoid non-specific antibody interactions at the surfaces of the tissue sections.
Raw grey scale 16-bit images from the KAR subunit and GFAP channels were utilized to perform colocalization analysis. To remove bias in the analysis, an automated macro was created using ImageJ software (National Institutes of Health) that performed the following functions to each raw image: Each image was first converted to 8-bit, then a rolling ball background subtraction was performed. Images were then automatically thresholded using the Triangle algorithm (32), and corresponding images from each channel were processed through the “colocalization” plug-in (http://rsb.info.nih.gov/ij/plugins/colocalization.html). The area of the resulting colocalized points was measured for each optical section through the stained tissue section. These values were averaged for each tissue section and then averaged across the triplicate sections stained from each brain for each KAR subunit. GFAP-positive hippocampal astrocytes showed little to no colocalization with any of the KAR subunits in naïve control animals. The control values were found not to be statistically different from each other across all control animals measured and thus were pooled. An ANOVA with Tukey’s post-test was used to find statistical significance between the colocalization areas of each KAR subunit in KA-treated animals compared to control. In colocalization images, the primary antibody omission slides were utilized to determine background autofluorescence (mean +1 SD of control sections). The levels of detection for the colocalization analyses are indicated as the dotted horizontal line on bar graphs.
Enriched Astroglial Tissue Fraction Preparation
Enriched astroglial tissue fractions were prepared from the hippocampus using modifications of previously established methods (33–36). Briefly, the tissue was homogenized in 0.32 M sucrose, buffered at pH 7.4 with Tris-HCl, using glass–Teflon tissue grinders. The homogenate was then centrifuged for 5 minutes (1000 × g at 4°C) to remove nuclei and debris. The resulting supernatant was then gently stratified on to a discontinuous Percoll gradient (2%, 6%, 10% and 20% v/v in Tris-buffered sucrose) and centrifuged for an additional 5 minutes (33,500 × g at 4°C). The layers between 2% and 6% Percoll (glial fraction) and 10% and 20% Percoll (neuronal fraction) were collected and washed by centrifugation. The pellets were resuspended in suspension buffer (10 mM Tris-HCl, 1 mM EDTA, supplemented with a mammalian protease arrest protease inhibitor cocktail (G-Biosciences, St. Louis, MO), and frozen (−80°C) until use.
Western Blotting
Protein analysis was performed using the Bradford assay (Bio-Rad, Hercules, CA). Samples were diluted into loading buffer (final concentration: 2.25% SDS, 18% glycerol, 180 mM Tris base (pH 6.8), and bromophenol blue). Western blot analysis was preformed as previously described (24, 37). Briefly, equal amounts of protein were loaded onto SDS-polyacrylamide gels. After electrophoresis, samples were transferred to polyvinylidene difluoride membranes (PerkinElmer Life Sciences, Waltham, MA) and blocked in StartingBlock blocking buffer (Pierce, Rockford, IL). Membranes were then probed with primary antibodies against GFAP (BD Scientific, San Jose, CA, 610565, 1:1000), PSD-95 (NeuroMab, Davis, CA, 1:1000), and GluK4 (Abcam, Cambridge, MA, ab10101, 1:1000) overnight and then washed in Tris buffered saline with Tween (0.05% Tween 20). Membranes were then incubated for 1 hour with species-specific secondary antibodies conjugated with horseradish peroxidase. Antigen-antibody complexes were visualized by chemiluminescence (PerkinElmer Life Sciences). Bands were quantified with an Alpha-Innotech FluorChem SP digital imager with AlphaEase software. Data are expressed as mean ± SEM, unless otherwise indicated. As a lane loading control, blots were stripped and re-probed with an anti-actin antibody (Santa Cruz, sc-1616, 1:100). Statistical significance was determined with Student t-test for independent and unpaired samples unless otherwise indicated.
RESULTS
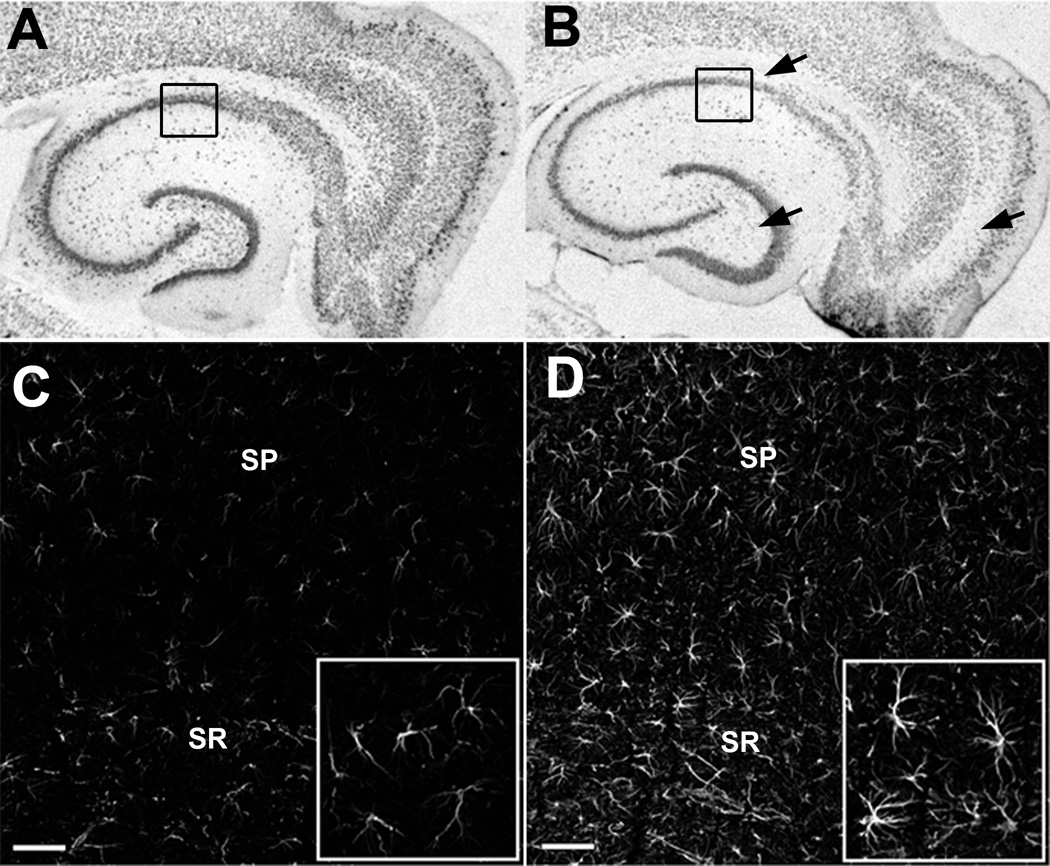
Astrogliosis and neuronal cell loss in the hippocampus following KA-treatment The KA-treated rat is a well-established model of TLE that mimics many of the pathological findings seen in human TLE (25, 27, 38). Specific neuronal cell loss, tissue shrinkage, and reactive astrogliosis are all recapitulated in the KA-treated rat. Neuron loss and reactive astrogliosis are seen in the hippocampus 1 week following SE induced by repeated low doses of KA (Fig. 1A–D). Consistent with previous reports from our laboratory as well as others, neuron cell loss was observed in the CA1 and CA3 cell layers, the hilar region of the dentate gyrus and the entorhinal cortex in KA-treated animals (Fig. 1B) vs. control (Fig. 1A) (26, 39). In addition to cell loss, prominent reactive astrogliosis is observed in this model (Fig. 1D). During 1 week post-SE, astrocytes display isomorphic gliosis characterized by pronounced hypertrophy and increased GFAP expression but without overt scar formation (i.e. no special orientation, palisading of processes, or gross overlap) in or around the damaged cell fields of CA1 (40, 41). Because the 1-week time point represents a period of time when spontaneous seizures are rarely observed (27), the cell loss and accompanying glial response is attributed to the excitotoxic cell damage resulting from the initial SE insult.
Figure 1.
Neuron loss and reactive astrocytes in the hippocampus following kainic acid (KA)-induced status epilepticus (SE). (A, B) Brightfield images of immunostaining for the neuronal marker NeuN in an age-matched control animal (A) and 1 week following KA-induced SE (B). Prominent cell loss and disruption of cell layers are indicated by black arrows. (C, D) Optical sections (1 µm thick) of immunofluorescence staining for GFAP in the CA1 region of age-matched control (C) and increased GFAP expression in astrocytes of the CA1 region following KA-induced SE (D). Black boxes in (A) and (B) indicate regional location of images in (C) and (D). Inset = increased magnification of selected regions in (C) and (D). SP = stratum pyramidale, SR= stratum radiatum, Scale bar = 50 µm.
Increased Expression of KAR Subunits in Astrocytes Following SE
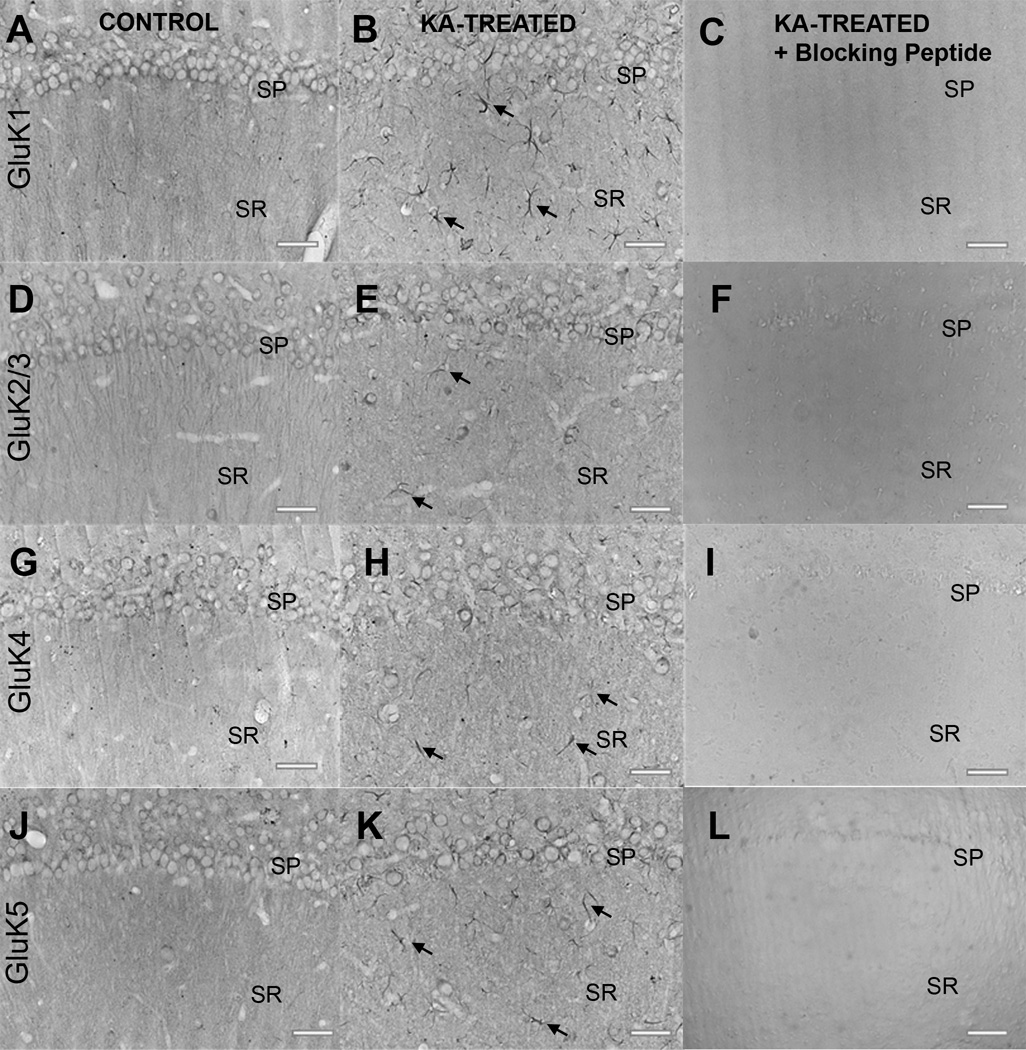
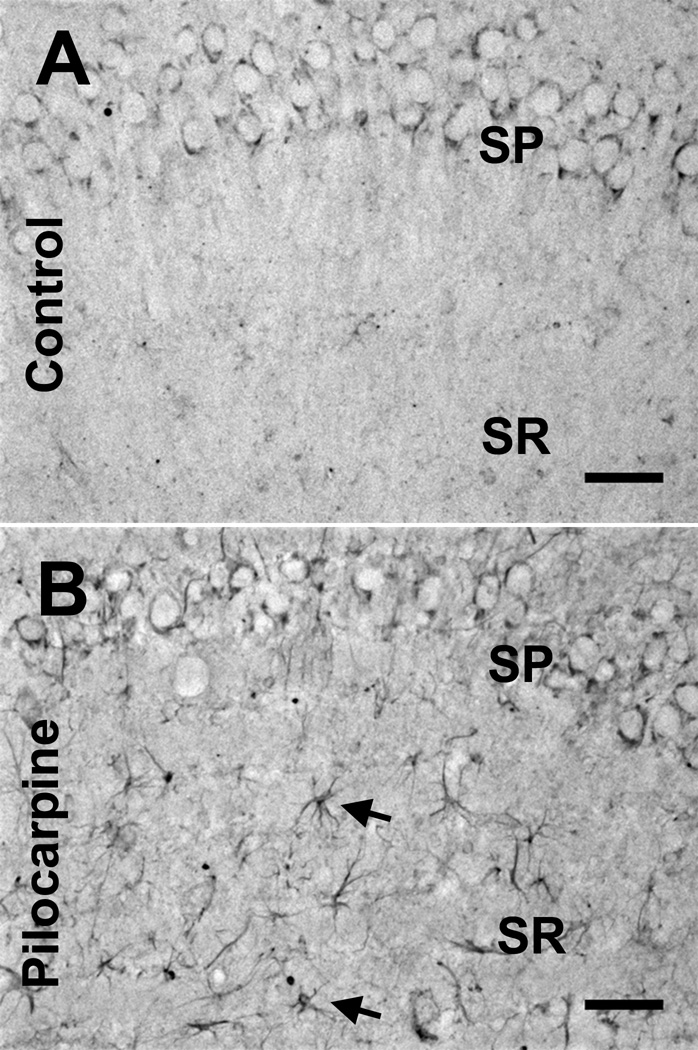
We first determined the specificity of the KAR subunit antibodies. Tissue from animals at 1 week post-KA and age-matched controls were stained for each KAR subunit. Figure 2 demonstrates the antibody specificity imaged in the CA1 region of the rat hippocampus using standard avidin-biotin complex immunohistochemistry with DAB. Neuronal staining of the stratum pyramidale layer was present in naïve age-matched control tissue for the GluK1, GluK2/3, GluK4, and GluK5 antibodies (Fig. 2A, D, G, J). Neuron labeling is reduced in animals at 1 week post-KA treatment, most likely due to a loss of primary cells and cell layer dispersion (Fig. 2B, E, H, K). Interestingly, we noticed GluK1, GluK2/3, GluK4, and GluK5 KAR subunit expression in cells resembling astrocytes following SE in the hippocampal CA1 region, with GluK1 being most prominent (Fig. 2B, E, H, K). Primary antibody omission (not shown) and pre-absorption of the primary antibody with antibody specific blocking peptides abolished staining (Fig. 2C, F, I, L). We next tested whether a mechanistically different but equally valid model of TLE, the pilocarpine treated model, displayed similar results. Tissue sections from rats 1 to 4 weeks following pilocarpine treatment, and controls, were processed with DAB staining and GluK4 antibody. Figure 3 shows GluK4 staining with a similar pattern as that in the KA-treated tissue, with prominent neuronal cell layer disruption and cell loss and concomitant expression in cells that resemble astrocytes.
Figure 2.
Antibody specificity using brightfield microscopy of immunostaining with goat polyclonal kainic acid (KA) receptor (KAR) subunit antibodies. (A–K) Labeling with antibodies to GluK1, GluK2/3, GluK4, and GluK5 in the hippocampal CA1 region from age-matched control animals (A, D, G, J) and animals 1 week post-KA-induced status epilepticus (SE) (B, E, H, K). Note the neuronal cell loss and increased immunoreactivity in cells resembling astrocytes in KA-treated animals (black arrows). Staining was abolished in KA-treated tissue sections when the primary antibody was omitted (not shown) and when the primary antibody was pre-adsorbed with appropriate blocking peptide (C, F, I, L). SP= stratum pyramidale; SR= stratum radiatum; Scale bar = 50 µm.
Figure 3.
Kainic acid receptor (KAR) subunit expression in pilocarpine-treated rats. (A) Neuronal GluK4 KAR subunit expression in the CA1 region of control animals shows a similar pattern to that in the kainic acid (KA)-treated control group. (B) At 1 to 4 weeks following pilocarpine treatment (in addition to neuronal cell loss) there is GluK4 immunoreactivity in cells resembling astrocytes in the stratum radiatum of the hippocampus (black arrows). SP = stratum pyramidale; SR = stratum radiatum. Scale bar = 50 µm.
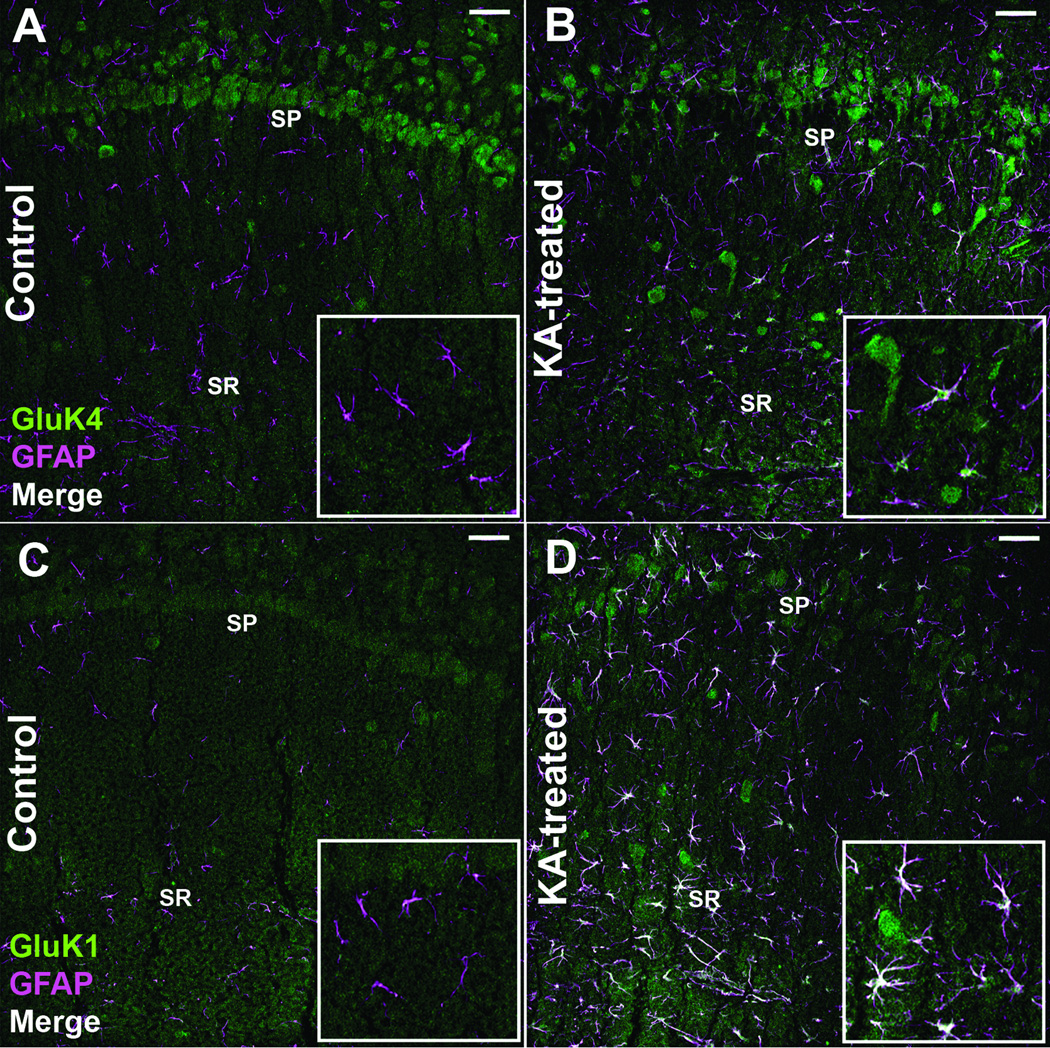
To confirm KAR subunit expression in astrocytes in KA-treated tissue, we performed immunofluorescence colocalization studies. Horizontal brain sections containing the hippocampus were processed for immunofluorescence using antibodies directed against GluK1, GluK2/3, GluK4, GluK5 and GFAP. Figure 4 shows example images stained for the GluK1 and GluK4 receptor subunits from control animals and animals at 1 week post-KA treatment. Optical sectioning of the signal reveals that KAR subunits colocalized with GFAP-positive astrocytes following insult (Fig. 4B, D), which does not occur in control tissue (Fig. 4A, C).
Figure 4.
Kainic acid receptor (KAR) subunits colocalize with glial fibrillary acidic protein (GFAP)-positive astrocytes following kainic acid (KA)-induced status epilepticus (SE). (A-D) Immunofluorescence staining for the GluK4 receptor subunit and GFAP in the CA1 region from a control (A) and an animal 1 week following KA-induced SE (B). Immunofluorescence staining for the GluK1 receptor subunit and GFAP in the CA1 region from a control (C) and animal 1 week following KA-induced SE (D). Images are 1-µm-thick confocal optical sections. Notice neuronal cell layer disruption and the colocalization (in white) of GFAP-positive astrocytes with KAR subunits following KA-induced SE. SP= stratum pyramidale, SR= stratum radiatum, Scale bar = 50 µm.
Quantification of KAR Subunit Expression in Astrocytes Following KA Treatment
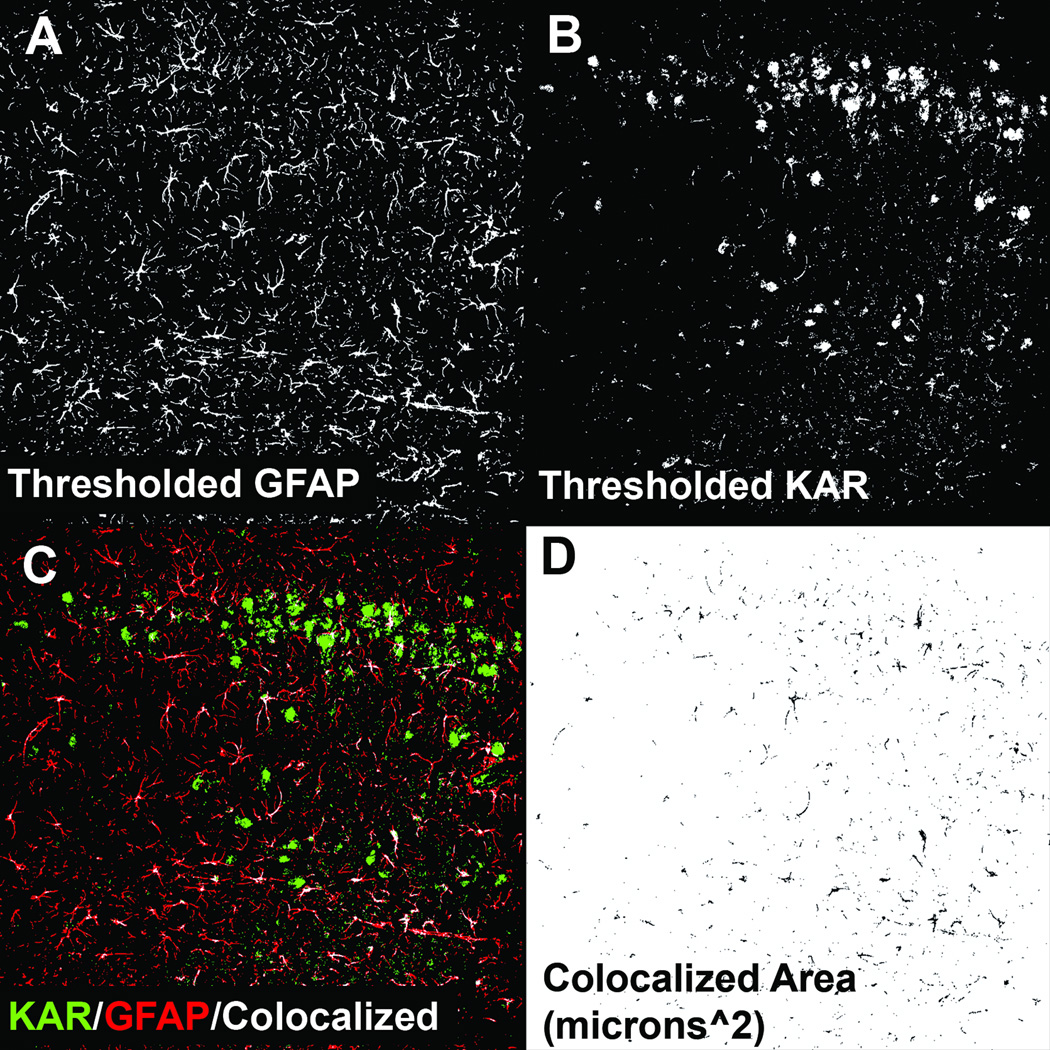
Figure 5A, B show the resulting images from both GFAP and KAR channels that were thresholded using the triangle algorithm in hippocampal tissue from animals that experienced SE. A representative output image from the colocalization plugin utilized in shown in Figure 5C. The plugin superimposes 1-µm-thick, 8-bit grey scale confocal images and displays the resulting areas of colocalization in white. The plugin also generates an additional 8-bit image in which the colocalization area was measured using the analyze particles function within ImageJ (Fig. 5D).
Figure 5.
Example of colocalization analysis and automated quantification. (A) Grey scale 8-bit optical section (1-µm thick) of glial fibrillary acidic protein (GFAP) staining in the CA1 region from an animal 1 week following kainic acid (KA)-induced status epilepticus (SE) that has been autothresholded using the triangle algorithm. (B) Optical section of the corresponding KA receptor (KAR) subunit stain channel that has also been thresholded. (C) Output of the colocalization plugin. (D) The plugin also generates an 8-bit image of the areas of colocalization.
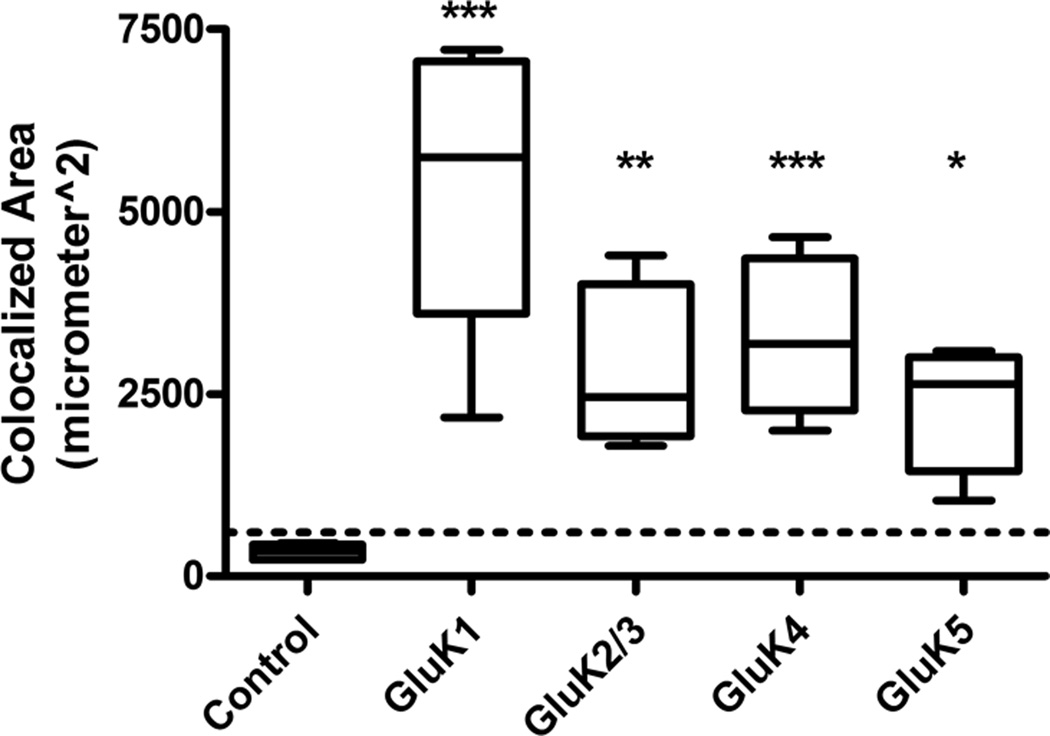
Results from the colocalization analysis from control animals (n = 5) and animals at 1 week post-SE (n = 6) are shown in Figure 6. In agreement with the current literature there appeared to be no KAR subunit expression in astrocytes in naïve control adult rats but at 1 week following SE there was significant colocalization of KAR subunits with GFAP-positive astrocytes. GluK1 was the KAR subunit colocalized with astrocytes to the greatest extent followed by GluK4, GluK2/3, and GluK5.
Figure 6.
Colocalization analysis for all kainic acid receptor (KAR) subunits at 1 week post-kainic acid (KA)-induced status epilepticus (SE) vs. control. Colocalization areas were measured for each series of optical sections through the tissue slice. Sections (3 per brain) were stained for each KAR subunit and glial fibrillary acidic protein (GFAP), and the results were averaged. Very little to no colocalization was seen in GFAP-positive astrocytes in naïve control tissue (n = 5), and was below the experimentally derived limit of detection (dotted line = mean + 1 SD of colocalization area from combined primary antibody omission slides). For KA-treated tissue samples (n = 6 for each subunit), the GluK1 and GluK4 subunits showed the greatest colocalization followed by modest colocalization of GluK2/3 and GluK5. Data are expressed as mean ± SEM. ns = not significant, *p < 0.05, **p < 0.01, ***p < 0.001.
KAR Expression Persists in Astrocytes 8 Weeks Following KA-induced SE
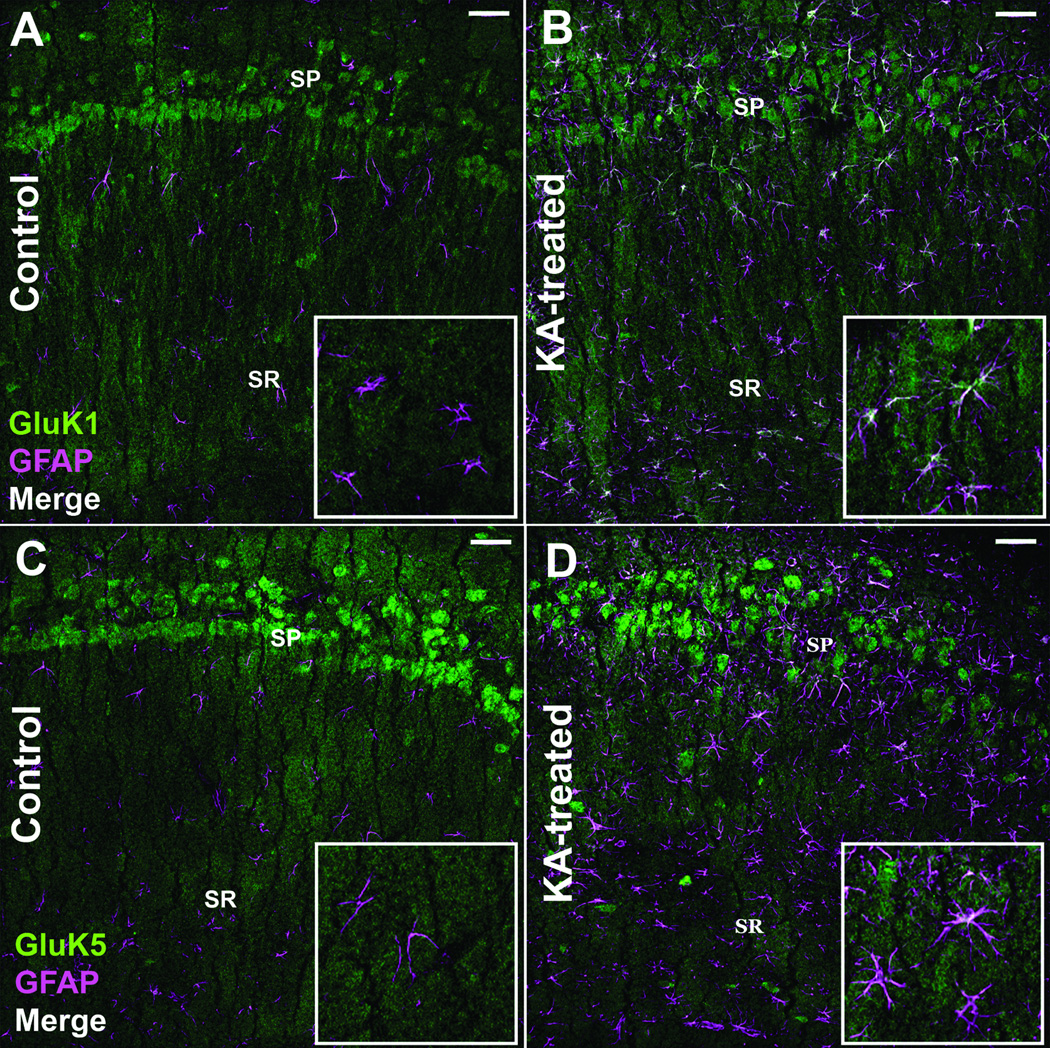
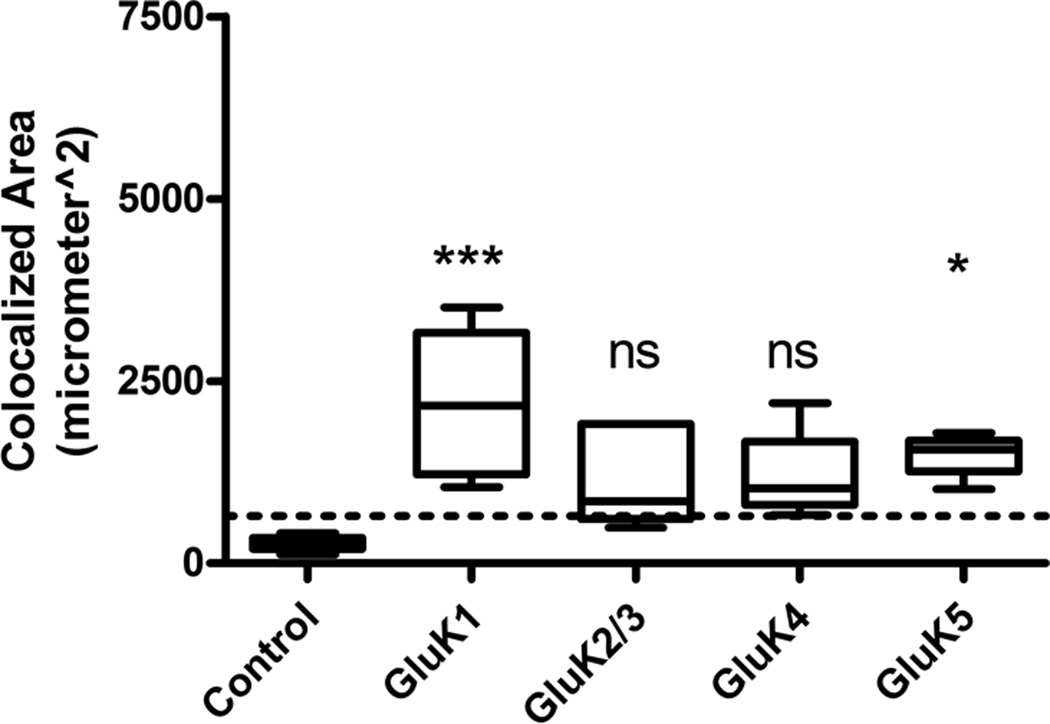
At 8 weeks post-SE (following the repeated, low-dose KA model of acquired epilepsy), animals begin to express behavioral motor seizure activity. To confirm this, animals were placed into observation boxes, given access to food and water ad libitum, and video monitored for 48 hours to confirm the presence of spontaneous behavioral seizures. All animals examined displayed at least 1 spontaneous stage 4/5 behavioral seizure based off the Racine scale during the observation period. GluK1 and GluK5 continued to demonstrate significant astrocyte expression as evidenced by colocalization with GFAP at this time point (Fig. 7B, D), although the overall extent of colocalization of KAR subunits at this time point was less than that observed in animals 1 week following SE. Similar to the 1-week time point, GluK1 continued to be colocalized to the greatest extent at the 8-week time point. The GluK2/3, and GluK4 subunits did not display statistically different colocalization with GFAP compared to controls at the 8-week time point. Results of analyzed sections from control animals (n = 5) and animals 8 weeks after SE (n = 5) are summarized in Figure 8. We hypothesized that at the 8-week time point following SE (when animals begin to express spontaneous behavioral seizures) there might be a more intense glial reaction including scar formation due to the seizure activity. However, this was not the case, and at the 8-week post-SE time point, astrocytes appear to remain isomorphic in their cytoarchitecture (Fig. 7B, D) (GFAP channel). Furthermore, analysis of the GFAP channel immunofluorescence from animals 1 week and 8 weeks post-SE revealed no statistically significant difference in GFAP expression area (data not shown), suggesting that the intensity of astrogliosis did not significantly change at the 8-week post-SE time point.
Figure 7.
Kainic acid receptor (KAR) subunit colocalization with glial fibrillary acidic protein (GFAP)-positive astrocytes persists 8 weeks following kainic acid (KA)-induced status epilepticus (SE). (A, B) Immunofluorescence staining for the GluK1 receptor subunit and GFAP in the CA1 region from a control (A) and an animal 8 weeks following KA-induced SE (B). (C, D) Staining for the GluK5 receptor subunit and GFAP in the CA1 region from a control (C) and 8 weeks following KA-induced SE (D). Images are 1-µm-thick confocal optical sections. SP = stratum pyramidale, SR = stratum radiatum, Scale bar = 50 µm.
Figure 8.
Colocalization analysis for kainic acid receptor (KAR) subunits at 8 weeks post-kainic acid (KA)-induced status epilepticus (SE) vs. control. Very little to no colocalization was seen in glial fibrillary acidic protein (GFAP)-positive astrocytes in naïve control tissue (n = 5) and was below the experimentally derived limit of detection (dotted line = mean + 1 SD of colocalization area from combined primary antibody omission slides). For the KA-treated tissue (n = 5 for each subunit), only the GluK1 and GluK5 subunits showed statistically significant colocalization. Data are expressed as mean ± SEM. ns = not significant, *p < 0.05, ***p < 0.001.
KAR Expression in Astrocytes Does Not Occur in all Brain Regions following SE
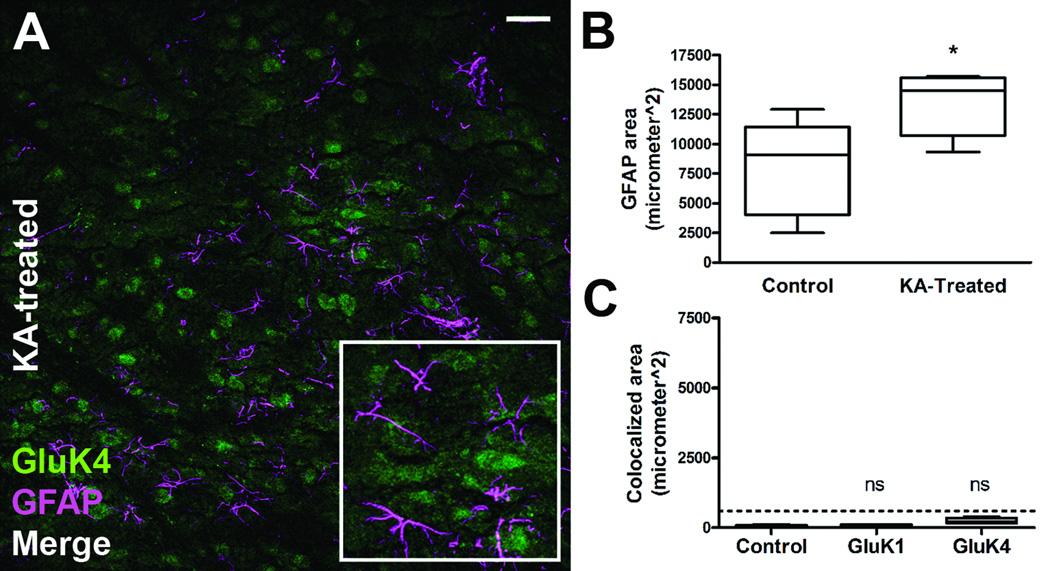
KAR subunits consistently colocalized with GFAP-positive astrocytes in the CA1 region of the hippocampus following SE. A qualitative assessment of GFAP-positive astrocytes in other regions of the hippocampus, including CA3, the hilus, and entorhinal cortex, also demonstrated KAR subunit expression (Fig. 9). We wanted to determine whether other GFAP-positive astrocytes in areas not thought to be involved in seizure activity also express KARs following SE. To test this, we imaged astrocytes in such alternate regions from the 1-week time point dataset. Figure 10 demonstrates the results of images taken from the striatum of rats 1 week following SE (n = 6) and control animals (n = 5). Figure 10A is a representative image from a KA-treated animal demonstrating a lack of colocalization with GFAP-positive astrocytes in striatum. Interestingly, GFAP expression is increased in the striatum, suggesting reactive astrogliosis in this brain region (Fig. 10B). Colocalization analysis of the GluK1 and GluK4 subunits (the subunits shown to be expressed in hippocampus to the highest degree in astrocytes) demonstrated clear lack of colocalization in the striatum, however (Fig. 10C). We also imaged regions in the brain stem and olfactory bulb and determined that there was no colocalization of KAR subunits with GFAP-positive astrocytes in those areas following SE (data not shown). These results suggest that KAR subunit expression in astrocytes following SE is not a universal finding throughout the brain, but is restricted to certain brain regions.
Figure 9.

Kainic acid receptor (KAR) subunits colocalize with glial fibrillary acidic protein (GFAP)-positive astrocytes throughout the hippocampus and surrounding cortex following kainic acid (KA)-induced status epilepticus. (A-C) KAR subunit colocalization was routinely observed (but not quantified) throughout the hippocampus and surrounding cortex following KA-induced SE. Each panel are resulting colocalization analysis images demonstrating GluK4 colocalization in CA3 (A), GluK1 colocalization in the dentate gyrus (B), and GluK1 colocalization in the entorhinal cortex (C) following KA-induced SE. KAR subunit channel (green), GFAP channel (red), colocalized pixels (white). SP = stratum pyramidale, SR= stratum radiatum, GCL= granule cell layer. Scale bar = 50 µm.
Figure 10.
Kainic acid receptor (KAR) subunit colocalization with glial fibrillary acidic protein (GFAP)-positive astrocytes following kainic acid (KA)-induced status epilepticus (SE) is not observed in all brain regions. The KAR subunits that showed the greatest colocalization in the hippocampal CA1 region 1 week post-SE (GluK1 and GluK4) were analyzed for colocalization in alternate brain regions. (A) Example image of staining for the GluK4 receptor subunit in the striatum of an animal 1 week post-KA-induced SE. (B) In this region GFAP expression is significantly increased in animals 1 week post-KA-induced SE (n = 6) compared to control (n = 5). (C) Even though GFAP expression is increased, the resulting colocalization analysis of the GluK1 and GluK4 subunits showed lack of colocalization 1 week post-KA-induced SE (n = 6) vs. control (n = 5) in the striatum. Lack of colocalization was also noted in the brain stem and olfactory bulb of KA-treated animals (data not shown). Dotted line = mean +1 SD of colocalization area from combined primary antibody omission slide; NS = not significant; * = p < 0.05, scale bar = 50 µm.
GluK4 Expression Is Increased in Glial-Enriched Fractions of Hippocampus Following SE
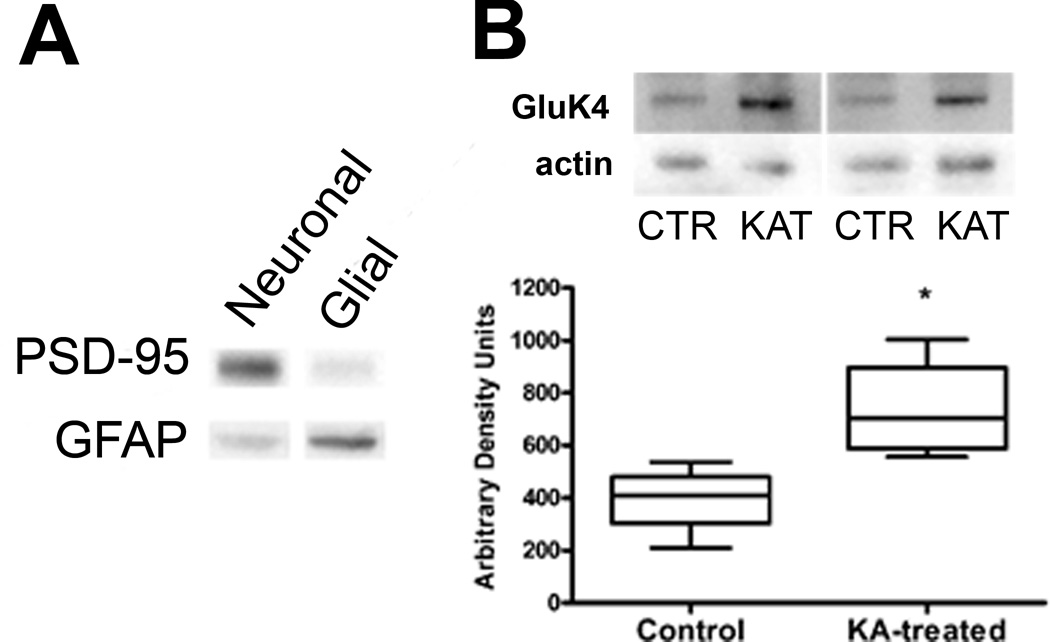
An alternative technique was used to confirm the KAR subunit protein expression seen in post-SE astrocytes via immunohistochemistry. We used immunoblotting on glial-enriched tissue fractions (33–36). This preparation was appealing because it allows for the rapid enrichment of adult astroglial and neuronal tissue from rat brain for use in biochemical analysis without the use of cell culturing or transgenic labeling and fluorescent activated cell sorting approaches. Figure 11A demonstrates the enrichment accomplished using the Percoll density gradient technique. Although it is not a full separation, glial tissue fractions are enriched in GFAP and relatively devoid of the neuronal marker PSD-95 compared to synaptosomal fractions of the same preparation, indicating enrichment. In our hands, the glial enrichment technique had extremely low yield making an exhaustive Western blot analysis for all the KAR subunits not possible. When glial-enriched fractions were analyzed using a Western blot-specific anti-GluK4 antibody there was a significant increase in receptor expression in KA-treated tissue 1 week post-SE (n = 4) vs. control (n = 4) (Fig. 11B). Thus, using an alternate technique, this result also suggests that KAR subunits are increased in astrocytes following SE.
Figure 11.
Western blot analysis of glial-enriched tissue fractions reveals kainic acid receptor (KAR) expression in animals 1 week following kainic acid (KA)-induced status epilepticus (SE). (A) Demonstration of enrichment technique. Equal amounts of protein from enriched neuronal and glial fractions from the same preparation were probed for their immunoreactivity to the neuronal marker PSD-95 and glial marker (GFAP). The glial fraction has less PSD-95 reactivity and greater GFAP reactivity vs. the neuronal fraction. (B) Enriched glial fractions demonstrate increased GluK4 receptor subunit immunoreactivity in animals 1 week post-KA-induced SE (n = 4) vs. control animals (n = 4). Data are expressed as mean ± SEM. For sample bands, CTR = control, KAT = KA-treated, *p < 0.05
DISCUSSION
In this study, we used dual-labeling immunohistochemistry and glial-enriched Western blot techniques to demonstrate that KAR subunit expression increases in astrocytes following KA-induced SE, a model of TLE. Indeed, at 1 week following SE we observed significant increases in the GluK1, GluK2/3, GluK4 and GluK5 KAR subunits in GFAP-positive astrocytes in the hippocampal CA1 region. Furthermore, GluK1 and GluK5 KAR subunit expression was also evident 8 weeks after SE, when animals exhibited spontaneous behavioral seizures. We further identified the increased expression of the GluK4 receptor subunit in glial-enriched hippocampal tissue fractions using Western blotting in tissue 1 week following SE. Finally, increased KAR expression in astrocytes was also observed in the hippocampus of the pilocarpine-treated rats, an alternative model of TLE. Both high- and low-affinity KAR receptor subunits were expressed in astrocytes following KA-induced SE, suggesting that the appropriate combination of KAR subunits are available to form functioning heteromeric receptors. These results demonstrate that there is a persistent and novel expression of KARs in adult astrocytes following SE.
What could be the function of KAR expression in astrocytes following SE? One possibility is that astrocytic KAR expression following SE might serve as a sensor for excess glutamate. Astrocytes have been shown in culture to propagate intracellular Na+ waves in response to extracellular glutamate (42). This phenomenon results in the activation of the glial Na+K+-ATPase, thus increasing energy demand inside the astrocyte (43). Through the astrocyte-to-neuron lactate shuttle, increased energy demand and glucose consumption inside the astrocyte has been shown to provide important metabolic substrates to surrounding neurons (44). Therefore, activation of Na+ permeable ionotropic KARs in astrocytes might serve to sense increased glutamate concentration and amplify the intracellular Na+ signal required to produce important energy substrates for surrounding injured surviving neurons.
However, it is also intriguing to speculate that if the receptors are functional their activation could trigger the release of gliotransmitters, such as glutamate, D-serine, or ATP from the astrocyte. For example, astrocytes have been shown to be a non-neuronal source of extracellular glutamate (45–47). Glutamate release from astrocytes has been implicated in hippocampal slice models of seizure activity (48, 49). The release of glutamate from astrocytes has been shown to depend on a calcium ion based form of excitability that has been extensively described (50–53 but also see 54). Indeed, primary cultures of astrocytes taken from the sclerotic hippocampus, as well as cortical astrocytes isolated from the epileptic foci of child patients suffering with an intractable form of epilepsy have been shown to have increased calcium signaling (55, 56). Therefore, we hypothesize that increased calcium signaling mediated in part by the pathological expression of ionotropic KARs in reactive astrocytes could cause the synchronization of remaining neurons via the release of glutamate, thus contributing to hyperexcitability. Future experiments will determine if activation of KARs in astrocytes following KA-induced SE contributes to enhanced calcium signaling and hyperexcitability in brain regions that are known to participate in seizure generation and propagation.
A recent study conducted on human hippocampal tissue resected from patients with TLE found significant alterations in astrocyte related proteins including GFAP, the inward rectifying potassium channel Kir 4.1, and gap junction protein connexin 43 along with increased levels of the KAR subunits GluK4 and GluK5 (57). However, this study could not distinguish which cell types might be contributing to the increased KAR subunit expression levels observed. Our present findings suggest astrocytic expression could contribute to the observed increase in KARs. Indeed, in the present experiments, GluK5 expression was shown to remain significantly elevated in astrocytes at the 8-week time point following KA treatment when animals became epileptic.
The neuronal expression pattern of KAR subunits in this study conforms well to previously reported observations. The mRNA message for the different KAR subunits is strongly detectable for GluK2 and GluK5 in the CA1 region of the adult rat hippocampus while GluK1, GluK3, and GluK4 expression is lower but still detectable (58, 59). In our hands using immunohistochemistry with DAB (a more sensitive staining method than immunofluorescence), we found consistent labeling of the CA1 pyramidal cell layer with the different KAR subunit antibodies used. However, in immunofluorescence staining, pyramidal cell labeling for GluK1 was often very low, but detectable, similar to mRNA expression reports (58, 59). We attempted to stain for GluK2 using similar polyclonal goat antibodies but did not find expression in the CA1 region (data not shown). Conversely, we detected positive labeling using the GluK3 antibody; however, the expression of GluK3 mRNA is primarily restricted to dentate gyrus granule cells and is only weakly expressed in CA1 (58). Significant cross-reactivity of GluK2 and GluK3 antibodies has been documented previously in the literature and by using KAR subunit specific knock out animals it was shown that GluK2 expression most likely accounts for labeling in the CA cell fields using GluK2/3 antibodies (60). Therefore, in the present study it was not possible to distinguish between GluK2 and GluK3 expression. In both DAB and immunofluorescence experiments, we saw consistent pyramidal cell layer expression of GluK4. Although the mRNA message for GluK4 is low in CA1, others reports have demonstrated protein expression of GluK4 in the CA1 of mouse and rat (60, 61).
In conclusion, we have demonstrated in an experimental model of TLE that adult, GFAP-positive, hippocampal astrocytes begin to express KAR subunits following SE. In the CA1 region and surrounding structures the expression of KAR subunits in reactive astrocytes accompanies neuronal cell loss early in the 1-week time point following SE and persists 8 weeks following SE when spontaneous behavioral seizures occur. At the latter time point, KAR subunit expression is dominated by the GluK1 and GluK5 receptor subunits. KAR expression in astrocytes following SE occurs in brain regions involved in the generation of seizure, such as the hippocampus and surrounding cortex but is absent in other brain regions, e.g. striatum, even under conditions when GFAP levels are increased. The present results suggest an intriguing contribution of ionotropic glutamate receptor signaling in astrocytes but only following pathological insult in the adult CNS. Indeed, changes in astrocyte function may contribute considerably to the process of epileptogenesis and understanding these alterations may be key to the development of innovative therapies.
ACKNOWLEDGMENTS
We thank Dr. Annette Fleckenstein, Dr. Kristen Keefe, and Dr. Diana Wilkins for technical assistance and use of laboratory equipment; Dr. Giambattista Bonanno, Dr. Robert Marc, Dr. Evan Riddle, and Dr. Greg Hadlock for helpful discussions and Dr. Christopher Rodesch and the Utah Imaging Core Facility. We also thank Jerry Saunders and Carlos Rueda for assistance with kainic acid injections.
This work was supported by National Institutes of Health Grants NS062419 (KSW), NS044210 (KSW), NS066774 (JRV), and an Epilepsy Foundation Health Sciences Student Fellowship (JRV).
Footnotes
Publisher's Disclaimer: This is a PDF file of an unedited manuscript that has been accepted for publication. As a service to our customers we are providing this early version of the manuscript. The manuscript will undergo copyediting, typesetting, and review of the resulting proof before it is published in its final citable form. Please note that during the production process errors may be discovered which could affect the content, and all legal disclaimers that apply to the journal pertain.
REFERENCES
- 1.Engel J., Jr. Clinical evidence for the progressive nature of epilepsy. Epilepsy Res Suppl. 1996;12:19–20. [PubMed] [Google Scholar]
- 2.Kanner AM. Mood disorder and epilepsy: a neurobiologic perspective of their relationship. Dialogues Clin Neurosci. 2008;10:39–45. doi: 10.31887/DCNS.2008.10.1/amkanner. [DOI] [PMC free article] [PubMed] [Google Scholar]
- 3.Mohanraj R, Brodie MJ. Diagnosing refractory epilepsy: response to sequential treatment schedules. Eur J Neurol. 2006;13:277–282. doi: 10.1111/j.1468-1331.2006.01215.x. [DOI] [PubMed] [Google Scholar]
- 4.Binder DK, Steinhauser C. Functional changes in astroglial cells in epilepsy. Glia. 2006;54:358–368. doi: 10.1002/glia.20394. [DOI] [PubMed] [Google Scholar]
- 5.Oberheim NA, Tian GF, Han X, et al. Loss of astrocytic domain organization in the epileptic brain. J Neurosci. 2008;28:3264–3276. doi: 10.1523/JNEUROSCI.4980-07.2008. [DOI] [PMC free article] [PubMed] [Google Scholar]
- 6.de Lanerolle NC, Lee TS, Spencer DD. Astrocytes and epilepsy. Neurotherapeutics. 2010;7:424–438. doi: 10.1016/j.nurt.2010.08.002. [DOI] [PMC free article] [PubMed] [Google Scholar]
- 7.Spencer SS, Kim J, deLanerolle N, et al. Differential neuronal and glial relations with parameters of ictal discharge in mesial temporal lobe epilepsy. Epilepsia. 1999;40:708–712. doi: 10.1111/j.1528-1157.1999.tb00767.x. [DOI] [PubMed] [Google Scholar]
- 8.Beattie EC, Stellwagen D, Morishita W, et al. Control of synaptic strength by glial TNFalpha. Science. 2002;295:2282–2285. doi: 10.1126/science.1067859. [DOI] [PubMed] [Google Scholar]
- 9.Stellwagen D, Malenka RC. Synaptic scaling mediated by glial TNF-alpha. Nature. 2006;440:1054–1059. doi: 10.1038/nature04671. [DOI] [PubMed] [Google Scholar]
- 10.Dingledine R. Glutamatergic mechanisms related to epilepsy: ionotropic receptors. In: Noebels JL, Avoli M, Rogawski MA, Olsen RW, Delgado-Escueta AV, editors. Jasper's Basic Mechanisms of the Epilepsies. Bethesda: Maryland; 2012. [PubMed] [Google Scholar]
- 11.Traynelis SF, Wollmuth LP, McBain CJ, et al. Glutamate receptor ion channels: structure, regulation, and function. Pharmacol Rev. 2010;62:405–496. doi: 10.1124/pr.109.002451. [DOI] [PMC free article] [PubMed] [Google Scholar]
- 12.Jabs R, Kirchhoff F, Kettenmann H, et al. Kainate activates Ca(2+)-permeable glutamate receptors and blocks voltage-gated K+ currents in glial cells of mouse hippocampal slices. Pflugers Arch. 1994;426:310–319. doi: 10.1007/BF00374787. [DOI] [PubMed] [Google Scholar]
- 13.Porter JT, McCarthy KD. GFAP-positive hippocampal astrocytes in situ respond to glutamatergic neuroligands with increases in [Ca2+]i. Glia. 1995;13:101–112. doi: 10.1002/glia.440130204. [DOI] [PubMed] [Google Scholar]
- 14.Steinhauser C, Jabs R, Kettenmann H. Properties of GABA and glutamate responses in identified glial cells of the mouse hippocampal slice. Hippocampus. 1994;4:19–35. doi: 10.1002/hipo.450040105. [DOI] [PubMed] [Google Scholar]
- 15.Bergles DE, Jabs R, Steinhauser C. Neuron-glia synapses in the brain. Brain Res Rev. 2010;63:130–137. doi: 10.1016/j.brainresrev.2009.12.003. [DOI] [PMC free article] [PubMed] [Google Scholar]
- 16.Cahoy JD, Emery B, Kaushal A, et al. A transcriptome database for astrocytes, neurons, and oligodendrocytes: a new resource for understanding brain development and function. J Neurosci. 2008;28:264–278. doi: 10.1523/JNEUROSCI.4178-07.2008. [DOI] [PMC free article] [PubMed] [Google Scholar]
- 17.Condorelli DF, Dell'Albani P, Amico C, et al. Induction of primary response genes by excitatory amino acid receptor agonists in primary astroglial cultures. J Neurochem. 1993;60:877–885. doi: 10.1111/j.1471-4159.1993.tb03232.x. [DOI] [PubMed] [Google Scholar]
- 18.Gottlieb M, Matute C. Expression of ionotropic glutamate receptor subunits in glial cells of the hippocampal CA1 area following transient forebrain ischemia. J Cereb Blood Flow Metab. 1997;17:290–300. doi: 10.1097/00004647-199703000-00006. [DOI] [PubMed] [Google Scholar]
- 19.Krebs C, Fernandes HB, Sheldon C, et al. Functional NMDA receptor subtype 2B is expressed in astrocytes after ischemia in vivo and anoxia in vitro. J Neurosci. 2003;23:3364–3372. doi: 10.1523/JNEUROSCI.23-08-03364.2003. [DOI] [PMC free article] [PubMed] [Google Scholar]
- 20.Lerma J, Paternain AV, Rodriguez-Moreno A, et al. Molecular physiology of kainate receptors. Physiol Rev. 2001;81:971–998. doi: 10.1152/physrev.2001.81.3.971. [DOI] [PubMed] [Google Scholar]
- 21.Rodriguez-Moreno A, Sihra TS. Kainate receptors with a metabotropic modus operandi. Trends Neurosci. 2007;30:630–637. doi: 10.1016/j.tins.2007.10.001. [DOI] [PubMed] [Google Scholar]
- 22.Rozas JL, Paternain AV, Lerma J. Noncanonical signaling by ionotropic kainate receptors. Neuron. 2003;39:543–553. doi: 10.1016/s0896-6273(03)00436-7. [DOI] [PubMed] [Google Scholar]
- 23.Seifert G, Carmignoto G, Steinhauser C. Astrocyte dysfunction in epilepsy. Brain Res Rev. 2010;63:212–221. doi: 10.1016/j.brainresrev.2009.10.004. [DOI] [PubMed] [Google Scholar]
- 24.Takahashi DK, Vargas JR, Wilcox KS. Increased coupling and altered glutamate transport currents in astrocytes following kainic-acid-induced status epilepticus. Neurobiol Dis. 2010;40:573–585. doi: 10.1016/j.nbd.2010.07.018. [DOI] [PMC free article] [PubMed] [Google Scholar]
- 25.Hellier JL, Patrylo PR, Buckmaster PS, et al. Recurrent spontaneous motor seizures after repeated low-dose systemic treatment with kainate: assessment of a rat model of temporal lobe epilepsy. Epilepsy Res. 1998;31:73–84. doi: 10.1016/s0920-1211(98)00017-5. [DOI] [PubMed] [Google Scholar]
- 26.Smith MD, Adams AC, Saunders GW, et al. Phenytoin- and carbamazepine-resistant spontaneous bursting in rat entorhinal cortex is blocked by retigabine in vitro. Epilepsy Res. 2007;74:97–106. doi: 10.1016/j.eplepsyres.2007.02.001. [DOI] [PubMed] [Google Scholar]
- 27.Williams PA, White AM, Clark S, et al. Development of spontaneous recurrent seizures after kainate-induced status epilepticus. J Neurosci. 2009;29:2103–2112. doi: 10.1523/JNEUROSCI.0980-08.2009. [DOI] [PMC free article] [PubMed] [Google Scholar]
- 28.Racine RJ. Modification of seizure activity by electrical stimulation. II. Motor seizure. Electroencephalogr Clin Neurophysiol. 1972;32:281–294. doi: 10.1016/0013-4694(72)90177-0. [DOI] [PubMed] [Google Scholar]
- 29.White HS, Alex AB, Pollock A, et al. A new derivative of valproic acid amide possesses a broad-spectrum antiseizure profile and unique activity against status epilepticus and organophosphate neuronal damage. Epilepsia. 2012;53:134–146. doi: 10.1111/j.1528-1167.2011.03338.x. [DOI] [PMC free article] [PubMed] [Google Scholar]
- 30.Yoneyama M, Kitayama T, Taniura H, et al. Immersion fixation with Carnoy solution for conventional immunohistochemical detection of particular N-methyl-D-aspartate receptor subunits in murine hippocampus. J Neurosci Res. 2003;73:416–426. doi: 10.1002/jnr.10622. [DOI] [PubMed] [Google Scholar]
- 31.Eyigor O, Minbay Z, Cavusoglu I, et al. Localization of kainate receptor subunit GluR5-immunoreactive cells in the rat hypothalamus. Brain Res Mol Brain Res. 2005;136:38–44. doi: 10.1016/j.molbrainres.2005.01.015. [DOI] [PubMed] [Google Scholar]
- 32.Zack GW, Rogers WE, Latt SA. Automatic measurement of sister chromatid exchange frequency. J Histochem Cytochem. 1977;25:741–753. doi: 10.1177/25.7.70454. [DOI] [PubMed] [Google Scholar]
- 33.Dunkley PR, Jarvie PE, Robinson PJ. A rapid Percoll gradient procedure for preparation of synaptosomes. Nature protocols. 2008;3:1718–1728. doi: 10.1038/nprot.2008.171. [DOI] [PubMed] [Google Scholar]
- 34.Nakamura Y, Iga K, Shibata T, et al. Glial plasmalemmal vesicles: a subcellular fraction from rat hippocampal homogenate distinct from synaptosomes. Glia. 1993;9:48–56. doi: 10.1002/glia.440090107. [DOI] [PubMed] [Google Scholar]
- 35.Nakamura Y, Kubo H, Kataoka K. Uptake of transmitter amino acids by glial plasmalemmal vesicles from different regions of rat central nervous system. Neurochem Res. 1994;19:1145–1150. doi: 10.1007/BF00965148. [DOI] [PubMed] [Google Scholar]
- 36.Stigliani S, Zappettini S, Raiteri L, et al. Glia re-sealed particles freshly prepared from adult rat brain are competent for exocytotic release of glutamate. J Neurochem. 2006;96:656–668. doi: 10.1111/j.1471-4159.2005.03631.x. [DOI] [PubMed] [Google Scholar]
- 37.Riddle EL, Topham MK, Haycock JW, et al. Differential trafficking of the vesicular monoamine transporter-2 by methamphetamine and cocaine. Eur J Pharmacol. 2002;449:71–74. doi: 10.1016/s0014-2999(02)01985-4. [DOI] [PubMed] [Google Scholar]
- 38.Ben-Ari Y, Cossart R. Kainate, a double agent that generates seizures: two decades of progress. Trends in neurosciences. 2000;23:580–587. doi: 10.1016/s0166-2236(00)01659-3. [DOI] [PubMed] [Google Scholar]
- 39.Tauck DL, Nadler JV. Evidence of functional mossy fiber sprouting in hippocampal formation of kainic acid-treated rats. J Neurosci. 1985;5:1016–1022. doi: 10.1523/JNEUROSCI.05-04-01016.1985. [DOI] [PMC free article] [PubMed] [Google Scholar]
- 40.Fernaud-Espinosa I, Nieto-Sampedro M, et al. Differential activation of microglia and astrocytes in aniso- and isomorphic gliotic tissue. Glia. 1993;8:277–291. doi: 10.1002/glia.440080408. [DOI] [PubMed] [Google Scholar]
- 41.Kálmán M. Glia reaction and reactive glia. Adv Molec Cell Biol. 2003;31:787–835. [Google Scholar]
- 42.Bernardinelli Y, Magistretti PJ, Chatton JY. Astrocytes generate Na+-mediated metabolic waves. Proc Natl Acad Sci U S A. 2004;101:14937–14942. doi: 10.1073/pnas.0405315101. [DOI] [PMC free article] [PubMed] [Google Scholar]
- 43.Chatton JY, Pellerin L, Magistretti PJ. GABA uptake into astrocytes is not associated with significant metabolic cost: implications for brain imaging of inhibitory transmission. Proc Natl Acad Sci U S A. 2003;100:12456–12461. doi: 10.1073/pnas.2132096100. [DOI] [PMC free article] [PubMed] [Google Scholar]
- 44.Pellerin L, Magistretti PJ. Glutamate uptake into astrocytes stimulates aerobic glycolysis: a mechanism coupling neuronal activity to glucose utilization. Proc Natl Acad Sci U S A. 1994;91:10625–10629. doi: 10.1073/pnas.91.22.10625. [DOI] [PMC free article] [PubMed] [Google Scholar]
- 45.Bezzi P, Carmignoto G, Pasti L, et al. Prostaglandins stimulate calcium-dependent glutamate release in astrocytes. Nature. 1998;391:281–285. doi: 10.1038/34651. [DOI] [PubMed] [Google Scholar]
- 46.Fellin T, Pascual O, Gobbo S, et al. Neuronal synchrony mediated by astrocytic glutamate through activation of extrasynaptic NMDA receptors. Neuron. 2004;43:729–743. doi: 10.1016/j.neuron.2004.08.011. [DOI] [PubMed] [Google Scholar]
- 47.Parpura V, Basarsky TA, Liu F, et al. Glutamate-mediated astrocyte-neuron signalling. Nature. 1994;369:744–747. doi: 10.1038/369744a0. [DOI] [PubMed] [Google Scholar]
- 48.Fellin T, Gomez-Gonzalo M, Gobbo S, et al. Astrocytic glutamate is not necessary for the generation of epileptiform neuronal activity in hippocampal slices. J Neurosci. 2006;26:9312–9322. doi: 10.1523/JNEUROSCI.2836-06.2006. [DOI] [PMC free article] [PubMed] [Google Scholar]
- 49.Tian GF, Azmi H, Takano T, et al. An astrocytic basis of epilepsy. Nat Med. 2005;11:973–981. doi: 10.1038/nm1277. [DOI] [PMC free article] [PubMed] [Google Scholar]
- 50.Cornell-Bell AH, Finkbeiner SM, Cooper MS, et al. Glutamate induces calcium waves in cultured astrocytes: long-range glial signaling. Science. 1990;247:470–473. doi: 10.1126/science.1967852. [DOI] [PubMed] [Google Scholar]
- 51.Montana V, Malarkey EB, Verderio C, et al. Vesicular transmitter release from astrocytes. Glia. 2006;54:700–715. doi: 10.1002/glia.20367. [DOI] [PubMed] [Google Scholar]
- 52.Porter JT, McCarthy KD. Hippocampal astrocytes in situ respond to glutamate released from synaptic terminals. J Neurosci. 1996;16:5073–5081. doi: 10.1523/JNEUROSCI.16-16-05073.1996. [DOI] [PMC free article] [PubMed] [Google Scholar]
- 53.Scemes E, Giaume C. Astrocyte calcium waves: what they are and what they do. Glia. 2006;54:716–725. doi: 10.1002/glia.20374. [DOI] [PMC free article] [PubMed] [Google Scholar]
- 54.Petravicz J, Fiacco TA, McCarthy KD. Loss of IP3 receptor-dependent Ca2+ increases in hippocampal astrocytes does not affect baseline CA1 pyramidal neuron synaptic activity. J Neurosci. 2008;28:4967–4973. doi: 10.1523/JNEUROSCI.5572-07.2008. [DOI] [PMC free article] [PubMed] [Google Scholar]
- 55.Lee SH, Magge S, Spencer DD, et al. Human epileptic astrocytes exhibit increased gap junction coupling. Glia. 1995;15:195–202. doi: 10.1002/glia.440150212. [DOI] [PubMed] [Google Scholar]
- 56.Manning TJ, Jr., Sontheimer H. Spontaneous intracellular calcium oscillations in cortical astrocytes from a patient with intractable childhood epilepsy (Rasmussen's encephalitis) Glia. 1997;21:332–337. [PubMed] [Google Scholar]
- 57.Das A, Wallace GCt, Holmes C, et al. Hippocampal tissue of patients with refractory temporal lobe epilepsy is associated with astrocyte activation, inflammation, and altered expression of channels and receptors. Neuroscience. 2012;220:237–246. doi: 10.1016/j.neuroscience.2012.06.002. [DOI] [PMC free article] [PubMed] [Google Scholar]
- 58.Bahn S, Volk B, Wisden W. Kainate receptor gene expression in the developing rat brain. J Neurosci. 1994;14:5525–5547. doi: 10.1523/JNEUROSCI.14-09-05525.1994. [DOI] [PMC free article] [PubMed] [Google Scholar]
- 59.Ritter LM, Vazquez DM, Meador-Woodruff JH. Ontogeny of ionotropic glutamate receptor subunit expression in the rat hippocampus. Brain Res Dev Brain Res. 2002;139:227–236. doi: 10.1016/s0165-3806(02)00572-2. [DOI] [PubMed] [Google Scholar]
- 60.Darstein M, Petralia RS, Swanson GT, et al. Distribution of kainate receptor subunits at hippocampal mossy fiber synapses. J Neurosci. 2003;23:8013–8019. doi: 10.1523/JNEUROSCI.23-22-08013.2003. [DOI] [PMC free article] [PubMed] [Google Scholar]
- 61.Fogarty DJ, Perez-Cerda F, Matute C. KA1-like kainate receptor subunit immunoreactivity in neurons and glia using a novel anti-peptide antibody. Brain Res Mol Brain Res. 2000;81:164–176. doi: 10.1016/s0169-328x(00)00179-0. [DOI] [PubMed] [Google Scholar]


