

Abstract
Introduction: Novel therapies for myocardial infarction (MI) involving stem cells, gene therapy, biomaterials, or revascularization strategies have shown promise in animal studies and clinical trials, but results have been limited partially due to the injection of therapeutics into ischemic myocardium that cannot support their mechanism of action. Accurate targeting of therapeutics precisely to the infarct border zone (BZ) may be essential for effective repair of the ischemic heart.
Methods: Ischemia‐reperfusion MI was induced in Yorkshire swine by inflation of an angioplasty balloon in the left anterior descending coronary artery. Fluorescent microspheres were injected into the BZ under NOGA catheter guidance, and this location was identified grossly then examined by immunohistochemistry and Western analysis.
Results: Analysis of the infarct zone two hours post‐MI revealed a frankly necrotic region devoid of contractile proteins with marked activation of caspase‐3. The NOGA‐defined BZ closely approximates the grossly‐defined BZ and contains intact myocytes and vasculature. Western analysis detected Akt expression and levels of Ca2+ handling proteins equivalent to that of viable tissues.
Conclusions: Histological and Western analysis revealed that NOGA mapping precisely identifies grossly and molecularly defined infarct BZ at a location where there are still viable cells and vessels capable of supporting novel therapeutic strategies. Clin Trans Sci 2012; Volume 5: 416–421
Keywords: myocardial infarction, translational research, cardiac
Introduction
There are many new therapies for acute myocardial infarction (MI) including stem cell (SC) therapy, biomaterials, gene therapy, and revascularization strategies. All have shown promise, but more precise targeting of therapeutics to the infarct border zone (BZ) could dramatically improve their results. SC therapies that replace myocytes lost to MI have demonstrated moderate functional improvements in animal 1 , 2 and clinical trials, 3 , 4 , 5 but cell retainment is poor 6 and improvements are limited due, in part, to injection of cells into ischemic tissues incapable of supporting engraftment and survival. SCs require vascular support for viability and physical contact with endogenous myocytes for differentiation. Coupling to the endogenous electrical network via gap junctions 7 , 8 and receipt of mechanical stimulus 9 are both necessary for differentiation. Thus, it is widely accepted that precise delivery of SCs at the BZ is essential for improving SC therapies. 10 , 11
Biomaterials have also shown potential for improving post‐MI cardiac function by reducing stress of the infarct‐related wall, enhancing SC retainment, or delivery of cardioprotective protein or gene therapeutics. 10 Gene therapy with the pro‐angiogenic factor vascular endothelial growth factor (VEGF), 12 or the paracrine mediator SC‐derived factor‐1α, 13 have also shown to improve function in the ischemic heart. All of these treatments would benefit from precise delivery to the BZ, where there remain viable tissues capable of generating a functional response.
NOGA 3D electromechanical mapping (EMM, Biosense Webster, Diamond Bar, CA, USA) has been utilized to identify the BZ using changes in ventricular conduction and contractility. 14 EMM was used in past clinical trials to target revascularization strategies to the BZ, including VEGF gene therapy 15 and transmyocardial laser revascularization. 16 EMM is currently being used in clinical SC trials for treating ischemic heart disease 17 and refractory angina. 18 EMM systems are advantageous for detection of the BZ over other cardiac imaging modalities (i.e., echo or MRI), in that voltage measurements indicate the health of the local myocardium: a unipolar potential difference of >15 mV is typical of viable myocardium, <5 mV is typical of nonviable/infarcted myocardium, and 5–15 mV is typical of the ischemic BZ. 14 Our study utilized NOGA EMM to delineate the infarct BZ, which was compared to the BZ identified at autopsy. This area was further defined by histological and Western analysis to determine if it contained functionally viable tissues capable of responding to therapeutic intervention.
Methods
Animals and anesthesia
All animal procedures were approved by our Institutional Animal Care and Use Committee. Yorkshire swine aged 6 months weighing 35–40 kg were used. Anesthesia was induced using 6.0 mg/kg intramuscular tiletamine/zolazepam (Telazol; Fort Dodge Animal Health, Fort Dodge, IA, USA) and maintained using 5 mg/kg/hour intravenous propofol (Diprivan, AstraZeneca, Wilmington, DE, USA). Animals were intubated and maintained on assist control ventilation (tidal volume = 10–12 mL/kg, respiratory rate = 12–16 breaths/min, positive end‐expiratory pressure = 5 cmH2O, inspiratory:expiratory ratio = 1:2). Blood oxygenation was monitored using continuous pulse oximetry and arterial blood gas samples taken every 30 minutes. Ventilation was adjusted to maintain arterial pH = 7.35–7.45 and PCO2 = 35–45 mmHg. Sustained acidosis was corrected using 0.75 mEq/kg doses of sodium bicarbonate. Electrocardiogram (EKG) was monitored throughout the procedure to detect arrhythmias requiring medical intervention.
Coronary angiography
The right femoral artery was cannulated using an 8 French percutaneous sheath (Boston Scientific, Natick, MA, USA). To prevent thrombosis, heparin was given at a loading dose of 75 U/kg and maintenance doses of 30 U/kg every 30 minutes. The left coronary artery was engaged using a 6 French JR4 guide catheter (Boston Scientific) under fluoroscopy, and coronary angiography was performed using Omnipaque 300 contrast (Nycomed‐Amersham, New York, NY, USA).
Ischemia‐reperfusion MI model
Pigs were pretreated with 1 mg/kg amiodarone. A 3.0 × 12 mm Maverick angioplasty catheter was advanced over a Choice floppy guidewire (Boston Scientific) into the left‐anterior descending coronary artery and inflated to occlude blood flow to the anteroapical wall of the left ventricle (LV). ST‐segment elevation on EKG was used to assess onset of infarction. The balloon was inflated for 90 minutes of ischemia then deflated for reperfusion. Advanced cardiac life support was used to treat arrhythmias. The onset of sustained ventricular tachycardia was treated with 1 mg/kg amiodarone or 50 mg intravenous lidocaine.
NOGA 3D left ventricular electromechanical mapping and injection
NOGA mapping was conducted at baseline and post‐MI using an 8 French NOGA mapping catheter advanced into the LV. Maps were constructed after making contact with the endocardium at 80–100 discrete points. End‐diastolic (EDV), end‐systolic volumes (ESV) and stroke volume (SV) were calculated from these maps using NOGA software. After reperfusion, the Myostar injection catheter (Biosense Webster) was used with NOGA guidance to perform transendocardial injection of fluorescent microspheres into the BZ. Location of the microspheres was identified after sacrifice under ultraviolet light.
Transthoracic echocardiography
Transthoracic echocardiography (echo) was performed at baseline and post‐MI using an Agilent Sonos 5500 sonograph. Short‐ and long‐axis images were obtained in 2D mode, and M‐mode images were obtained in short axis. All measurements including end‐diastolic diameter (EDD), end‐systolic diameter (ESD), EDV, ESV, ejection fraction (EF), and fractional shortening (FS) were calculated following the American Society of Echocardiography guidelines. 19
Gross morphometric analysis
Cardiectomy was performed under general anesthesia 2 hours post‐MI. The ventricles were sectioned into 10 short‐axis slices and the thickness of each slice was measured. The basal surface of each slice was photographed using a Nikon DS‐F11 camera. The gross area at risk (AAR), identified as red and inflamed tissues, was measured using NIH Image J software. Volume at risk (VAR) was calculated by multiplying AAR of each slice by its thickness. VAR of each heart was determined by the adding the VAR of all slices.
Tissue processing
Once tissue sections were photographed, two adjacent short‐axis sections from midway through the infarct zone were selected for Western and histological analysis. The LV wall was cut into ten 1 cm long transmural samples, which were numbered 0–9 starting from the anterior wall/interventricular septum (AW/IVS) junction. The 10 samples from one section were flash frozen in liquid nitrogen and stored at −80°C for protein analysis. The 10 samples from the second section were immersion‐fixed in 10% formalin for 24–48 hours for histology then stored in 70% ethanol overnight.
Histology
Fixed tissue samples were processed and embedded in paraffin blocks that were cut into 5 μm‐thick sections and mounted on glass slides (AML Laboratories, Baltimore, MD, USA). Hemotoxylin and eosin (H&E) staining was used for bright‐field microscopy. For immunohistochemistry, slides underwent deparaffinization then antigen retrieval in hot citrate buffer. Slides were immunostained with antibodies to α‐sarcomeric actin, α‐smooth muscle actin and laminin (Sigma, St. Louis, MO, USA), and von Willebrand Factor (Abcam, Cambridge, MA, USA). Nuclei were labeled with 4’6‐diaminidino‐2‐phenylindole (DAPI). All photographs were taken using a Nikon Eclipse T1 microscope.
Western blot analysis
LV tissues were analyzed for protein abundance and levels of phosphorylation using Western analysis. 20 Target antigens were probed with the following antibodies: phospholamban (PLB: Millipore, Billerica, MA, USA), ryanodine receptor (RyR: Thermo Scientific, Rockford, IL, USA), phospho‐S6 ribosomal protein, caspase‐3 and active caspase‐3 (Cell Signaling, Beverly, MA, USA), α‐sarcomeric actin (Sigma), glyceraldehyde 3‐phosphate dehydrogenase (AbD Serotec, Kidlington, UK), phospho‐serine 16 PLB (PS16‐PLB), phospho‐threonine 17 PLB (PT17‐PLB) and phospho‐serine 2808 RyR (PS2808‐RyR, Badrilla, Leeds, UK).
Statistical analysis
Paired student’s t‐test was used to examine differences between paired groups. Analysis of variance was used to examine differences between nonpaired groups. A p‐value of less than 0.05 was considered significant. All data are expressed as mean ± standard error of mean (SEM).
Results
Cardiac functional analysis
Transthoracic echo, NOGA EMM, and gross morphometry were performed on five MI animals and two sham‐operated animals. Echo demonstrated a decline in cardiac function after MI ( Table 1 ). LV EF and FS were both significantly diminished, and EDV and ESV were significantly increased. These changes were confirmed by EMM ( Table 2 ), which calculated significant declines in EF and SV. EMM measured a slight increase in EDV and significant increase in ESV post‐MI. Gross morphometry ( Table 3 ) revealed that MI affected 24.0 ± 2.6 mL of ventricular myocardium by volume. With a total ventricular volume of 112.7 ± 14.6 mL, 17.5% of ventricular myocardium was damaged by the ischemia‐reperfusion (IR) insult. The LV had a greater proportion of volume at risk (22.0%) compared to the RV (6.6%).
Table 1.
Transthoracic echocardiography.
| Baseline | Ischemia‐reperfusion | p Value | |
|---|---|---|---|
| EF (%) | 65.6%± 1.6% | 39.9%± 3.5% | 0.001 |
| FS (%) | 42.1%± 1.4% | 31.3%± 3.2% | 0.007 |
| EDV (mL) | 40.9 ± 3.1 | 55.0 ± 2.2 | 0.001 |
| ESV (mL) | 14.0 ± 1.0 | 32.8 ± 1.4 | <0.001 |
Table 2.
NOGA 3D electromechanical mapping.
| Baseline | Ischemia‐reperfusion | p Value | |
|---|---|---|---|
| EF (%) | 66.9%± 1.5% | 34.6%± 2.2% | 0.0001 |
| SV (mL) | 33.2%± 4.8% | 19.7%± 1.5% | 0.02 |
| EDV (mL) | 50.0 ± 8.1 | 55.7 ± 4.9 | 0.14 |
| ESV (mL) | 16.8 ± 3.4 | 36.2 ± 3.9 | <0.0001 |
Table 3.
Infarct volume at risk analysis.
| Volume at risk (mL) | Viable volume (mL) | % At risk | |
|---|---|---|---|
| LV | 21.4 ± 2.6 | 76.0 ± 11.1 | 22.0% |
| RV | 2.6 ± 0.45 | 36.7 ± 5.0 | 6.6% |
| Total | 24.0 ± 2.6 | 112.7 ± 14.6 | 17.5% |
NOGA versus gross identification of the BZ
Using the NOGA‐guided MYOSTAR injection catheter, fluorescent microspheres were delivered to the BZ identified on EMM. After short‐axis sectioning of the heart, the microspheres were identified grossly under ultraviolet light. Figure 1 shows the close approximation of the microspheres (green) with the BZ (outlined in blue), showing that the NOGA‐defined BZ corresponds closely with the grossly‐identified BZ, which was confirmed in all animals.
Figure 1.

Diagram of the tissue processing for Western analysis and histology. Following cardiectomy and sectioning of the heart, one short‐axis cross‐section from midway through the infarct was selected, and the left ventricle wall was sliced into 10 transmural segments (numbered 0–9) as shown above. The area at risk is highlighted in blue, and the grossly identified location of the injected fluorescent microspheres is marked in green.
Histological evaluation of the BZ
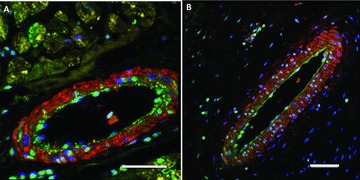
Figure 2 shows H&E staining of three regions of myocardium under bright‐field microscopy: viable myocardium (segments 5–9), BZ (segment 3–4), or infarct zone (segments 0–2). Viable myocardium shows clearly intact cell structure, while myocytes in the BZ begin to break down into frankly necrotic tissues. At the infarct core, a complete loss of myocytes was found, with intact extracellular matrix and vasculature. The vasculature within the infarct core had continuous smooth muscle and endothelial cell layers that could not be distinguished from vasculature within the normal portions of the heart. Immunohistochemistry was used to further characterize the degree of injury. Figure 3 shows an immunostain against α‐sarcomeric actin (red) and laminin (green) of myocardium within viable tissues ( Figure 3A ) or at the BZ ( Figure 3B ). The infarct zone was negative for the cardiac contractile protein α‐sarcomeric actin, documenting the necrosis of the resident myocytes. Laminin, a protein that maintains cell membrane structure, is mostly absent from the infarct zone, except for areas surrounding vasculature where the laminin‐positive basal lamina appears to remain intact.
Figure 2.

H&E staining under light microscopy of the pig heart two hours after infarction. (A) Viable myocardium (tissue segments 5–9, defined in Figure 1), (B) border zone (segments 3–4), (C) infarct zone (segments 0–2). Scale bars = 50 μm.
Figure 3.

Immunofluorscent histology of the infarcted pig heart showing laminin (green), a‐sarcomeric actin (red), and DAPI immunostaining. (A) Blood vessel within the viable tissue, (B) blood vessels at the infarct border zone. Scale bars = 50 μm.
To further define the viability of BZ vasculature, samples were immunostained for α‐sarcomeric actin (yellow), α‐smooth muscle actin (red), and von Willebrand Factor (green). Figure 4A shows a medium‐sized artery typical of viable myocardium. Myocardial viability is evidenced by the presence of α‐sarcomeric actin‐positive cardiomyocytes. This vessel shows a clearly defined, α‐smooth muscle actin‐positive tunica media and a continuous von Willebrand Factor‐positive endothelium characteristic of an intact vessel. Figure 4B shows a medium‐sized artery typical of those observed at the BZ. Ischemic damage is evidenced by the absence of α‐sarcomeric actin‐positive cardiomyocytes. DAPI‐positive nuclei outside the blood vessel in Figure 4B are likely from dead myocytes or infiltrating inflammatory cells. Like the viable artery in Figure 4A , the BZ artery also shows clearly defined α‐smooth muscle actin‐positive tunica media and continuous von Willebrand Factor‐positive endothelium, consistent with a viable vascular structure.
Figure 4.
Immunofluorscent histology of the infarcted pig heart showing smooth muscle actin (red), a‐sarcomeric actin (yellow), von Willebrand factor (green), and DAPI (blue). (A) Blood vessel within viable myocardium, (B) blood vessel at the infarct border zone. Scale bars = 50 μm.
Protein expression at the BZ
Western analyses of samples taken from the infarct zone (segments 0,1), BZ (segment 3), or viable zone (segments 5, 7, and 9) are shown in Figure 5 . To assess cardiac myocyte viability, myocyte Ca2+ handling proteins were analyzed: ryanodine receptor (RyR), phospholamban (PLB) and their relative phosphorylation levels. Akt, caspase‐3, and S6 ribosomal protein activity were analyzed to assess cell survival, apoptosis, and translational activity, respectively. In the infarct zone, the abundance of PLB was low, and RyR was undetectable. Phosphorylation of PLB serine‐16 (PS16‐PLB), the site phosphorylated by protein kinase A (PKA), 21 , 22 was nearly undetectable. In contrast, abundant phosphorylation at threonine‐17 (PT17‐PLB) was detected at segment 1. Threonine‐17 is known to be phosphorylated by Ca2+‐dependant calmodulin‐kinase II (CamKII). 21 , 23 Phosphorylation of S6‐ribosomal protein, a marker of protein translation, 24 was undetectable in the infarct zone. Phosphorylation of Akt, a cardiomyocyte prosurvival factor, 25 was nearly undetectable, while caspase‐3, a marker for apoptosis, 26 was markedly activated throughout the infarct core. Activation of the pro‐survival factor Akt was detectable at the BZ, although lower than in viable tissue, and the level of activated caspase‐3 was high relative to viable zones. Ca2+ regulatory proteins were found in normal abundance in the MI BZ and the phosphorylation state of these proteins was similar to that observed in viable tissues.
Figure 5.

Protein expression at the infarct border zone: phosphorylated‐serine‐2808 (PS2808) ryanodine receptor (RyR), glyceraldehyde 3‐phosphate dehydrogenase (GAPDH), phosphorylated‐S6 ribosomal protein (pS6‐ribosomal protein), phosphorylated‐serine‐16 (PS16) or phosphorylated‐threonine‐17 (PT17) phospholambam (PLB).
Discussion
Acute MI is currently treated with revascularization, which can improve outcomes but cannot reverse the scope of injury. The permanently damaged heart undergoes remodeling and many patients risk progression to heart failure. 29 , 30 Novel therapies that could reverse this injury are needed, and the location where therapeutics are delivered will influence their efficacy. Gross identification, histology, and Western analysis were used to evaluate the BZ, since this is the best region for therapeutics to contact viable myocardium and exert the greatest impact. Fluorescent microsphere injection confirmed that the NOGA system accurately delivered therapeutics in close proximity to the BZ. It should be noted that because our IR model generates pronounced electromechanical changes, precise identification of BZ in patients with more ambiguous ischemic injury, such as subendocardial or stuttering MIs, may prove more difficult.
Light microscopy revealed intact myocytes and vasculature. Immunofluorescent staining demonstrated spared basal lamina with intact smooth muscle and endothelial cell layers, confirming that blood vessels in the BZ retained normal structure and could provide blood flow to support injected SCs or therapeutics.Western analysis of the infarct core revealed a region devoid of myocytes (undetectable RyR) that would be unsupportive of neovascularization or SC viability. IR injury is known to cause myocytes to depolarize and uncouple from their neighbors, which increases cytosolic Ca2+, inducing Ca2+‐overload that can directly cause myocyte necrosis or apoptosis. 27 , 28 In viable tissues, elevated intracellular calcium can result from excessive adrenergic stimulation, which can lead to increased downstream PKA activity (S16‐PLB phosphorylation) and concomitant activation of CamKII (T17‐PLB phosphorylation). The appearance of T17 phosphorylation by CamKII without evidence of S16 phosphorylation by PKA (as seen in the infarct zone, Figure 5 ), suggests Ca2+‐overload as the result of ischemic insult rather than excessive adrenergic stimulus. This conclusion is supported by caspase‐3 activation and decreased translational activity (reduced phospho‐S6‐ribosomal protein abundance) across the infarct zone.
At the BZ, levels of Ca2+ regulatory proteins (RyR and PLB) were comparable to viable tissues, as were levels of PS2808‐RyR, S16‐, and T17‐PLB. These findings show evidence of viable myocytes at the BZ that could provide the physical contact and stimulus needed to support cardiac repair with novel therapeutics. Although the BZ still contains cells at risk of death (with increased levels of T17‐PLB phosphorylation and caspase‐3 activation), which could exacerbate infarct expansion, there nevertheless remains histological evidence of viable myocytes and vasculature in addition to detection of the pro‐survival factor Akt, supporting the conclusion that the BZ still contains some viable tissues.
Thus, at two hours post‐MI, the majority of myocytes in the infarct zone are necrotic or undergoing apoptosis, while the NOGA‐defined BZ represents a mixed population of myocytes: some have undergone necrotic death, some are at risk of apoptosis, but others have survived. Tissues just 1 cm inside the infarct zone are almost completely necrotic and devoid of functional Ca2+ handling proteins while tissues 1 cm away from the ischemic zone appear normal. Therefore, therapeutics designed to have beneficial impact on the damaged heart will need to be delivered into the appropriate region of the heart. Our studies document that NOGA mapping precisely defines BZ where enough intact myocytes and vasculature remain to support novel therapeutics.
References
- 1. Orlic D, Kajstura J, Chimenti S, Jakoniuk I, Anderson SM, Li Baosheng, Pickel J, McKay R, Nadal‐Ginard B, Bodine DM, et al Bone marrow cells regenerate infarcted myocardium. Nature . 2001: 410; 701–705. [DOI] [PubMed] [Google Scholar]
- 2. Bearzi C, Rota M, Hosoda T, Tillmanns J, Nascimbene A, De Angelis A, Yasuzawa‐Amano S, Trofimova I, Siggins RW, Lecapitaine N, et al Human cardiac stem cells. Proc Nat Acad Sci USA. 2007: 104(35); 14068–14073. [DOI] [PMC free article] [PubMed] [Google Scholar]
- 3. Wollert KC, Meyer GP, Lotz J, Ringes‐Lichtenber S, Lippolt P, Breidenbach C, Fichter S, Korte T, Hornig B, Messinger D, et al Intracoronary autologous bone‐marrow cell transfer after myocardial infarction: the BOOST randomised controlled clinical trial. Lancet. 2004: 364; 141–148. [DOI] [PubMed] [Google Scholar]
- 4. Schachinger V, Erbs S, Elsasser A, Haberbosch W, Hambrecht Rainer, Holschermann H, Yu J, Corti R, Mathey DG, Hamm CQ, et al Intracoronary bone marrow‐derived progenitor cells in acute myocardial infarction. N Engl J Med . 2006: 355(12); 1210–1221. [DOI] [PubMed] [Google Scholar]
- 5. Bolli R, Chugh AR, D’Amario D, Loughran JH, Stoddard MF, Ikram S, Beache GM, Wagner SG, Leri A, Hosoda T, et al Cardiac stem cells in patients with ischaemic cardiomyopathy (SCIPIO): initial results of a randomized phase 1 trial. Lancet. 2011: 378(9806); 1847–1857. [DOI] [PMC free article] [PubMed] [Google Scholar] [Retracted]
- 6. Hou D, Youssef EA, Brinton TJ, Zhang P, Rogers P, Price ET, Yeung AC, Johnstone BH, Yock PG, March KL. Radiolabeled cell distribution after intramyocardial, intracoronary, and interstitial retrograde coronary venous delivery: implications for current clinical trials. Circulation . 2005; 112: I150–I156. [DOI] [PubMed] [Google Scholar]
- 7. Rota M, Kajstura J, Hosoda T, Bearzi C, Vitale S, Esposito G, Iaffaldano G, Padin‐Iruegas ME, Gonzalez A, Rizzi R, et al Bone marrow cells adopt the cardiomyogenic fate in vivo. Proc Nat Acad Sci USA. 2007: 104(45); 17783–17788. [DOI] [PMC free article] [PubMed] [Google Scholar]
- 8. Xu M, Wani M, Dai YS, Wang J, Yan M, Ayub A, Ashraf M. Differentiation of bone marrow stromal cells into the cardiac phenotype requires intercellular communication with myocytes. Circulation. 2004: 110(17); 2658–2665. [DOI] [PubMed] [Google Scholar]
- 9. Tulloch NL, Muskheli V, Razumova MV, Korte SF, Regnier M, Hauch KD, Pabon L, Reinecke H, Murry CE. Growth of engineered human myocardium with mechanical loading and vascular coculture. Circ Res. 2011; 109(1): 47–59. [DOI] [PMC free article] [PubMed] [Google Scholar]
- 10. Segers VFM, Lee RT. Biomaterials to enhance stem cell function in the heart. Circ Res. 2011; 109(8): 910–922. [DOI] [PubMed] [Google Scholar]
- 11. Ngyuen PK, Lan F, Wang Y, Wu JC. Imaging: Guiding the clinical translation of cardiac stem cell therapy. Circ Res. 2011; 109: 962–979. [DOI] [PMC free article] [PubMed] [Google Scholar]
- 12. Losordo DW, Vale PR, Symes JF, Dunnington CH, Esakof DD, Maysky M, Ashare AB, Lathi K, Isner JM. Gene therapy for myocardial angiogenesis: initial clinical results with direct myocardial injection of phVEGF165 as sole therapy for myocardial ischemia. Circulation . 1998; 98(25): 2800–2804. [DOI] [PubMed] [Google Scholar]
- 13. Zhang M, Mal N, Kiedrowski M, Chacko M, Askari AT, Popovic ZB, Koc ON, Penn MS. SDF‐1 expression by mesenchymal stem cells results in trophic support of cardiac myocytes after myocardial infarction. FASEB J . 2007; 21(12): 3197–3207. [DOI] [PubMed] [Google Scholar]
- 14. Gyongyosi M, Dib N. Diagnostic and prognostic value of 3D NOGA mapping in ischemic heart disease. Nat Rev Cardiol . 2011; 8: 393–404. [DOI] [PubMed] [Google Scholar]
- 15. Losordo DW, Vale PR, Hendel RC, Milliken CE, Fortuin FD, Cummings N, Schatz RA, Asahara T, Isner JM, Kuntz RE. Phase 1/2 placebo‐controlled, double‐blind, dose‐escalating trial of myocardial vascular endothelial growth factor 2 gene transfer by catheter delivery in patients with chronic myocardial ischemia. Circulation . 2002; 105(17): 2012–2018. [DOI] [PubMed] [Google Scholar]
- 16. Gyongyosi M, Glogar HD. Non‐fluoroscopic catheter‐based endocardial mapping and mapping‐guided percutaneous transmyocardial revascularization. Austrian J Kardiol . 2001: 8; 503–508. [Google Scholar]
- 17. Willerson JT, Perin EC, Ellis SG, Pepine CJ, Henry TD, Zhao DX, Lai D, Penn MS, Byrne BJ, Silva G, et al Intramyocardial injection of autologous bone marrow mononuclear cells for patients with chronic ischemic heart disease and left ventricular dysfunction (First Mononuclear Cells injected in the US [FOCUS]): rationale and design. Am Heart J . 2010; 160: 215–223. [DOI] [PMC free article] [PubMed] [Google Scholar]
- 18. Losordo DW, Henry TD, Davidson C, Lee JS, Costa MA, Bass T, Mendelsohn F, Fortuin DF, Pepine CJ, Traverse JH, et al Intramyocardial, autologous CD34+ cell therapy for refractory angina. Circ Res. 2011; 209(4): 428–436. [DOI] [PMC free article] [PubMed] [Google Scholar]
- 19. Schiller NB, SP, Crawford M, DeMaria A, Devereux R, Feigenbaum H, Gutgesell H, Reichek N, Sahn D, Schnittger I. Recommendations for quantitation of the left ventricle by two‐dimensional echocardiography. American Society of Echocardiography Committee on Standards, Subcommittee on Quantitation of Two‐Dimensional Echocardiograms. J Am Soc Echocardiogr . 1989; 5(2): 358–367. [DOI] [PubMed] [Google Scholar]
- 20. Kubo H, Marulies KB, Piacentino V III, Gaughan JP, Houser SR. Patients with end‐stage congestive heart failure treated with beta‐adrenergic receptor antagonists have improved ventricular myocyte calcium regulatory protein abundance. Circulation. 2001; 104(9): 1012–1018. [DOI] [PubMed] [Google Scholar]
- 21. Hagemann D, Kuschel M, Kuramochi T, Zhu W, Cheng H, Xiao RP. Frequency‐encoding Thr17 phospholamban phosphorylation is independent of Ser16 phosphorylation in cardiac myocytes. J Biol Chem. 2000; 275: 22532–22536. [DOI] [PubMed] [Google Scholar]
- 22. Port JD, Bristow MR. Altered beta‐adrenergic receptor gene regulation and signaling in chronic heart failure. J Mol Cell Cardiol. 2001; 33: 887–905. [DOI] [PubMed] [Google Scholar]
- 23. Mundina‐Weilenmann C, Said M, Vittone L, Ferrero P, Mattiazzi A. Phospholamban phosphorylation in ischemia‐reperfused heart. Effect of pacing during ischemia and response to a beta‐adrenergic challenge. Mol Cell Biochem. 2003; 252: 239–246. [DOI] [PubMed] [Google Scholar]
- 24. Peterson RT, Schreiber SL. Translation control: connecting mitogens and the ribosome. Curr Biol . 1998; 8(7): R248–R250. [DOI] [PubMed] [Google Scholar]
- 25. Rota M, Boni A, Urbanek K, Padin‐Iruegas E, Kajstura TJ, Fiore G, Kubo H, Sonnenblick EH, Musso E, Houser SR. Nuclear targeting of Akt enhances ventricular function and myocyte contractility. Circulation Research. 2005; 97: 1332–1341. [DOI] [PubMed] [Google Scholar]
- 26. Fernandes‐Alnemri T, Litwack G, Alnemri ES. CPP32, a novel human apoptotic protein with homology to Caenorhabditis elegans cell death protein Ced‐3 and mammalian interleukin‐1 beta‐converting enzyme. J Biol Chem. 1994; 269(49): 30761–30764. [PubMed] [Google Scholar]
- 27. Communal C, Singh K, Pimentel DR, Colucci WS. Norepinephrine stimulates apoptosis in adult rat ventricular myocytes by activation of the b‐adrenergic pathway. Circulation . 1998; 98: 1329–1334. [DOI] [PubMed] [Google Scholar]
- 28. Shizukuda Y, Buttrick PM, Geenen DL, Borczuk AC, Kitsis RN, Sonnenblick EH. b‐adrenergic stimulation causes cardiocyte apoptosis: influence of tachycardia and hypertrophy. Am J Physiol Heart Circ Physiol . 1998; 275: H961–H968. [DOI] [PubMed] [Google Scholar]
- 29. Braunwald E. Myocardial reperfusion, limitation of infarct size, reduction of left ventricular dysfunction, and improved survival: should the paradigm be expanded? Circulation. 1989; 79: 441–444. [DOI] [PubMed] [Google Scholar]
- 30. Pfeffer MA, Braunwald E. Ventricular remodeling after myocardial infarction: experimental observations and clinical implications. Circulation. 1990; 81: 1161–1172. [DOI] [PubMed] [Google Scholar]