Abstract
Medical images constitute a core portion of the information a physician utilizes to render diagnostic and treatment decisions. At a fundamental level, this diagnostic process involves two basic processes: visually inspecting the image (visual perception) and rendering an interpretation (cognition). The likelihood of error in the interpretation of medical images is, unfortunately, not negligible. Errors do occur, and patients’ lives are impacted, underscoring our need to understand how physicians interact with the information in an image during the interpretation process. With improved understanding, we can develop ways to further improve decision making and, thus, to improve patient care. The science of medical image perception is dedicated to understanding and improving the clinical interpretation process.
When people think about imaging in medicine, radiology is typically the first specialty that comes to mind, and, in fact, that is where most of the image perception research has taken place. However, medical imaging covers a much broader range of medical specialties, including cardiology, radiation oncology, pathology, and ophthalmology. Pathology has traditionally been limited to the glass-slide specimen images rendered by the microscope for the pathologist to view. With the advent of digital slide scanners in recent years, however, virtual slides viewed on computer displays are becoming more prevalent, not only for telepathology applications, but also in everyday reading (Weinstein et al., 2009). Ophthalmology has used images (35-mm film prints or slides) for years for evaluating such conditions as diabetic retinopathy. However, digital acquisition devices and high-performance color displays are increasingly being used by ophthalmology screeners—especially those screening for diabetic retinopathy. Telemedicine has fostered an entirely new area, in which medical images are being acquired, transferred, and stored to diagnose and treat patients (Krupinski et al., 2002). Teledermatology, teleophthalmology, telewound/burn care, and telepodiatry are all using images on a regular basis for store-and-forward telemedicine applications. Real-time applications such as telepsychiatry, teleneurology, and telerheumatology similarly rely on video images for diagnostic and treatment decisions.
With about a billion radiological imaging exams performed worldwide every year, radiology is clearly the leader in medical imaging volume. There are a variety of exam types, including projection X-ray images (e.g., bone, chest, mammography); dynamic X-ray exams (e.g., fluoroscopy); multislice exams, such as computed tomography (CT) and magnetic resonance imaging (MRI); nuclear medicine; ultrasound; and, more recently, molecular imaging (Thakur, 2009). The pervasiveness of medical imaging can be studied in a number of ways: One approach is to look at how much money is spent yearly on healthcare and then divide out the amount devoted to medical imaging (Beam, Krupinski, Kundel, Sickles, & Wagner, 2006). In Beam et al.’s analysis, data from 2004 from the Centers for Medicare and Medicaid Services showed that approximately 16% ($1.6 trillion) of the gross domestic product (GDP) is allotted to national healthcare expenditures. Medicare expenditures represent 17% of national healthcare expenditures, of which Part B (43%) accounts for the nonfacility or physician-related expenditures. Approximately 8% (nearly $10 billion) of Part B constitutes physician-based imaging procedures. Imaging also accounts for over 40% of all hospital procedures reported in the discharge report, according to the Agency for Healthcare Research and Quality. On the basis of Medicaid Part B spending alone, it could be conservatively determined that imaging procedures comprise 8% of non-Medicaid Part B health spending, so medical imaging in the U.S. alone is estimated to be about $56 billion, or 0.5% of the GDP! For mammography alone, with 1 billion imaging exams performed worldwide every year and an average of four images per exam, an average of 120 medical image perception events take place every second!
It is impossible to cover every facet of medical image perception, but this article provides a bit of a historical perspective and highlights some of the important areas where perception, in particular, is the research focus. More detailed reviews of the field of medical image perception can be found in The Handbook of Medical Image Perception and Techniques (Samei & Krupinski, 2010) and The Handbook of Medical Imaging: Volume 1. Physics and Psychophysics (Beutel, Kundel, & Van Metter, 2000).
Assessing Diagnostic Performance
Diagnostic accuracy refers to how well a system or test predicts the presence or absence of a disease or health condition or how well it measures the extent or magnitude of that disease or condition. Clearly, perception and cognition are at the core of the interpretation process and, thus, impact diagnostic performance. The tools used to assess diagnostic performance are, therefore, quite integral to the study of medical image perception. Evaluating diagnostic performance typically involves statistical figures of merit, such as sensitivity, specificity, positive and negative predictive values, and the receiver operating characteristic (ROC) curve, with ROC being perhaps the most common. In the early 1950s, progress was made in fields outside of medicine that have impacted system and observer-performance evaluation in medical imaging. Based on principles from signal-detection theory, ROC analysis was developed by researchers from such diverse fields as engineering, psychology, and mathematics. Excellent reviews of the ROC techniques used in medical image perception research, as well as of the unique contributions made to the development of new techniques by the medical image perception community, can be found in Krupinski and Jiang (2008) and in Chakraborty (2010), Hillis (2010), and Tourassi (2010).
These reviews already do an excellent job of summarizing the history of ROC analysis in medical imaging and of describing the fundamental theory and methods, so they will not be reviewed here. However, it is useful perhaps to highlight some of the important ways in which ROC analysis in medical imaging differs from that in classical visual psychophysics. First is the issue of target location. In classical psychophysics, test images typically contain a single target, and the observer’s task is to report whether or not that target is present. In medical imaging, this general indication of whether or not a given case/image contains a lesion/target is often used, but researchers have acknowledged the fact that the clinical reality is much different. Radiologists (and other clinicians interpreting different types of medical images) generally need to indicate the location of the lesion. Location is important, for example, if a biopsy needs to be done, as determined by the image interpretation. The location information cannot be used by traditional ROC analysis, and its neglect can lead to a loss of statistical power; also, differences among modalities, treatments, and other factors may go undetected.
To deal with this problem, three location specific approaches have been proposed. They are the free-response paradigm (Bunch, Hamilton, Sanderson, & Simmons, 1978), the location ROC paradigm (Starr, Metz, Lusted, & Goodenough, 1975; Starr, Metz, Lusted, Sharp, & Herath, 1977; Swensson, 1996; Swensson & Judy, 1981), and the region-of-interest paradigm (Obuchowski, Lieber, & Powell, 2000; Rutter, 2000). Chakraborty (1989, 2010), Chakraborty and Berbaum (2004), and Chakraborty and Winter (1990), in particular, have made significant advances in free-response ROC (FROC), alternative free-response ROC (AFROC), and jackknife AFROC (JAFROC) methodologies for evaluating observer performance with location data included in the ROC analysis. Each approach has been validated and subsequently used in a variety of imaging research projects.
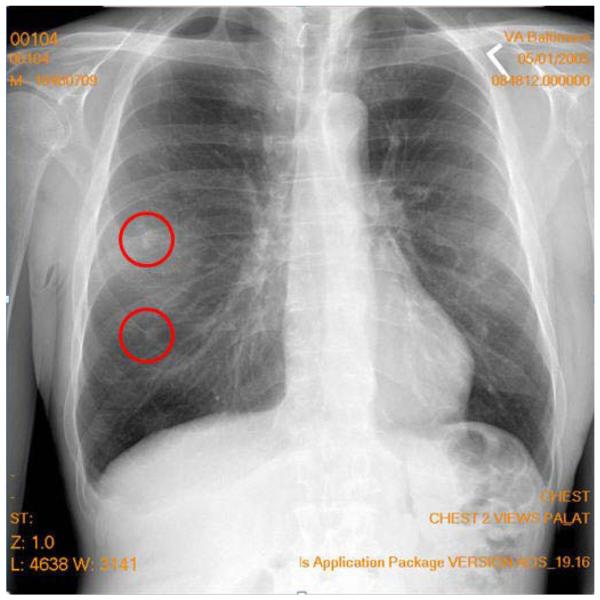
The second important difference is that, in classical psychophysics, there is the possibility of having a multiple- instead of a single-target report. Clinically, images can have multiple lesions either of the same type or of different types. Figure 1 shows a chest image with two target reports made by a radiologist searching for lung tumors. In this case, the upper circle represents a true tumor (true positive) and the bottom circle represents a false positive (false alarm) report (not a true tumor). Traditional ROC analysis cannot deal with multiple reports per image or with false positives on the same image as a true positive and/or false negative (miss). The FROC, AFROC, and JAFROC techniques developed by Chakraborty and colleagues (Chakraborty, 1989, 2010; Chakraborty & Berbaum, 2004; Chakraborty & Winter, 1990) were designed to address this issue. In particular, the JAFROC method has been gaining in popularity in medical imaging research.
Figure 1.
A typical projection X-ray chest image with two marks made by a radiologist indicating locations of suspected tumors. The upper circle represents a true tumor (true positive), and the bottom circle represents a false positive (false alarm) report (not a true tumor).
A third area where medical imaging performance analysis differs from conventional ROC is the number of possible underlying distributions or discriminations that must be made. Conventional ROC has two possible states: target-present or target-absent. In medical imaging, the situation can be more complex. For example, in mammography, there can be normal images (no target lesion), images with a malignant mass or microcalcification cluster, and images with a benign mass or microcalcification cluster. Instead of the straightforward two-class problem, it is now a three-class problem. Multiclass problems exist as well, and, in recent years, researchers such as He and Frey (2009), He, Gallas, and Frey (2010), and Edwards and Metz (2007) have been investigating the theory and practical application of the multiclass ROC problem in medical imaging applications.
Images and Image Quality
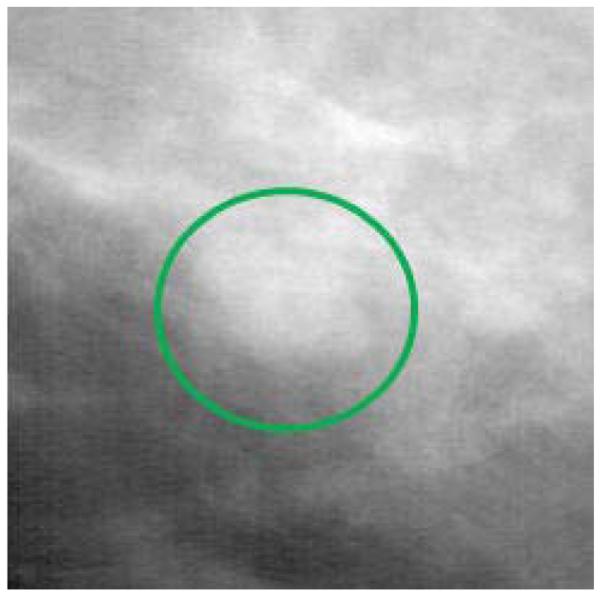
As has already been noted, most of the work in medical image perception has been done in the field of radiology. What makes radiology images unique? There are a number of factors that make them unique. The main difference between projection radiographic images (e.g., chest and bone X-rays) and pictures, paintings, photographs, and other types of images people are familiar with is that a radiographic image is a translucent, 2-D representation of the 3-D anatomy, created from the shadows of the absorption pattern of X-rays passing through the body. The detection and recognition of lesion targets is difficult because the various anatomical structures overlap in the image, and the radiologist must translate this 2-D image into a 3-D mental representation in order to properly disembed and localize structures and lesions. This overlap of structures has a camouflaging effect. Abnormalities, such as tumors, do not simply grow in a vacuum or carve out a space in the anatomy. They grow within and around the existing anatomy, and many of their features can be very similar in appearance and structure to normal anatomic variations. Figure 2 shows a portion of a mammogram in which a mass has developed, clearly illustrating how lesions grow within the existing anatomy. The malignant mass is the white blob in the circle, and the other white structures in the image represent normal breast tissue, showing how normal and abnormal structures often look very similar. An examination of Figure 1 also shows how the body structures in a chest image overlay each other and have the potential to camouflage lesion targets.
Figure 2.
A portion of a mammogram in which a malignant mass (white blob within the circle) has developed, clearly illustrating how lesions grow within the existing anatomy. The other white structures in the image represent normal breast tissue, illustrating how normal and abnormal structures often look very similar.
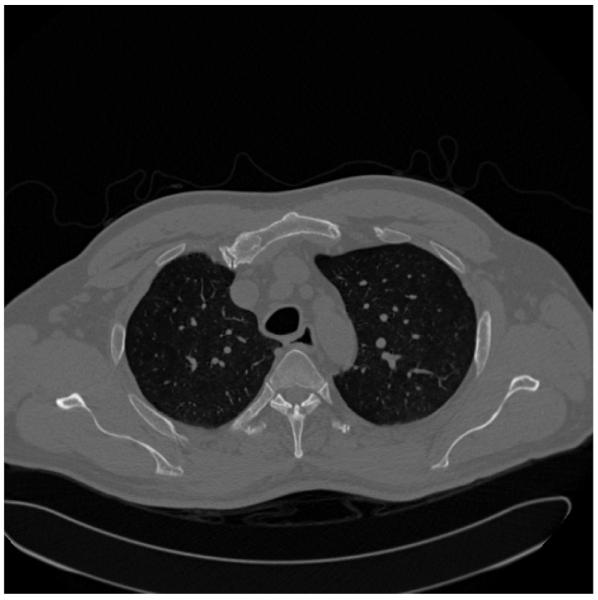
Computed tomography (CT) and magnetic resonance imaging were developed to help get around this 2-D/3-D problem, but they have their own limitations. These modalities acquire numerous images (sometimes in the thousands) that are thin slices through the anatomy (see Figure 3). This reduces the amount of anatomic overlap, but now the radiologist needs to view all of the slices in order to detect any abnormalities, while trying to “fuse” them into a single mental representation of the entire 3-D anatomic region being imaged. For example, in Figure 3, the two dark areas with white speckles in the central area are the lungs (dark) with blood vessels (white speckles) running through them. As the radiologist views subsequent slices, a picture of the 3-D lung structure evolves, and the linear extent of the individual blood vessels can be discerned. In a single slice, however, it is difficult to tell whether a single white speckle is a tumor visible in only that slice or a blood vessel that will extend beyond that slice through the others.
Figure 3.
A typical CT slice through the chest. Imagine the patient lying flat on a table, so that the bottom of the image is his or her back and the white structures that look like a “Y” are the spine. The black areas in the center with the white speckles are the lungs, and the white speckles are blood vessels going through the plane of the paper. The gray outer areas represent mostly muscle and body fat.
The topic of how to measure image quality and its relation to the interpretation of images has a long history in medical image perception. Although simple physical measures, such as signal-to-noise ratio, can be used as metrics of image quality, these types of measures rarely take into account the observer or the task that needs to be performed using the images. In their Foundations of Image Science, Barrett and Myers (2003) provide an excellent treatise on the topic of medical image quality assessment and the importance of objective task-based metrics. The book presents a comprehensive treatment of the principles, mathematics, and statistics needed to understand and evaluate imaging systems, with particular emphasis on the use of mathematical model observers (e.g., ideal observer models). In addition, Abbey and Eckstein (2010), Kupinski (2010), and Burgess (2010a, 2010b, 2010c) provide detailed information on observer models and the image quality metrics. The Burgess chapters, in particular, provide a historical account of the research done on characterizing the human visual system, with particular emphasis on the role of noise and signal detection theory.
Errors in Interpretation
Medical imaging technologies are extremely varied, making the study of the interpretation of the images produced quite varied as well, and a bit of a challenge. Images can be grayscale or color, high-resolution or low-resolution, hard copy or soft copy, uncompressed or compressed (lossy, where data are actually eliminated and not recovered in the compressed version, or lossless, where all of the data are retained), acquired with everything from sophisticated dedicated imaging devices to off-the-shelf digital cameras. Because there is so much imaging in modern medicine, significant attention and interest have been paid to the technological aspects of imaging operations (e.g., hardware and software). Less appreciated are the perceptual and cognitive processes underlying interpretation (Manning, Gale, & Krupinski, 2005) and the fact that there is significant inter- and intraobserver variation in the interpretation of medical images (Beam, Conant, & Sickles, 2003; Beam, Conant, Sickles, & Weinstein, 2003).
Medical images need to be interpreted because they are not self-explanatory. Medical images vary considerably, even within a particular exam type. Anatomical structures can camouflage features of clinical interest. For example, a lung tumor may be partially covered by a rib or hidden behind the heart. Lesions can have very low prevalence, affecting the decision-making process. For example, in mammography screening, there is typically one cancer detected per every 1,000 cases read. Essentially, there are notable variations from case to case, with a multiplicity of abnormalities and normal features that the interpreter needs to be mindful of.
These complexities can lead to interpretation errors. Clinicians do make mistakes (Berlin, 2005, 2007, 2009). In radiology alone, estimates suggest that, in some areas, there may be up to a 30% miss rate and an equally high false positive rate. Errors can also occur in the recognition of an abnormality (e.g., whether a lesion is benign or malignant, or whether it is pneumonia or an alveolar collapse known as atelectasis). Errors can have significant impact on patient care, causing delays or misdiagnoses. The contribution of the inherent limitations of human perception to these errors is the focus of much research, but it is still not very well understood or appreciated. Image perception is likely the most prominent, yet least appreciated, source of error in diagnostic imaging. The frequency of image reading errors in malpractice litigation is just one example of this ignorance. Error is just one reason to study medical image perception.
Causes of Error
Before we can develop ways to avoid or ameliorate errors, it is necessary to understand the nature and causes of interpretation error. The seminal work in this area was begun back in the 1940s, when a groundbreaking series of studies was carried out to determine which of four radiographic and fluoroscopic techniques was best for screening tuberculosis (Birkelo et al., 1947; Garland, 1949). The expectation was that one imaging technique would be clearly superior to the others; but the degrees of intra- and interobserver variation were found to be so large that it was impossible to determine which technique was optimal. Additional studies demonstrated a surprisingly large amount of reader variation—even when radiologists were asked to do something as straightforward as describing the physical characteristics of radiographic shadows (Newell, Chamberlain, & Rigler, 1954). From these and related studies, two critical problems were obvious: Systems were needed for improving radiologists’ performance and reducing interpretation variability, and methods had to be developed for evaluating systems and their impact on observer performance. These findings led to the dedicated study of medical perception in radiology and the critical interplay between the radiologist, the image, and image quality.
Soon after these early studies observing variability and the resulting errors in the interpretation of radiographic images, researchers sought to understand their sources, in order to rectify or, at least, reduce them. In the early 1960s, Tuddenham and Calvert (Tuddenham, 1962, 1963; Tuddenham & Calvert, 1961) had radiologists shine a spotlight with a variable diameter at a series of radiographs printed to paper. They were instructed to adjust the diameter of the spotlight to no larger than what was needed for comfortable and accurate interpretation. They were then instructed to use the spotlight to search the images. These spotlight paths were recorded with a 16-mm camera, and the paths were used as a surrogate for assessing the search patterns. They found considerable variation between the observers, as well as intrapersonal variation. With respect to errors (i.e., missing the lesion targets), the spotlight patterns suggested that lesions may be missed due to inadequate search of the images (Tuddenham & Calvert, 1961).
Kundel and colleagues (Kundel, Nodine, & Carmody, 1978) built upon these findings and used more sophisticated eye position recording to study visual search. These studies culminated in a further classification of types of omission errors (i.e., misses) that has endured into modern medical image perception research. In Kundel et al.’s (1978) study, eye position was recorded while 3 radiologists and 1 nonexperienced observer experienced in searching for chest tumors read a series of 10 chest films with a single simulated 1-cm tumor. The useful visual field was assumed to have a radius of 2.8°. The eye-position data revealed that the tumors that were reported (true positives) had an initial dwell time of 0.56 sec (SD = 0.04). Taking 2 SDs below the mean, the threshold for detecting a tumor was 0.48 sec.
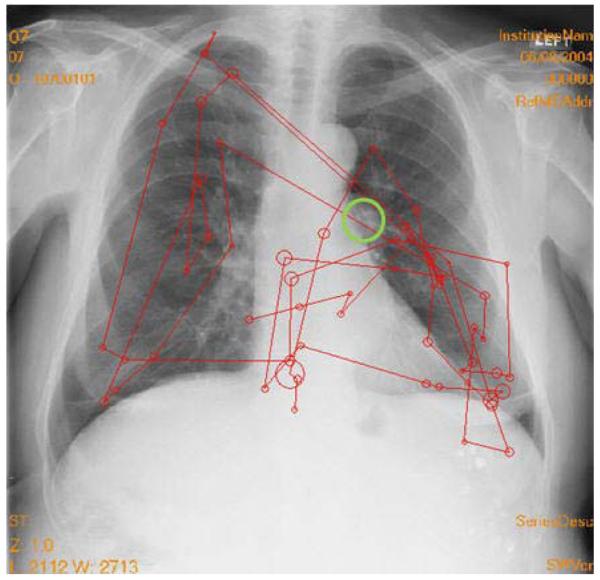
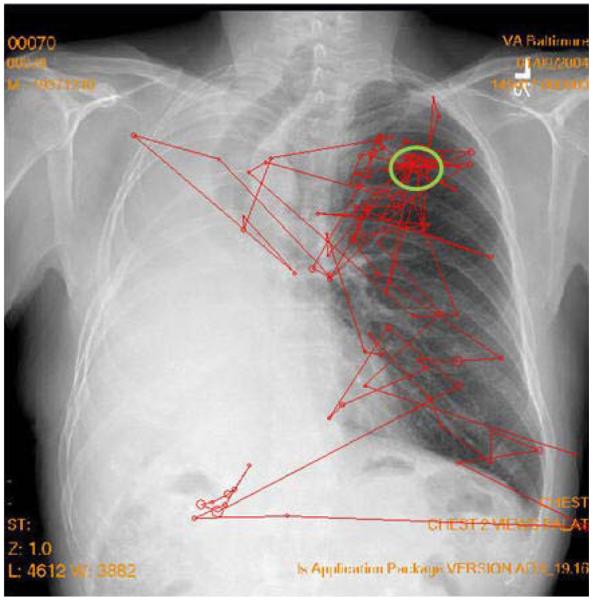
Following the analysis of these search data, false negative omission errors were classified into three categories on the basis of visual dwell times. Approximately one third of the omission errors fall into each category. The first category comprises search errors: The radiologist never fixates on the lesion within the useful visual field and does not report it (see Figure 4). The second type of error is the recognition error: Lesions are fixated, but below the threshold (0.48 sec) considered sufficient to recognize the ambiguity in the image. Finally, decision errors occur when the radiologist fixates the lesion for long periods of time (over the 0.48-sec threshold), but either does not consciously recognize the features or actively dismisses them (see Figure 5). This breakdown of errors has been noted in chest (Kundel, Nodine, & Krupinski, 1989), bone (Hu, Kundel, Nodine, Krupinski, & Toto, 1994; Lund, Krupinski, Pereles, & Mockbee, 1997), and mammography images (Krupinski, 1996; Nodine, Mello-Thoms, Kundel, & Weinstein, 2002). Minor modifications in the threshold have been used and reflect the nature of the image and task being studied.
Figure 4.
Example of a search error. The tumor is in the large circle on the lung on the right. The other circles indicate the locations where the eyes landed and dwell time was built up. The lines show the eyetracking record. Larger circles indicate longer dwell times. The lines indicate the order in which the fixation clusters were generated. The observer never fixated the tumor and did not report it.
Figure 5.
Example of a decision error. The tumor is in the large oval near the top of the lung on the right. There are numerous fixations on the tumor, but the observer failed to report the tumor. The right lung (left side of the image) is missing. Since the task was to search for lung tumors, search on that side was minimal.
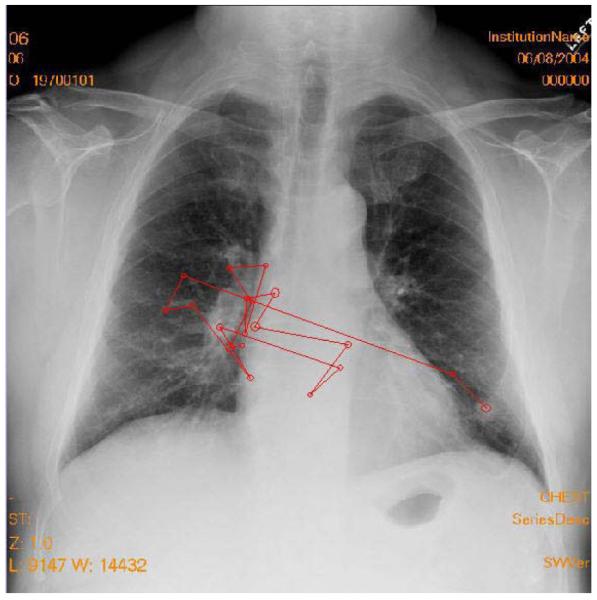
As has already been noted, interpretation errors can be caused by a host of psychophysical processes. Abnormalities can be camouflaged by normal structures (i.e., anatomical noise), which has been estimated to affect lesion detection threshold by an order of magnitude (Samei, Flynn, & Kearfott, 1997). Visual search, necessitated by the limited angular extent of the high-fidelity foveal vision of the human eye, can also contribute to errors. It is generally agreed upon that interpretation is preceded by a global impression or gist, and visual search then moves the eyes around the image to closely examine image details (Nodine & Kundel, 1987). Figure 6 shows a typical search pattern of someone who detects the lesion target very quickly and with a single fixation.
Figure 6.
Typical search pattern of someone who detects the lesion target very quickly. The observer started on the left side of the image, then detected the nodule on the right side and quickly scanned to that side with a single fixation on the tumor before terminating search and reporting the tumor as present. The total search time was 2.4 sec.
Visual search studies have also highlighted the role of peripheral vision during interpretation, with interplay between foveal and peripheral vision as the observer scans the scene (Kundel, 1975). These and other studies (e.g., Hu et al., 1994; Krupinski, 1996; Lund et al., 1997; Manning, Ethell, & Donovan, 2004) have demonstrated that there are characteristic dwell times associated with correct and incorrect decisions and that these times are influenced by the nature of the diagnostic task and idiosyncratic observer search patterns (Kundel, 1989). True and false positives tend to be associated with longer dwell times than false negatives, which, in turn, tend to have longer dwell times than true negatives. The fact that about two thirds of missed lesions attract visual scrutiny has led to investigations that have successfully used dwell-time data to feed these areas of visual interest back to radiologists, resulting in significant improvements in detection performance without associated increases in false positives (Krupinski, Nodine, & Kundel, 1998; Nodine et al., 1999).
Satisfaction of search (SOS) can also contribute to errors. In SOS, once an abnormality is detected and recognized, it takes additional diligence to look for other possible abnormalities within an image (Berbaum, Franken, Caldwell, & Schartz, 2010; Smith, 1967; Tuddenham, 1962, 1963). Sometimes, this extra effort is not taken, and subsequent lesions in the same image or case are missed. Estimates of SOS errors vary, but they range from one fifth to one third of misses in radiology and possibly as high as 91% in emergency medicine (for a review, see Berbaum et al., 2010). Berbaum and colleagues (Berbaum, Dorfman, Franken, & Caldwell, 2000; Berbaum et al., 2010) have studied this problem in depth and found that premature termination of search is generally not the root cause of SOS; rather, faulty pattern recognition and/or faulty decision making seem to be the more likely culprits.
Image Quality and Perception
Image quality can also contribute to errors. Thus, it is important to understand how best to assess image quality and its impact on perception in order to optimize quality and minimize error (Krupinski & Jiang, 2008). Studies have focused on the impact of image acquisition, imaging hardware, image processing, image display, and reading environment on image quality and diagnostic accuracy.
Is diagnostic accuracy or reader efficiency improved when the display is optimized? It is impossible to review all of the studies on display technology and medical image perception, but a few representative examples on the more important display properties are reviewed. Early efforts in this area focused on comparing film with soft-copy displays, with an emphasis on measuring diagnostic accuracy and visual search behaviors, as measured using eye position recording techniques (i.e., display review; see Krupinski & Kallergi, 2007). The transition from film to soft-copy reading resulted in the examination of a number of physical display properties to determine whether they influence diagnostic accuracy and visual search efficiency. It was found that increased display luminance and a perceptually linearized display do lead to better diagnostic accuracy and more efficient visual search. The effectiveness and use of image processing and the role reader’s experience have also been found to play important roles in the interpretation of medical images (i.e., expertise review; see Nodine & Mello-Thoms, 2010).
More recently, Saunders, Baker, Delong, Johnson, and Samei (2007) examined the effects of different resolution and noise levels on task performance in digital mammography. Results with human observers showed that decreasing display resolution had little effect on classification accuracy and individual diagnostic task performance, but increasing noise caused classification accuracy to decrease by a statistically significant 21% as the X-ray dose to the breast went to one quarter of its normal clinical value. These noise effects were most prominent for the tasks of microcalcification detection and mass discrimination. It was concluded that quantum noise appears to be the dominant image quality factor in mammography, that it is perceptible, and that it affects interpretation accuracy.
Radiologists are currently asking another important question: What bit depth is required in a display? This is an important question from a perceptual point of view, since it relates directly to visual capacity: Exactly how many gray levels can we perceive, and does it always matter? Most commercial and medical-grade monitors manufactured today display only 8 bits (256 gray levels) of data. This is sufficient for medical image interpretation tasks in which the acquired data are 8 bits or less, but many medical images are acquired at higher bit depths (e.g., 12–16 bits, or 4,096–6,553 gray levels; Chunn & Honeyman, 2000). Because of this disparity, all acquired gray levels cannot be displayed at once, even with high-performance mammography displays with 1,024 levels of gray. The result is a potentially significant loss of information during the diagnostic interpretation process, when window/level is not utilized, and in the potential for artifacts to be introduced when down-sampling images to 8-bit depth. Additionally, the uses of window and level to manipulate the displayed gray levels can slow down the interpretation process, adversely affecting workflow.
From a perceptual perspective, higher bit-depth displays may or may not improve performance. Clinicians take in a lot of information during the initial view of an image (i.e., the gestalt or global percept). It is possible that, if more gray levels are available in this initial view, the initial impression may yield more information. More information may reduce the need for excessive windowing and leveling, reducing the time needed by the clinician to render a diagnosis. However, evidence indicates that the human visual system can detect only about 1,000 gray levels (far below 4,096–6,553 gray levels) at luminance levels currently used in medical-grade monitors; consequently, displaying more gray levels may not be useful (Barten, 1992, 1999).
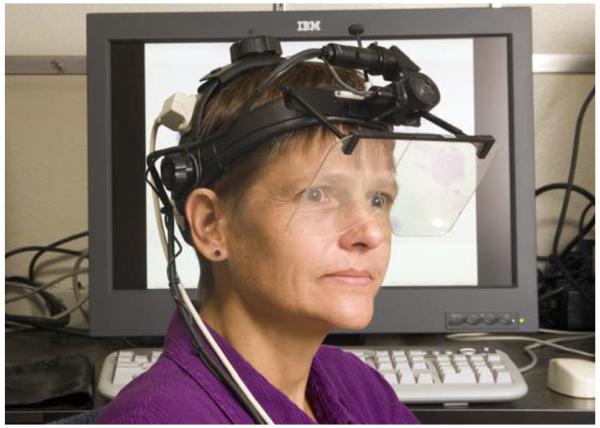
A recent study (Krupinski et al., 2007) that examined bit depth illustrates a typical perception study on the impact of display on observer performance in radiology. The study used three sets of 8-bit and 11-bit 3-MP, monochrome, portrait-mode, medical-grade LCD monitors. One hundred direct digital radiography chest images (General Electric Revolution XQ/I System) were used: 50 nodule-free cases and 50 cases with subtle solitary pulmonary nodules (verified by CT). Three study sites participated, each with 6 radiologists who viewed all 100 images twice: once on the 8-bit monitor and once on the 11-bit monitor. The observers decided whether or not a nodule was present, then gave their confidence in that decision. The confidence data were analyzed using the multiple-reader multiple-case ROC technique (Dorfman, Berbaum, & Metz, 1992). Window/level use during interpretation was recorded, as was total viewing time. Visual search efficiency was measured on a subset of images at one site using the 4000SU eyetracker (Applied Science Labs, Bedford, MA). Figure 7 shows an observer in the eye position recording setup. The eye-position data characterized time to first fixate a lesion, total search time, and dwell times associated with each decision type (true and false, positive and negative).
Figure 7.
An observer in the eye position recording setup.
The study revealed no statistically significant difference in ROC area under the curve (Az) performance, as a function of 8-bit versus 11-bit depth. Average Az for the 8-bit display was .8284, and average performance for the 11-bit display was .8253. There were no statistically significant differences between the 8-bit and 11-bit displays for any of the three systems. There were no differences in the percentages of cases on which window/level was used. Preference for window/level seemed to be an individual trait: Some readers used it, and some did not, but each individual reader used it about the same with both displays.
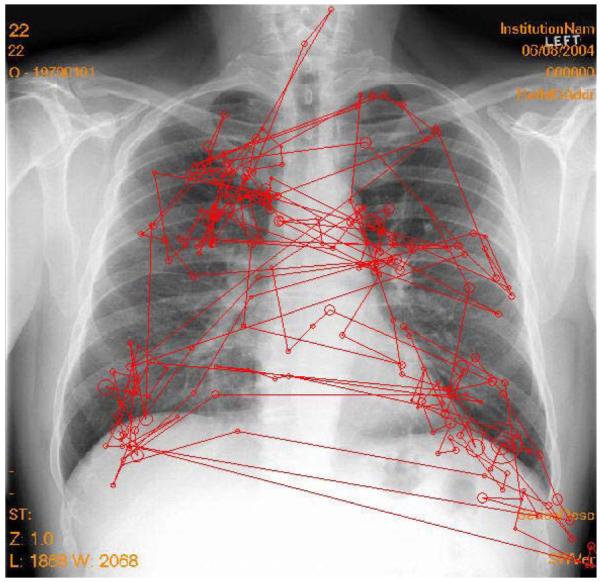
Figure 8 shows a typical search pattern from the eye-position part of the study. Total viewing times were significantly shorter for the 11-bit than for the 8-bit displays. Time to first hit the nodules during search was shorter with the 11-bit than with the 8-bit display for true positive and false negative decisions, although the differences did not reach statistical significance.
Figure 8.
A typical search pattern of a radiologist searching a chest image for nodules. The circles represent fixations (where the size reflects dwell: increased size = longer dwell), and the lines indicate the order in which the fixations were generated.
Cumulative dwell times were also examined for true positive, false negative, false positive, and true negative decisions. For the 11-bit display, cumulative dwell times for each decision category were lower than they were for the 8-bit display, and the differences for true negative decisions reached significance. Although search efficiencies may not seem important, search inefficiency adds up over an entire day’s worth of reading numerous images, and the result is fewer images being read in the same amount of time, as compared with displays that have been optimized to the user’s visual-system capabilities. The present study is just one of many that have evaluated the optimization of displays for the interpretation of medical images. Clearly, both diagnostic accuracy and interpretation efficiency are important variables to consider when optimizing displays for medical imaging.
Where Can Psychology Influence Medical Image Perception?
A very interesting area where psychology research and theory could be of significant help to medical imaging research and clinical practice is color perception. Color displays are becoming an important modality, both in radiology and in other clinical specialties, such as dermatology, pathology, and ophthalmology, where the object and, hence, image data are inherently in color.
For example, we conducted a teledermatology study using 308 cases, each diagnosed in person and then via digitally acquired images displayed on a color monitor (Krupinski et al., 1999). It was found that there was 85% concordance between in-person and digital interpretation; the dermatologists generally rated image color as being excellent or good. There was a clear relationship between rated image color quality and performance. Cases rated as having only fair or poor color quality on the display monitor resulted in significantly more differences in diagnostic accuracy for the digital images than for the gold-standard, in-person diagnoses. The development of color calibration standards, guided by knowledge about color properties and color perception, would be of significant benefit to the medical imaging community.
In pathology, display considerations involve another unique aspect of medical image perception: What draws attention, and can that information be used to design better, more efficient display systems? For example, digitized pathology slides, or virtual slides, are very large. A single image can require as much as 1 GB of storage space, depending on the size of the scanned area, and the challenge is to display all of this information to the pathologist in an efficient manner, so that a correct diagnosis can be rendered. In a recent perception study (Krupinski et al., 2006), we used eyetracking to determine where pathologists initially look at a virtual slide. Is search random, or are the eyes attracted to regions of diagnostic interest? The goal was to determine whether there is a way to preselect diagnostically relevant regions of interest for initial display, leaving the rest of the image off the display, unless it is actively accessed.
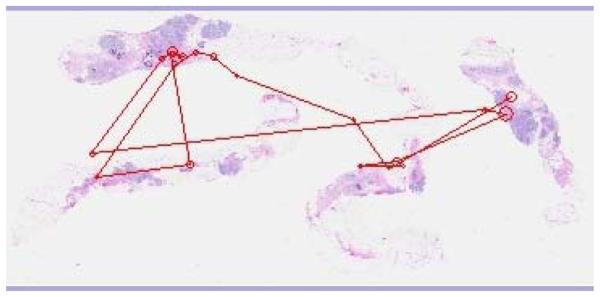
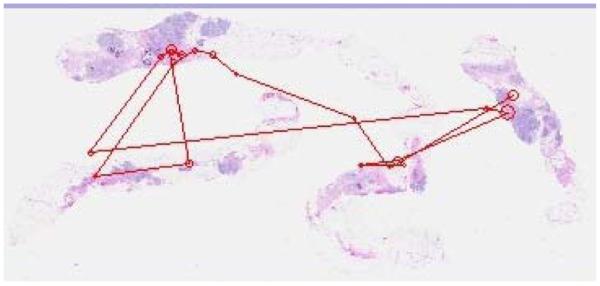
For this study, a set of 20 breast-core biopsy surgical pathology cases (half benign and half malignant) were digitized using the DMetrix DX-40 virtual slide processor. Low-magnification images (i.e., those for which the full slide was not zoomed to any particular region; average size, 39.55 × 23.4 cm) were shown on a 9-MP color LCD (IBM T221). Three pathologists, 3 pathology residents, and 3 medical students (postsophomore fellows) were observers. Their eye position was recorded while they viewed the slides, and they were told to select the top three locations that they would want to zoom onto if they were going to view the image in greater detail in order to render a diagnostic decision. Figure 9 shows a typical search pattern generated by an experienced pathologist, and Figure 10 shows one generated by a typical resident.
Figure 9.
Typical search pattern of an experienced pathologist.
Figure 10.
Typical search pattern of a pathology resident.
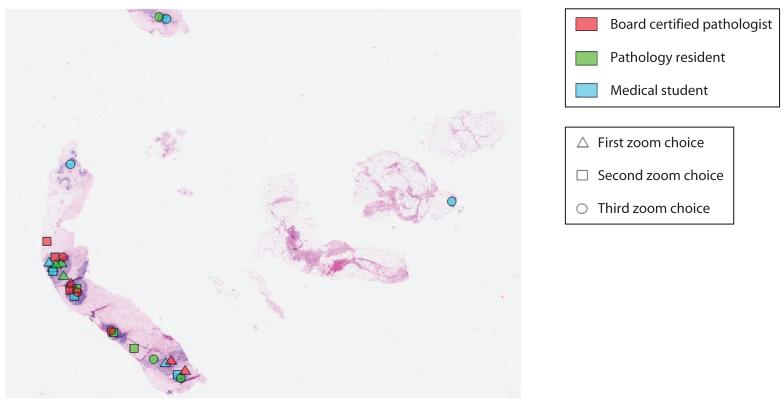
Two analyses were carried out. The first determined whether the locations selected were common to more than 1 observer or were selected by only 1 observer. The second analysis looked at all marked locations to determine whether they contained diagnostically relevant information. If only 1 person marked a location, it was considered sporadic, and locations marked by more than 1 person were considered common (see Figure 11). There were significantly more common than sporadic locations marked per image. On average, there were 4.40 common locations per image and 1.45 sporadic locations per image. The pathologists, residents, and medical students selected 20%, 43%, and 37% of the sporadic locations, respectively. To determine whether the preferred zoom locations were clinically meaningful, a senior pathologist reviewed each location. Ninety-two percent contained diagnostically relevant information (85% of the malignant lesions and 95% of the benign lesions). For areas without relevant information, 55% were selected by medical students, 36% by residents, and 10% by pathologists.
Figure 11.
A typical pathology image with preferred zoom locations marked by the pathologists (dark gray), residents (medium gray), and postsophomore fellows (light gray). Triangles indicate the first location preferred, squares the second preferred, and circles the third preferred. The single dot on the right is considered a “sporadic” location; the clusters of dots on the left piece of tissue are all considered “common” locations.
The pathologists viewed each image for significantly less total time (M = 4.471 sec) than did the residents (M = 7.148 sec) or the medical students (M = 11.861 sec). It is clear that the preferred zoom locations were identified very quickly. Although all of the observers were able to extract sufficient information in the initial global impression and, through peripheral vision, to significantly reduce the need for examining all of the tissue in foveal vision, the experienced pathologists were the most efficient.
One of the problems in using digital pathology today is that it takes pathologists significantly longer to navigate through the images than with the traditional light microscope (Weinstein et al., 2009). Thus, incorporating these types of data with knowledge about visual processing and attention mechanisms into hardware and software designs could dramatically influence the efficiency with which pathologists view images. In a similar vein, if we could improve our understanding of what attracts attention and visual processing resources in medical images in general, it would help those who are developing computer aids for automatically scanning, analyzing, and categorizing information in medical images.
Human Factors
The ergonomic aspects of interpreting medical images also play a very important role in the interpretation process. Physicians in general and radiologists in particular are required to read more and more cases with more and more images per case (Bhargavan & Sunshine, 2005; Carroll, 2003; Lu, Zhao, Chu, & Arenson, 2008; Meghea & Sunshine, 2007; Mukerji, Wallace, & Mitra, 2006; Nakajima, Yamada, Imamura, & Kobayashi, 2008; Sunshine & Maynard, 2008; Thind, Barter, & Service Review Committee, 2008). Shortages in physicians—especially specialists in rural and medically underserved areas—compound the problem. Physicians are working longer hours than ever before, and concerns have been raised regarding fatigue and whether it adversely affects diagnostic accuracy.
A more recent problem is the reliance on digital imaging. The problem in radiology is that even the best medical-grade displays available have less contrast than traditional radiographic film, and they have reduced spatial resolution, but it is this information that the visual system uses to regulate image focus, single vision, and direction of gaze. Digital displays may increase strain on radiologists’ oculomotor systems, overworking the eyes and resulting in eyestrain (known clinically as asthenopia) (Ebenholtz, 2001; MacKenzie, 1843).
Eyestrain has not been very well studied in medical imaging, but an early self-report study has shown that radiologists do experience more severe symptoms of eyestrain, blurred vision, and difficulty focusing as they read more imaging studies (Krupinski & Kallergi, 2007). A short survey was developed for assessing the fatigue of radiologists at different times during the day. The radiologists were asked about symptoms of visual and postural fatigue, the types and number of cases they had been interpreting, and total reading time for that day. The survey was given to radiologists and residents at various times in the morning and afternoon over a number of days.
There was a significant positive correlation (z test) between time spent reading cases and severity of visual fatigue symptoms (see Table 1).
Table 1.
Correlations Between Subjective Ratings of Visual Fatigue, Number of Cases Read, and Reading Time
| Form of Visual Fatigue |
Number of Cases |
Reading Time |
||
|---|---|---|---|---|
| R | P | R | P | |
| Difficulty focusing | .45 | <.001 | .39 | <.005 |
| Blurred vision | .42 | <.002 | .34 | <.020 |
| Eyestrain | .48 | <.001 | .43 | <.002 |
| Headache | .43 | <.002 | .24 | .090 |
Vertinsky and Forster (2005) also found that 36% of radiologists reported eyestrain as a function of length of work days, the number of breaks, screen flicker, and imaging modality. Goo et al. (2004) found that the reading environment—increased ambient light and monitor luminance levels—led to reports of greater subjective visual fatigue. Eyestrain occurs when the oculomotor systems work to maintain accommodation, convergence, and direction of gaze, and accommodative asthenopia is caused by strained ciliary muscles, resulting in physical symptoms like blurred vision, headaches, and pain in the eyes.
One recent study (Krupinski & Berbaum, 2010) measured the impact of visual fatigue by assessing subjective fatigue symptoms, the ability to keep the eye focused on the display, and diagnostic accuracy. Twenty radiology residents and 20 radiologists participated. The images contained 60 bone radiograph cases (half with fractures) viewed before and after a day of clinical reading. The readers indicated whether a fracture was present or absent and rated their confidence in that decision. Viewing time was automatically recorded. Diagnostic accuracy was measured using area under the proper binormal curve (Berbaum et al., 2007; Dorfman & Berbaum, 2000; Metz & Pan, 1999; Pan & Metz, 1997; Pesce & Metz, 2007). Error in visual accommodation was measured before and after each test session, using the WAM-5500 Auto Ref/Keratometer (Grand Seiko, Hiroshima, Japan), which collects refractive measurements and pupil diameter measurements every 0.2 sec. The WAM-5500 records accommodation and, hence, any shifts or errors in accommodation as a function of target distance. The amount of error is a function of a number of variables, such as target distance, visual status of the observer, and whether the observer’s vision is corrected. To record accommodation, the subject sits in front of the system with their chin in a chinrest and their forehead against a headrest to maintain a stable position. An image of the eye is obtained by the system optics, and the operator aligns the eye with a reticle mark using a joystick. Once the eye is focused properly, measurement begins with the press of a button.
The participants also completed the Swedish Occupational Fatigue Inventory (SOFI) (Åhsberg, 2000) and the Oculomotor subscale of the Simulator Sickness Questionnaire (SSQ) before each session (Kennedy, Lane, Berbaum, & Lilienthal, 1993). The SOFI consists of 20 expressions that are evenly distributed on five latent factors: lack of energy, physical exertion, physical discomfort, lack of motivation, and sleepiness. Physical exertion and physical discomfort are considered physical dimensions of fatigue. Lack of motivation and sleepiness are considered primarily mental factors, and lack of energy is a more general factor that reflects both physical and mental fatigue. Lower scores indicate lower levels of perceived fatigue. SOFI does not measure visual fatigue, so it was complemented by the Oculomotor subscale.
Data were collected twice for each observer: early (once in the morning, prior to any diagnostic reading activity) and late (once in the late afternoon, after a day of diagnostic reading). Fitting the proper binormal model to the rating data from the 60 cases for each reader in each reading condition and analyzing the resulting Az with an ANOVA with independent variables for institution, training, and reading session time of day, I found a significant drop in detection accuracy for late reading. Average Az was .885 for early reading and .852 for late reading [F(1,36) = 4.15, p = .0491].
On average, in terms of reading time, each case took 52.1 sec in the morning and 51.5 sec in the evening. Faculty took an average of 50.7 sec, and residents took an average of 52.8 sec. There were no significant differences between morning and evening viewing times for either the radiologists or the residents. The only main effect was the significantly greater reading time for normal examinations (56.7 sec) than for examinations with fractures (46.9 sec) [F(1,36) = 18.84, p = .0001], which is in line with other studies that have found that it typically takes longer to read a normal exam than one with a finding.
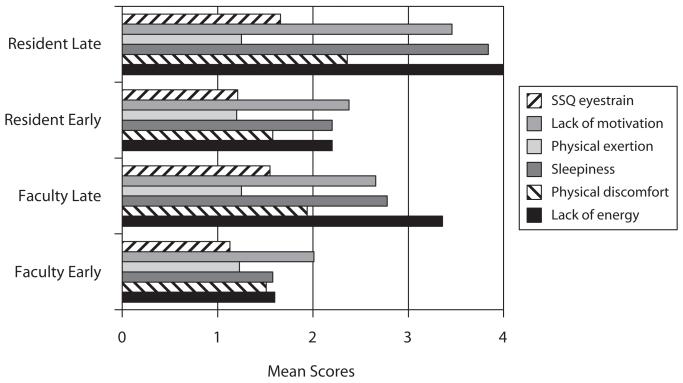
Figure 12 shows the mean SOFI ratings. Using an ANOVA, it was found that there was a statistically significant difference for lack of energy as a function of session time of day [F(1,76) = 16.19, p = .0001], but not for experience. Both radiologists and residents reported greater lack of energy in the evening. There was a statistically significant difference for physical discomfort as a function of session [F(1,76) = 5.091, p = .0269], but not for experience. For sleepiness, there was a statistically significant difference as a function of session [F(1,76) = 7.761, p = .0067], but not for experience. There were no statistically significant differences as a function of either session or experience for physical exertion. For motivation, there were also no statistically significant differences as a function of either session or experience. There were no statistically significant differences on any of the factors as a function of gender.
Figure 12.
Mean Swedish Occupational Fatigue Inventory and Simulator Sickness Questionnaire (SSQ) ratings for faculty and residents early and late in the day.
The scores from the SSQ Oculomotor subscale questions were averaged and analyzed with an ANOVA as a function of session and experience (Figure 12). Again, low scores indicated lower levels of perceived oculomotor strain. There was a statistically significant difference in perceived oculomotor strain as a function of session [F(1,75) = 20.39, p < .0001], but not as a function of experience [F(1,75) = 0.99, p = .32].
Visual accommodation was measured using two targets: an asterisk (recommended target) and a bone fracture (a more realistic target for radiologists). There was significantly greater accommodative error after the workday with both the fracture targets (−1.16 diopters late in the day vs. −0.72 diopters for early in the day) and the asterisk targets (−1.04 diopters late in the day vs. −0.64 diopters early in the day). This suggests that readers are more myopic after their workday. A significant pre-versus-post × attending-versus-resident interaction showed that, whereas the attending radiologists tended to have less accommodative error after the reading session than before, residents tended to have more.
Radiologists are clearly fatigued visually by their clinical reading workday. The present study suggests that radiologists are less accurate after a day of reading diagnostic images and that their ability to focus on the display screen is reduced because of myopia. Again, psychology in areas such as perception, cognition, and human factors could contribute significantly to improving our understanding of the factors that have an impact on the human eye–brain system and of what measures can be taken to improve the environment and conditions in which medical images are interpreted.
The Medical Image Perception Society
Where can this cross-fertilization of fields take place? Both psychology and medical imaging fields have their own meetings and some of them even have small sessions devoted to medical image perception. These sessions, however, are usually only attended by one group or the other; both offer little opportunity for interaction. The Medical Image Perception Society (MIPS; www.mips.ws/) was created to solve this problem. MIPS is composed of scholars studying the processes of perception and recognition of information in medical images. Members include physicians, psychologists, statisticians, physicists, engineers, and others in this growing research community. Members come from universities, hospitals, private companies, and government agencies (e.g., NIH, FDA). MIPS holds a scientific conference every 2 years to exchange current research and to conduct tutorials and workshops. The meeting promotes medical image perception research and offers students a chance to interact with senior perception researchers.
MIPS recently formulated a new set of research goals (Krupinski & Berbaum, 2009) that can also serve as a springboard for increased collaboration between psychology and medical imaging. Continued investigation of the complex perceptual recognition and interpretation processes involved in medical image perception is needed if we are to discover the most useful and effective presentation of imaging information to physicians in order to improve their detection and classification of disease.
The goals that MIPS has developed—detection and discrimination of abnormalities; cognitive and psychophysical processes; perception errors; search patterns; human and ideal observer models; computer-based perception (CAD and CADx); impact of display and ergonomic factors on image perception and performance; the role of image processing on image perception and performance; and assessment methodologies—stem from the core areas of research that medical image perceptionists are involved in. Clearly, there is significant overlap between psychology and medical image perception and likely much that they can learn from each other in the future.
The ultimate goal of medical image perception research is to understand and model the human perceptual and decision-making processes, so that better hardware and software can be developed for the presentation of medical image data to physicians. It is to provide them not necessarily with beautiful images, but with images that allow them to render accurate and timely interpretations. The study of medical image perception and the general interaction of physicians, psychologists, engineers, physicists, and many others remain critical elements of improving health care.
Acknowledgments
Some of the work presented here was supported by NIH Grants R01 EB008055 and R01 EB004987.
REFERENCES
- Abbey CK, Eckstein MP. Observer models as a surrogate to perception experiments. In: Samei E, Krupinski E, editors. The handbook of medical image perception and techniques. Cambridge University Press; Cambridge: 2010. pp. 240–250. [Google Scholar]
- Åhsberg E. Dimensions of fatigue in different working populations. Scandinavian Journal of Psychology. 2000;41:231–241. doi: 10.1111/1467-9450.00192. [DOI] [PubMed] [Google Scholar]
- Barrett HH, Myers KJ. Foundations of image science. Wiley; Hoboken, NJ: 2003. [Google Scholar]
- Barten PGJ. In: Rogowitz BE, editor. Physical model for the contrast sensitivity of the human eye; Proceedings of SPIE: Vol. 1666. Human vision, visual processing, and digital display III; San Jose, CA: SPIE Press. 1992.pp. 57–72. [Google Scholar]
- Barten PGJ. Contrast sensitivity of the human eye and its effects on image quality. SPIE Press; Bellingham, WA: 1999. [Google Scholar]
- Beam CA, Conant EF, Sickles EA. Association of volume and volume-independent factors with accuracy in screening mammogram interpretation. Journal of the National Cancer Institute. 2003;95:282–290. doi: 10.1093/jnci/95.4.282. doi:10.1093/jnci/95.4.282. [DOI] [PubMed] [Google Scholar]
- Beam CA, Conant EF, Sickles EA, Weinstein SP. Evaluation of proscriptive health care policy implementation in screening mammography. Radiology. 2003;229:534–540. doi: 10.1148/radiol.2292021585. [DOI] [PubMed] [Google Scholar]
- Beam CA, Krupinski EA, Kundel HL, Sickles EA, Wagner RF. The place of medical image perception in 21st-century health care. Journal of the American College of Radiology. 2006;3:409–412. doi: 10.1016/j.jacr.2006.02.029. doi:10.1016/j.jacr.2006.02.029. [DOI] [PubMed] [Google Scholar]
- Berbaum KS, Dorfman DD, Franken EA, Jr., Caldwell RT. Proper ROC analysis and joint ROC analysis of the satisfaction of search effect in chest radiography. Academic Radiology. 2000;7:945–958. doi: 10.1016/s1076-6332(00)80176-2. [DOI] [PubMed] [Google Scholar]
- Berbaum KS, El-Khoury GY, Ohashi K, Schartz KM, Caldwell RT, Madsen M, Franken EA., Jr. Satisfaction of search in multitrauma patients: Severity of detected fractures. Academic Radiology. 2007;14:711–722. doi: 10.1016/j.acra.2007.02.016. [DOI] [PMC free article] [PubMed] [Google Scholar]
- Berbaum K[S], Franken E, Caldwell R, Schartz K. Satisfaction of search in traditional radiographic imaging. In: Samei E, Krupinski E, editors. The handbook of medical image perception and techniques. Cambridge University Press; Cambridge: 2010. pp. 107–138. [Google Scholar]
- Berlin L. Errors of omission. American Journal of Roentgenology. 2005;185:1416–1421. doi: 10.2214/AJR.05.0838. [DOI] [PubMed] [Google Scholar]
- Berlin L. Accuracy of diagnostic procedures: Has it improved over the past five decades? American Journal of Roentgenology. 2007;188:1173–1178. doi: 10.2214/AJR.06.1270. [DOI] [PubMed] [Google Scholar]
- Berlin L. Malpractice issues in radiology: Res ipsa loquitur. American Journal of Roentgenology. 2009;193:1475–1480. doi: 10.2214/AJR.09.3137. doi:10.2214/AJR.09.3137. [DOI] [PubMed] [Google Scholar]
- Beutel J, Kundel HL, Van Metter RL, editors. Handbook of medical imaging: Vol. 1. Physics and psychophysics. SPIE Press; Bellingham, WA: 2000. [Google Scholar]
- Bhargavan M, Sunshine JH. Workload of radiologists in the United States in 2002-2003 and trends since 1991-1992. Radiology. 2005;236:920–931. doi: 10.1148/radiol.2363041316. [DOI] [PubMed] [Google Scholar]
- Birkelo CC, Chamberlain WE, Phelps PS, Schools PE, Zacks D, Yerushalmy J. Tuberculosis case finding: A comparison of the effectiveness of various roentgenographic and photofluorographic methods. Journal of the American Medical Association. 1947;133:359–366. doi: 10.1001/jama.1947.02880060001001. [DOI] [PubMed] [Google Scholar]
- Bunch PC, Hamilton JF, Sanderson GK, Simmons AH. A free-response approach to the measurement and characterization of radiographic observer performance. Journal of Applied Photographic Engineering. 1978;4:166–171. [Google Scholar]
- Burgess A. Signal detection in radiology. In: Samei E, Krupinski E, editors. The handbook of medical image perception and techniques. Cambridge University Press; Cambridge: 2010a. pp. 47–72. [Google Scholar]
- Burgess A. Signal detection theory: A brief history. In: Samei E, Krupinski E, editors. The handbook of medical image perception and techniques. Cambridge University Press; Cambridge: 2010b. pp. 26–46. [Google Scholar]
- Burgess A. Spatial vision research without noise. In: Samei E, Krupinski E, editors. The handbook of medical image perception and techniques. Cambridge University Press; Cambridge: 2010c. pp. 21–25. [Google Scholar]
- Carroll TJ. Trends in on-call workload in an academic medical center radiology department 1998–2002. Academic Radiology. 2003;10:1312–1320. doi: 10.1016/s1076-6332(03)00381-7. [DOI] [PubMed] [Google Scholar]
- Chakraborty DP. Maximum likelihood analysis of free-response receiver operating characteristic (FROC) data. Medical Physics. 1989;16:561–568. doi: 10.1118/1.596358. [DOI] [PubMed] [Google Scholar]
- Chakraborty D. Recent developments in FROC methodology. In: Samei E, Krupinski E, editors. The handbook of medical image perception and techniques. Cambridge University Press; Cambridge: 2010. pp. 216–239. [Google Scholar]
- Chakraborty DP, Berbaum KS. Observer studies involving detection and localization: Modeling, analysis, and validation. Medical Physics. 2004;31:2313–2330. doi: 10.1118/1.1769352. [DOI] [PubMed] [Google Scholar]
- Chakraborty DP, Winter LHL. Free-response methodology: Alternate analysis and a new observer-performance experiment. Radiology. 1990;174:873–881. doi: 10.1148/radiology.174.3.2305073. [DOI] [PubMed] [Google Scholar]
- Chunn T, Honeyman J. Storage and database. In: Kim Y, Horii SC, editors. Handbook of medical imaging: Vol. 3. Display and PACS. SPIE Press; Bellingham, WA: 2000. pp. 365–401. [Google Scholar]
- Dorfman DD, Berbaum KS. A contaminated binormal model for ROC data: Part II. A formal model. Academic Radiology. 2000;7:427–437. doi: 10.1016/s1076-6332(00)80383-9. [DOI] [PubMed] [Google Scholar]
- Dorfman DD, Berbaum KS, Metz CE. Receiver operating characteristic rating analysis: Generalization to the population of readers and patients with the jackknife method. Investigative Radiology. 1992;27:723–731. [PubMed] [Google Scholar]
- Ebenholtz SM. Oculomotor systems and perception. Cambridge University Press; New York: 2001. [Google Scholar]
- Edwards DC, Metz CE. Optimization of restricted ROC surfaces in three-class classification tasks. IEEE Transactions on Medical Imaging. 2007;26:1345–1356. doi: 10.1109/TMI.2007.898578. [DOI] [PubMed] [Google Scholar]
- Garland LH. On the scientific evaluation of diagnostic procedures. Radiology. 1949;52:309–328. doi: 10.1148/52.3.309. [DOI] [PubMed] [Google Scholar]
- Goo JM, Choi JY, Im JG, Lee HJ, Chung MJ, Han DH, et al. Effect of monitor luminance and ambient light on observer performance in soft-copy reading of digital chest radiographs. Radiology. 2004;232:762–766. doi: 10.1148/radiol.2323030628. [DOI] [PubMed] [Google Scholar]
- He X, Frey EC. The validity of three-class Hotelling trace (3-HT) in describing three-class task performance: Comparison of three-class volume under ROC surface (VUS) and 3-HT. IEEE Transactions on Medical Imaging. 2009;28:185–193. doi: 10.1109/TMI.2008.928919. [DOI] [PMC free article] [PubMed] [Google Scholar]
- He X, Gallas BD, Frey EC. Three-class ROC analysis: Toward a general decision theoretic solution. IEEE Transactions on Medical Imaging. 2010;29:206–215. doi: 10.1109/TMI.2009.2034516. [DOI] [PMC free article] [PubMed] [Google Scholar]
- Hillis S. Multireader ROC analysis. In: Samei E, Krupinski E, editors. The handbook of medical image perception and techniques. Cambridge University Press; Cambridge: 2010. pp. 204–215. [Google Scholar]
- Hu CH, Kundel HL, Nodine CF, Krupinski EA, Toto LC. Searching for bone fractures: A comparison with pulmonary nodule search. Academic Radiology. 1994;1:25–32. doi: 10.1016/s1076-6332(05)80780-9. [DOI] [PubMed] [Google Scholar]
- Kennedy RS, Lane NE, Berbaum KS, Lilienthal MG. Simulator sickness questionnaire: An enhanced method for quantifying simulator sickness. International Journal of Aviation Psychology. 1993;3:203–220. [Google Scholar]
- Krupinski EA. Visual scanning patterns of radiologists searching mammograms. Academic Radiology. 1996;3:137–144. doi: 10.1016/s1076-6332(05)80381-2. [DOI] [PubMed] [Google Scholar]
- Krupinski EA, Berbaum KS. The Medical Image Perception Society update on key issues for image perception research. Radiology. 2009;253:230–233. doi: 10.1148/radiol.2531090237. [DOI] [PMC free article] [PubMed] [Google Scholar]
- Krupinski EA, Berbaum KS. In: Manning DJ, Abbey CK, editors. Does reader visual fatigue impact interpretation accuracy?; Proceedings of SPIE: Vol. 7627. Image perception, observer performance, and technology assessment; 2010; Article No. 762701. doi:10.1117/12.841050. [Google Scholar]
- Krupinski EA, Jiang Y. Anniversary paper: Evaluation of medical imaging systems. Medical Physics. 2008;35:645–659. doi: 10.1118/1.2830376. [DOI] [PubMed] [Google Scholar]
- Krupinski EA, Kallergi M. Choosing a radiology workstation: Technical and clinical considerations. Radiology. 2007;242:671–682. doi: 10.1148/radiol.2423051403. [DOI] [PubMed] [Google Scholar]
- Krupinski EA, LeSueur B, Ellsworth L, Levine N, Hansen R, Silvis N, et al. Diagnostic accuracy and image quality using a digital camera for teledermatology. Telemedicine Journal. 1999;5:257–263. doi: 10.1089/107830299312005. [DOI] [PubMed] [Google Scholar]
- Krupinski EA, Nodine CF, Kundel HL. Enhancing recognition of lesions in radiographic images using perceptual feedback. Optical Engineering. 1998;37:813–818. [Google Scholar]
- Krupinski EA, Nypaver M, Poropatich R, Ellis D, Safwat R, Sapci H. Clinical applications in telemedicine/telehealth. Telemedicine Journal & e-Health. 2002;8:13–34. doi: 10.1089/15305620252933374. [DOI] [PubMed] [Google Scholar]
- Krupinski EA, Siddiqui K, Siegel E, Shrestha R, Grant E, Roehrig H, Fan J. Influence of 8-bit vs. 11-bit digital displays on observer performance and visual search: A multi-center evaluation. Journal of the Society for Information Display. 2007;15:385–390. [Google Scholar]
- Krupinski EA, Tillack AA, Richter L, Henderson JT, Bhattacharyya AK, Scott KM, et al. Eye-movement study and human performance using telepathology virtual slides: Implications for medical education and differences with experience. Human Pathology. 2006;37:1543–1556. doi: 10.1016/j.humpath.2006.08.024. [DOI] [PubMed] [Google Scholar]
- Kundel HL. Peripheral vision, structured noise, and film reader error. Radiology. 1975;114:269–273. doi: 10.1148/114.2.269. [DOI] [PubMed] [Google Scholar]
- Kundel HL. Perception errors in chest radiography. Seminars in Respiratory Medicine. 1989;10:203–210. [Google Scholar]
- Kundel HL, Nodine CF, Carmody DP. Visual scanning, pattern recognition, and decision-making in pulmonary nodule detection. Investigative Radiology. 1978;13:175–181. doi: 10.1097/00004424-197805000-00001. [DOI] [PubMed] [Google Scholar]
- Kundel HL, Nodine CF, Krupinski EA. Searching for lung nodules: Visual dwell indicates locations of false-positive and false-negative decisions. Investigative Radiology. 1989;24:472–478. [PubMed] [Google Scholar]
- Kupinski M. Implementation of observer models. In: Samei E, Krupinski E, editors. The handbook of medical image perception and techniques. Cambridge University Press; Cambridge: 2010. pp. 251–258. [Google Scholar]
- Lu Y, Zhao S, Chu PW, Arenson RL. An update survey of academic radiologists’ clinical productivity. Journal of the American College of Radiology. 2008;5:817–826. doi: 10.1016/j.jacr.2008.02.018. [DOI] [PubMed] [Google Scholar]
- Lund PJ, Krupinski EA, Pereles S, Mockbee B. Comparison of conventional and computed radiography: Assessment of image quality and reader performance in skeletal extremity trauma. Academic Radiology. 1997;4:570–576. doi: 10.1016/s1076-6332(97)80207-3. [DOI] [PubMed] [Google Scholar]
- MacKenzie W. On asthenopia or weak-sightedness. Edinburgh Medical & Surgical Journal. 1843;60:73–103. [PMC free article] [PubMed] [Google Scholar]
- Manning DJ, Ethell SC, Donovan T. Detection or decision errors? Missed lung cancer from the posteroanterior chest radiograph. British Journal of Radiology. 2004;77:231–235. doi: 10.1259/bjr/28883951. [DOI] [PubMed] [Google Scholar]
- Manning DJ, Gale A, Krupinski EA. Perception research in medical imaging. British Journal of Radiology. 2005;78:683–685. doi: 10.1259/bjr/72087985. doi:10.1259/bjr/72087985. [DOI] [PubMed] [Google Scholar]
- Meghea C, Sunshine JH. Determinants of radiologists’ desired workloads. Journal of the American College of Radiology. 2007;4:166–170. doi: 10.1016/j.jacr.2006.08.015. [DOI] [PubMed] [Google Scholar]
- Metz CE, Pan X. “Proper” binormal ROC curves: Theory and maximum-likelihood estimation. Journal of Mathematical Psychology. 1999;43:1–33. doi: 10.1006/jmps.1998.1218. [DOI] [PubMed] [Google Scholar]
- Mukerji N, Wallace D, Mitra D. Audit of the change in the on-call practices in neuroradiology and factors affecting it. BMC Medical Imaging. 2006;6:13–17. doi: 10.1186/1471-2342-6-13. doi:10.1186/1471-2342-6-13. [DOI] [PMC free article] [PubMed] [Google Scholar]
- Nakajima Y, Yamada K, Imamura K, Kobayashi K. Radiologist supply and workload: International comparison. Radiation Medicine. 2008;26:455–465. doi: 10.1007/s11604-008-0259-2. [DOI] [PubMed] [Google Scholar]
- Newell RR, Chamberlain WE, Rigler L. Descriptive classification of pulmonary shadows: A revelation of unreliability in roentgenographic diagnosis of tuberculosis. American Review of Tuberculosis. 1954;69:566–584. doi: 10.1164/art.1954.69.4.566. [DOI] [PubMed] [Google Scholar]
- Nodine CF, Kundel HL. Using eye movements to study visual search and to improve tumor detection. RadioGraphics. 1987;7:1241–1250. doi: 10.1148/radiographics.7.6.3423330. [DOI] [PubMed] [Google Scholar]
- Nodine CF, Kundel HL, Mello-Thoms C, Weinstein SP, Orel SG, Sullivan DC, Conant EF. How experience and training influence mammography expertise. Academic Radiology. 1999;6:575–585. doi: 10.1016/s1076-6332(99)80252-9. doi:10.1016/S1076-6332(99)80252-9. [DOI] [PubMed] [Google Scholar]
- Nodine C[F], Mello-Thoms C. The role of expertise in radiologic image interpretation. In: Samei E, Krupinski E, editors. The handbook of medical image perception and techniques. Cambridge University Press; Cambridge: 2010. pp. 139–156. [Google Scholar]
- Nodine CF, Mello-Thoms C, Kundel HL, Weinstein SP. Time course of perception and decision making during mammographic interpretation. American Journal of Roentgenology. 2002;179:917–923. doi: 10.2214/ajr.179.4.1790917. [DOI] [PubMed] [Google Scholar]
- Obuchowski NA, Lieber ML, Powell KA. Data analysis for detection and localization of multiple abnormalities with application to mammography. Academic Radiology. 2000;7:516–525. doi: 10.1016/s1076-6332(00)80324-4. [DOI] [PubMed] [Google Scholar]
- Pan X, Metz CE. The “proper” binormal model: Parametric ROC curve estimation with degenerate data. Academic Radiology. 1997;4:380–389. doi: 10.1016/s1076-6332(97)80121-3. [DOI] [PubMed] [Google Scholar]
- Pesce LL, Metz CE. Reliable and computationally efficient maximum-likelihood estimation of “proper” binormal ROC curves. Academic Radiology. 2007;14:814–829. doi: 10.1016/j.acra.2007.03.012. [DOI] [PMC free article] [PubMed] [Google Scholar]
- Rutter CM. Bootstrap estimation of diagnostic accuracy with patient-clustered data. Academic Radiology. 2000;7:413–419. doi: 10.1016/s1076-6332(00)80381-5. [DOI] [PubMed] [Google Scholar]
- Samei E, Flynn MJ, Kearfott KJ. Patient dose and detectability of subtle lung nodules in digital chest radiographs [Abstract] Health Physics. 1997;72(6 Suppl.) [Google Scholar]
- Samei E, Krupinski E, editors. The handbook of medical image perception and techniques. Cambridge University Press; Cambridge: 2010. [Google Scholar]
- Saunders RS, Jr., Baker JA, Delong DM, Johnson JP, Samei E. Does image quality matter? Impact of resolution and noise on mammographic task performance. Medical Physics. 2007;34:3971–3981. doi: 10.1118/1.2776253. [DOI] [PubMed] [Google Scholar]
- Smith MJ. Error and variation in diagnostic radiology. Thomas; Springfield, IL: 1967. [Google Scholar]
- Starr SJ, Metz CE, Lusted LB, Goodenough DJ. Visual detection and localization of radiographic images. Radiology. 1975;116:533–538. doi: 10.1148/116.3.533. [DOI] [PubMed] [Google Scholar]
- Starr SJ, Metz CE, Lusted LB, Sharp PF, Herath KB. Comments on the generalization of receiver operating characteristic analysis to detection and localization tasks. Physics in Medicine & Biology. 1977;22:376–379. doi: 10.1088/0031-9155/22/2/020. [DOI] [PubMed] [Google Scholar]
- Sunshine JH, Maynard CD. Update on the diagnostic radiology employment market: Findings through 2007–2008. American Journal of Roentgenology. 2008;5:827–833. doi: 10.1016/j.jacr.2008.02.007. [DOI] [PubMed] [Google Scholar]
- Swensson RG. Unified measurement of observer performance in detecting and localizing target objects on images. Medical Physics. 1996;23:1709–1725. doi: 10.1118/1.597758. [DOI] [PubMed] [Google Scholar]
- Swensson RG, Judy PF. Detection of noisy visual targets: Models for the effects of spatial uncertainty and signal-to-noise ratio. Perception & Psychophysics. 1981;29:521–534. doi: 10.3758/bf03207369. [DOI] [PubMed] [Google Scholar]
- Thakur ML. Genomic biomarkers for molecular imaging: Predicting the future. Seminars in Nuclear Medicine. 2009;39:236–246. doi: 10.1053/j.semnuclmed.2009.03.006. doi:10.1053/j.semnuclmed.2009.03.006. [DOI] [PMC free article] [PubMed] [Google Scholar]
- Thind R, Barter S, Service Review Committee The Service Review Committee: Royal College of Radiologists. Philosophy, role, and lessons to be learned. Clinical Radiology. 2008;63:118–124. doi: 10.1016/j.crad.2007.08.013. [DOI] [PubMed] [Google Scholar]
- Tourassi G. Receiver operating characteristic analysis: Basic concepts and practical applications. In: Samei E, Krupinski E, editors. The handbook of medical image perception and techniques. Cambridge University Press; Cambridge: 2010. pp. 187–203. [Google Scholar]
- Tuddenham WJ. Visual search, image organization, and reader error in roentgen diagnosis: Studies of psychophysiology of roentgen image perception. Radiology. 1962;78:694–704. doi: 10.1148/78.5.694. [DOI] [PubMed] [Google Scholar]
- Tuddenham WJ. Problems of perception in chest roentgenology: Facts and fallacies. Radiological Clinics of North America. 1963;1:277–289. [Google Scholar]
- Tuddenham WJ, Calvert WP. Visual search patterns in roentgen diagnosis. Radiology. 1961;76:255–256. doi: 10.1148/76.2.255. [DOI] [PubMed] [Google Scholar]
- Vertinsky T, Forster B. Prevalence of eye strain among radiologists: Influence of viewing variables on symptoms. American Journal of Roentgenology. 2005;184:681–686. doi: 10.2214/ajr.184.2.01840681. [DOI] [PubMed] [Google Scholar]
- Weinstein RS, Graham AR, Richter LC, Barker GP, Krupinski EA, Lopez AM, et al. Overview of telepathology, virtual microscopy, and whole slide imaging: Prospects for the future. Human Pathology. 2009;40:1057–1069. doi: 10.1016/j.humpath.2009.04.006. doi:10.1016/j.humpath.2009.04.006. [DOI] [PubMed] [Google Scholar]


