Abstract
Background
Contact heat evoked potentials (CHEP) is a thermal stimulus modality used in pain research. We examine a commercial CHEP stimulator (CHEPS) that is designed to work in an fMRI environment, but poorly understood in the MEG environment. The CHEPS attains target temperatures rapidly using sophisticated control signals that unfortunately induce artifacts in the MEG. In this paper, we summarize our experiences using the CHEPS in MEG to study pain using an experimental paradigm, and propose a novel method for managing its artifact.
New method
We introduce a novel damped sinusoid modeling (DSM) technique to remove the CHEPS artifact based on estimates of the underlying sinusoids and damping factors. We show comparisons to signal space projection (SSP) and temporal signal space separation (tSSS) methods.
Results
The CHEPS artifact is highly dynamic, yet deterministic, switching rapidly from one frequency to another, with different spatial components. The galvanic connection between the subject and the CHEPS probe alters its performance, making pre-characterization difficult.
Comparison with existing methods
SSP methods failed to remove the artifact completely. TSSS performed better than SSP; however, tSSS requires the use of a multipolar head model that decreases the dimensionality and possibly the information content of the data. In contrast, DSM offers a strictly temporal modeling approach in which the artifact is estimated as a sum of damped sinusoids which is subtracted from the data.
Conclusion
Though the CHEPS increases the noise floor and introduces artifacts to the data, we believe the device can be successfully used in MEG if appropriate artifact removal techniques are followed.
Keywords: Magnetoencephalography, Contact heat evoked potentials, Artifact rejection, Damped sinusoids
1. Introduction
Pain is a complex experience resulting from the interaction of several neural networks that form the pain Neuromatrix (Melzack, 2001). Sensory, affective and cognitive networks are critical to our individual processing of pain experience from individual stimuli in daily life. Pain perception is a critical evolutionary gain and guides our behavior toward minimizing tissue injury or harm. Chronic pain, however, which is often the result of nervous system injury, is maladaptive and does not correlate with ongoing threat to organ or tissue damage. Instead of protecting the individual, chronic pain leads to disability and behavioral manifestations that include lack of activity, depression and social problems. Better understanding of the neural mechanisms underlying pain anticipation and pain-related disability is critical for developing novel interventions aimed at alleviating chronic pain and its long-term complications. Experimental pain studies have used both somatic and visceral stimulation paradigms; however, the former has been widely applied (Hobson and Aziz, 2003). Magnetoencephalography (MEG) and functional Magnetic Resonance Imaging (fMRI) have been widely used to study pain perception and adjustment mechanisms (Apkarian et al., 2005). A number of stimulation devices have been used to study somatic nociceptive pain including electrical (Hauck et al., 2007a, Babiloni et al., 2008) mechanical (Druschky et al., 2000), chemical (Kobal, 1985) and thermal (Hauck et al., 2007b; Fairhurst et al., 2007).
Laser techniques evoke pain using radiant heat and are popular mainly because the underlying evoked potentials are thought to reflect directly the underlying pain intensity coding of the nociceptors. There have been studies for (Treede et al., 2000) and against this theory (Iannetti et al., 2008). Laser stimulus techniques impose two major constraints in MEG studies, lack of reliable automated ways to repetitively apply stimulus to the same cutaneous area (due to concerns of causing burns) and reproducibility of stimulus. In addition, laser stimulus adds other confounds in MEG including the presence of another person in the shielded room to change the stimulus site periodically adding to movement artifacts, movement related cortical activation, and possible distraction from the experimental task to the subjects. Laser stimulus presents even more challenges when subjects are physically and/or cognitively disabled. Also, laser devices are tightly regulated for research purposes in certain countries due to the risk of burns.
Of all the techniques, thermal stimulation is widely appreciated for its reliability and ease of application (Arendt-Nielsen and Chen, 2003). Devices delivering contact heat pain stimulus have been unpopular due to slow raise and fall times, but newer technologies have started addressing this issue (Arendt-Nielsen and Chen, 2003). A number of studies have used contact heat to study pain (Apkarian et al., 2005); however, almost all of the stimulation devices were built in-house and not available commercially. Contact Heat Evoked Potential Stimulator (CHEPS), manufactured by Medoc Ltd. (Ramat-Yoshai, Israel) is one of the first commercially available devices marketed to study pain with approval from the US Food and Drug Administration (FDA). The CHEPS was originally designed for the fMRI environment and has been claimed to be MEG compatible, based on relatively few studies (Adjamian et al., 2009). The CHEPS overcomes the limitations of laser, but its electronic signaling generates considerable artifacts in the MEG data (Adjamian et al., 2009).
The purpose of this article is two fold: (1) to summarize our overall experience working with the CHEPS in the MEG environment; and (2) to introduce a novel application of damped sinusoids to model and remove the CHEPS artifact. We used the CHEPS in MEG to study pain and pain anticipation in a novel paradigm. To our knowledge only one study has addressed this issue of the CHEPS artifact in MEG (Adjamian et al., 2009), and no study has used the CHEPS in a systematic experimental design to study pain in MEG.
2. Materials and methods
Data presented here are a part of a larger clinical trial that investigates the use of deep brain stimulation (DBS) in patients with thalamic pain syndrome. We present exemplar data from one normal healthy research adult subject from the control population. All research activities were approved by the Cleveland Clinic Institutional Review Board with signed informed consent and monitored by FDA Investigational Device Exemption (IDE).
2.1. Data collection
Using a STIM2 stimulus presentation system (Compumedics Neuroscan, Charlotte, NC, USA), visual cues that signaled incoming painful heat stimulus or no stimulus were presented to the subject during MEG acquisition. The paradigm consisted of 2 blocks of continuous data collection, each consisting of 60 pseudo-randomized trials of distinct visual count-down cues, 60% of which signaled impending painful stimulus; the other 40% signaled no stimulus. The paradigm was repeated for the left and right upper extremities, one side at a time, adding up to a total of 4 blocks. The visual presentation always consisted of a gray equilateral triangle containing a number inside (countdown) that flashed for 250 ms on a light gray background with cross hairs. A tip up triangle represented no incoming stimulus while a tip down represented incoming painful stimulus. Each cycle was 8–9 s long with a 1 s baseline, 3 s of pre-stimulus countdown period, and 4–5 s post-stimulus period. Distinct trigger markers in the data stream were used to identity the onset of the visual cues and target stimulus.
The nociceptive stimulus at the end of a countdown was delivered with a contact heat evoked potential stimulator (CHEPS) (Medoc Ltd., Ramat-Yoshai, Israel, www.medoc-web.com). The CHEPS unit has two primary parts, a generator unit, and a 10 m long umbilical cord with coolant lines and electrical connections feeding a thermode comprising heat-foil and thermoelectric cooler elements. The generator unit sits outside the magnetically shielded room (MSR), while the thermode end of the cord is threaded inside the MSR to the subject. The painful stimulus was triggered such that the temperature rose to painful levels at the zero time of the countdown. The CHEPS thermode was strapped to the wrist with the thermal surface of the probe in direct contact with the palmar surface. Prior to data acquisition, painful stimulation was titrated for each individual by applying ramp and hold stimulus (rise rate: 70 °C/s, hold: 2 s, fall rate: 40 °C/s) with a range of target temperature starting from 40 till 50 °C with 1 °C increments and 1 s gap between them. Stimulation was set to be tolerable, yet painful, and never above 50 °C. All stimulation procedures were within the FDA-approved limits set on the device.
In a separate block, the nociceptive stimulus at the end of the countdown was given using a median nerve stimulator to evoke a non-painful somatosensory evoked potential (SSEP), in order serve as a control to the painful stimulus delivered using the CHEPS.
2.2. Data pre-processing
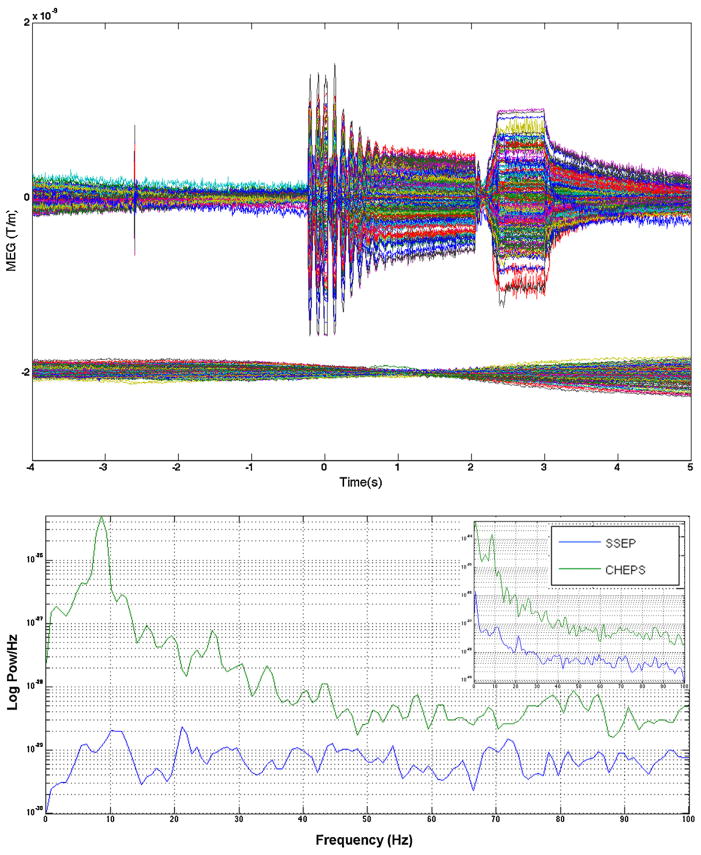
The subject was seated upright in the MEG array (Elekta Neuromag, Helsinki, Finland). All data were collected at 1000 samples/s. The data were resampled by a factor of 5 to 200 samples/s using Matlab’s (The Mathworks, Natick, MA, USA) “resample” command. The 60 Hz power line artifact was removed by modeling the sinusoid and subtracting it from the data. The continuous data were parsed using trigger markers to segregate painful and non-painful trials. The mean of each trial was removed to eliminate sensor offsets. Approximately one fourth of the trials (both stimulus and no stimulus condition irrespective of time) had random discharges or pops generated by the CHEPS device (Fig. 2). Because these discharges were temporally random, their effect was greatly suppressed by simple averaging of the trials. The painful trials, in addition, had the deterministic CHEPS artifact as discussed below.
Fig. 2.
Upper plot shows a 9 s long single non-averaged trial (of all 204 gradiometer channel data overlaid) using the CHEPS (on top) and SSEP (bottom). For the sake of clarity and comparison, SSEP is shown with an offset in the plot. The CHEPS trial shows a random discharge (pop) between −3 and −2 s, and the substantial electronics artifact around and after time 0 s. Lower plot shows a Welch periodogram of the corresponding data and from a median nerve stimulation SSEP. To reduce the effects of pink noise, the data was processed using a two point ‘diff’ operator and a low order (10th) AR model. Inset shows the original spectral data without any temporal whitening.
2.3. CHEPS artifact
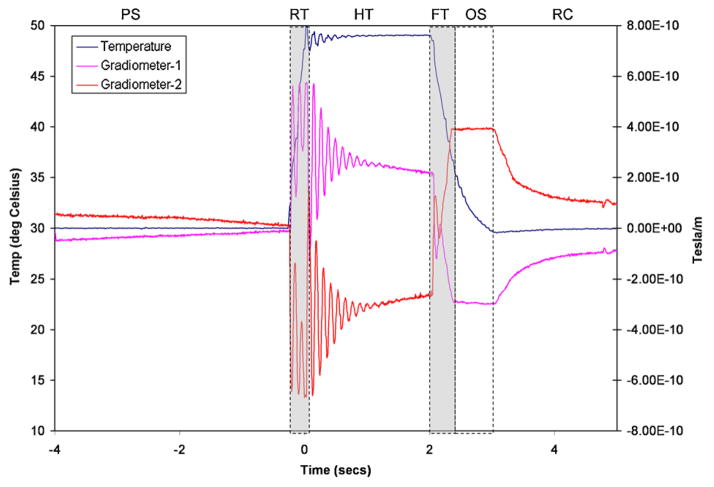
Data from one block (36 painful trials) acquired from the right extremity are presented here. Fig. 1 displays an averaged data for painful condition from an exemplar channel pair, revealing clearly the CHEPS artifact. We divide the 9 s long trial into six distinct phases:
Fig. 1.
Segmentation of the 9 s long averaged data from a gradiometer pair into different phases of the CHEPS artifact (right axis). PS – pre-stimulus, RT – rise time, HT – hold time, FT – fall time, OS – over shoot and RC – recovery. Temperature in degree Celsius is indicated on the left axis.
Pre-stimulus (3.729 s) – exponential rise or decay. The period generally has remnant artifact from Phase 6 of the preceding trial.
Ramp-up (0.271 s) – a short decaying sinusoid. The temperature rises from 30° baseline to 49° (target titrated for this subject) at the rate of 70°/s.
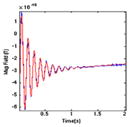
Hold (2 s) – a long decaying sinusoid. The device attempts to hold the target temperature constant.
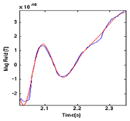
Ramp-down (0.30 s) – a short sinusoidal burst. The device ramps down from target temperature back to baseline at the rate of 40°/s.
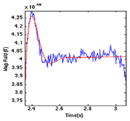
Overshoot (0.70 s) – a relative plateau phase where the rate of fall is slowed down to reduce the overshoot.
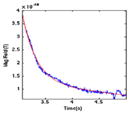
Recovery back to baseline temperature (3 s) – an exponential decay. The device returns to the baseline of 30°, allowing a brief overshoot.
Fig. 2 shows an overlay of all 204 planar gradiometers for a single 9 s long trial, i.e. unaveraged, revealing a characteristic random discharge and the obvious CHEPS artifact. Fig. 2 also shows the SSEP data for comparison.
2.4. Artifact rejection
In general, several techniques may be used to remove artifacts/interferences (Gross et al., 2013), and we discuss here some well established techniques and a novel proposed damped sinusoidal model method.
Signal Space Projection (SSP) is an artifact rejection technique in which baseline data in the sensor space (e.g. 204 gradiometer pairs) are linearly transformed in to its 204 distinct vectors or principal components in signal space (Uusitalo and Ilmoniemi, 1997). Typically, any major interference in the baseline data shows up in the first few components, and by projecting them out into a subspace orthogonal to signal, the signal data can be cleaned of the interference. SSP assumes the spatial topography of the artifact is consistent across time and leaves the data rank deficient with reduced dimensions. We performed a rank three SSP operation on the parsed 9 s long painful trials. Three types of SSP operation were applied: (1) the SSP operator was computed from each of the three phases (rise, hold and fall) that had a damped sinusoid artifact, and the projector was applied over to the entire 9 s trial; (2) the overall SSP operator was computed from all six phases of the artifact combined, then applied to the 9 s trial; (3) SSP operator was computed and applied separately to each of the six phases. We will refer to this method as SSPI.
Temporal Signal Space Separation (tSSS) is another technique (Taulu and Simola, 2006) where data are separated into spatial subspaces of those originating internal to the sensor array (signal) and others arising external to it (noise), based on multipolar model of the helmet space. Assuming that artifacts leak from external to internal spatial basis vectors (and not reversed), and the brain signals are poorly correlated with artifacts temporally, then the artifacts are projected out of the signal data. TSSS method is considered to be effective in removing artifacts originating from nearby sources (less than half a meter from sensor array). In this paper, we utilized the Neuromag Maxfilter implementation of tSSS using default parameters to process the raw data. Unlike SSP, the tSSS was applied to the continuous data that were subsequently parsed and averaged as discussed in Section 2.2.
The damped sinusoid model (DSM) represents the artifact as a sum of exponentially decaying (or rising) sinusoids. We used a relatively modern approach to generating this model based on “matrix pencils” (Ikramov, 1993), or equivalently, the singular value decomposition (SVD) and total least squares (TLS) (Vanhuffel et al., 1994) of a Hankel matrix of the data. Although so-called “Prony analysis” has been studied for over a century (Kay and Marple, 1981; Marple, 1987), these more recent numerical methods have been successfully used to estimate or reconstruct unknown parameters of damped and undamped sinusoids in realistic noise (Hua and Sarkar, 1990), such as found in the free induction decay (FID) of nuclear magnetic resonance (Nieminen et al., 2010; Volegov et al., 2006).
We employed the DSM here to estimate the underlying sinusoids and damping factor in the CHEPS artifact for each of the 204 gradiometer channels or views in the averaged data. Appendix-A provides a brief overview of the DSM method. The three important parameters of the model are (1) the segment of the data to be modeled, (2) the window length (pencil length) to be slid through the segment, and (3) the number of sinusoids (model order) to be modeled. The window length is generally empirically set to half the segment length. In this paper, we held the order constant and estimated an optimal window length between one quarter and three quarters of the signal length by minimizing the error (percentage RMS error) between the signal and the model. The model order was chosen to be three for pre-stimulus and recovery phases (simple exponential decay or rise) of the CHEPS artifact and five for the rest of the phases.
3. Results
All results shown here are from a single healthy volunteer. Fig. 2 shows the power spectrum (Welch periodogram) of a conventional electrical median nerve stimulation of the same subject, compared to the power spectrum of the CHEPS device. At the higher frequencies, the overall noise floor is increased by about an order of magnitude; at the lower frequencies, the increase is even greater, augmented by a distinct spectral peak in the CHEPS device below 10 Hz.
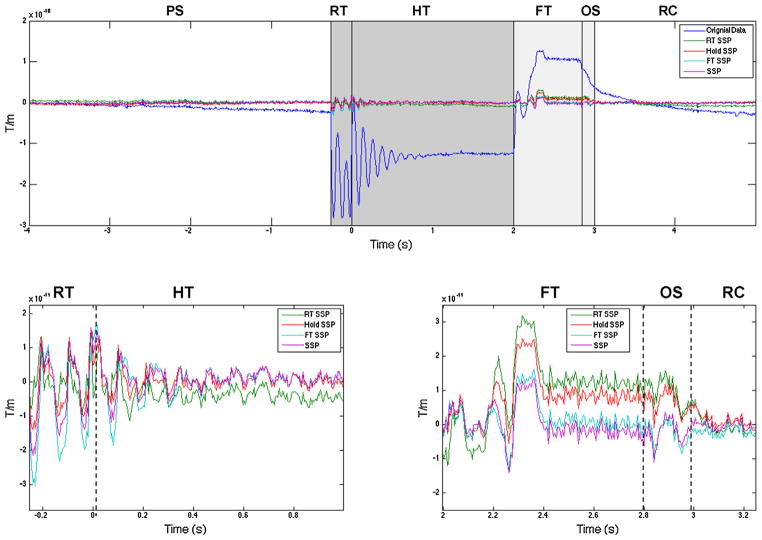
The SSP results are shown in Fig. 3 for one gradiometer channel of an average painful trial from one block. The rank 3 SSP projection operators computed from the entire trial or from the rise, hold and fall phases did not completely remove the artifact in any of these cases. If the CHEPS device were generating a constant spatial pattern, we would anticipate that some or all of these spatial operators would be effective in blocking the other components. The SSP failures shown here demonstrate that different spatial generators are in operation at each of the six phases of the CHEPS device. SSPI showed slightly better performance compared to above two methods.
Fig. 3.
Upper plot shows the original artifact (blue) from a 9 s long averaged data from one gradiometer channel and comparison of rank 3 SSP techniques. RT SSP–SSP operator computed from just the rise phase of the CHEPS artifact, Hold SSP–SSP operator computed from hold phase, FT SSP–SSP operator computed from fall phase of the CHEPS artifact, SSP–SSP operator computed from all 6 phases of the CHEPS artifact. Lower left plot shows magnified version of SSP results from the dark gray shaded area in the upper plot (rise and hold phases). Lower right plot shows the magnified version of SSP results from the light gray shaded area in the upper plot (fall and over-shoot phase). PS – pre-stimulus, RT – rise time, HT – hold time, FT – fall time, OS – over shoot and RC – recovery.
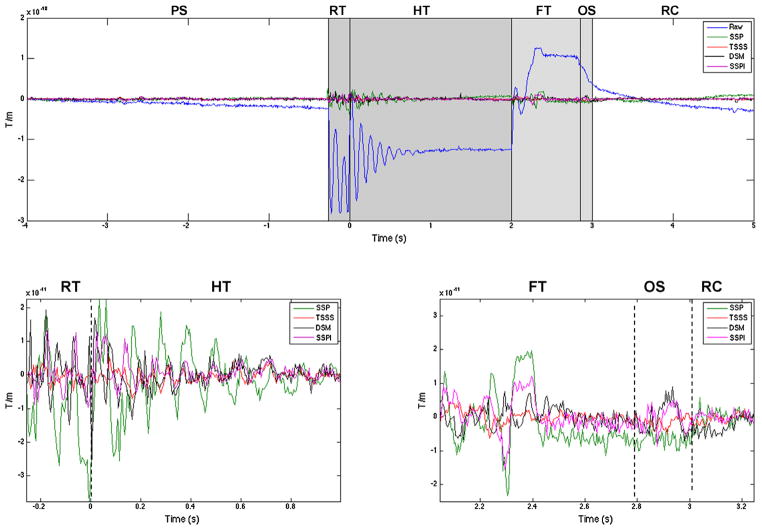
Fig. 4 shows the same trial and channel presented in Fig. 3 overlaid with data processed using the overall SSP, SSPI, tSSS and DSM methods for artifact removal, with corresponding power spectral density plots (Welch periodogram) shown in Fig. 5. TSSS performed better than SSP/SSPI in removing the 8.6 Hz dominating the CHEPS artifact, as well as overall suppression of the noise floor at higher frequencies. DSM also showed superior performance in removing the 8.6 Hz artifact, but with no appreciable decrease in the higher frequencies, which were intentionally excluded from the DSM modeling.
Fig. 4.
Upper plot shows the artifact in the data (blue) from a 9 s long averaged data from one gradiometer channel and the comparison of SSP, SSPI, tSSS and DSM methods. Lower left plot shows the magnified version of the SSP, tSSS and DSM results from the dark shaded area in the upper plot (rise and hold phases). Lower right plot shows the magnified version of the SSP, SSPI, tSSS and DSM results from the light shaded area in the upper plot (fall and overshoot phases). PS – pre-stimulus, RT – rise time, HT – hold time, FT – fall time, OS – over shoot and RC – recovery.
Fig. 5.
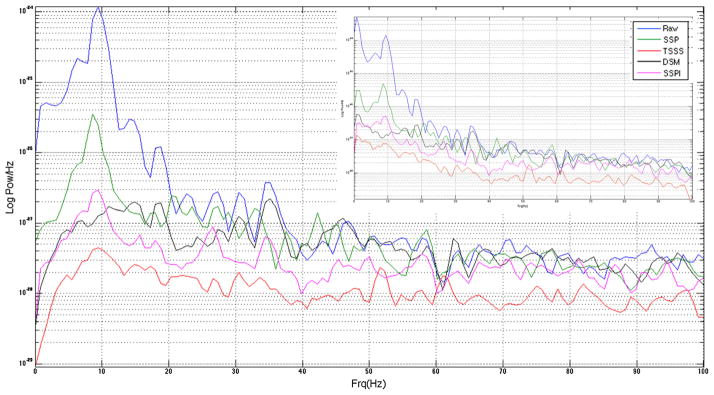
Welch periodogram computed from a 9 s long averaged data from one gradiometer channel (shown in Fig. 4) with the original artifact in the data, in addition to data in which artifact was removed using SSP, SSPI, TSSS and DSM methods. To reduce the effects of pink noise, the data was processed using a two point ‘diff’ operator and a low order (10th) AR model. Inset in plot shows the original data without any temporal whitening.
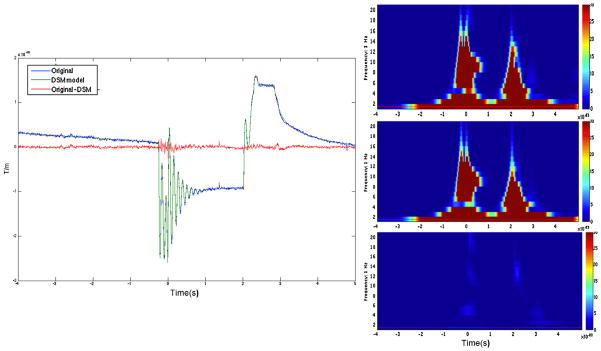
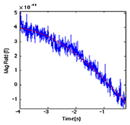
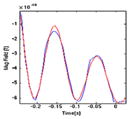
Fig. 6 shows the DSM model overlaid on top of the original averaged data from one block and the resultant cleaned data after subtraction of the model from the data, along with the time frequency plots computed using a complex Morlet wavelet (time-bandwidth = 3). Table 1 shows a closer look at each of the six phases processed using the DSM with the corresponding window length and model order. Each real sinusoid in the signal is modeled as a complex conjugate pair of frequencies (i.e. positive and negative frequencies), with a corresponding decaying or rising exponential term. For example, the Phase-1 Pre-stimulus period is modeled as a simple exponential decay with a time constant of about 4 s, combined with very low frequency sinusoid with a growing exponential time constant of about 11 s. In the Phase-3 Hold period, in addition to three decaying exponentials, the artifact was modeled as an 8.6 Hz damped sinusoid with a time constant of 250 ms, which corresponds to the primary component seen in the power spectrum of Fig. 4. The Rise phase (Phase-2) was dominated by 9.3 Hz decaying sinusoid with high damping, whereas the Fall phase (Phase-4) was a combination of two sinusoids, one decaying, one growing.
Fig. 6.
Left panel – A 9 s long averaged data from one gradiometer channel showing original contaminated data, DSM estimated model of the artifact and artifact free data after subtracting DSM from contaminated data. Right panel – time frequency plot of the contaminated data (top), DSM estimated model (middle) and subtracted artifact free data (bottom).
Table 1.
Six phases of the CHEPS artifact modeled using DSM method.
| Phase | Overlay of signal (blue) and model (red) | DSM model
|
|||
|---|---|---|---|---|---|
| Window length (ms) | Relative amplitude | Frequency (Hz) | Decay (ms) | ||
| (1) PS |
|
2800 | 1.000 | 0.000 | 4369.889 |
| 0.225 | −0.066 | −11,359.627 | |||
| 0.225 | 0.066 | −11,359.627 | |||
| (2) RT |
|
180 | 1.000 | 0.000 | 14.279 |
| 0.600 | 0.000 | −655.779 | |||
| 0.589 | 0.000 | 80.956 | |||
| 0.318 | 9.261 | 219.072 | |||
| 0.318 | −9.261 | 219.072 | |||
| (3) HT |
|
1460 | 1.000 | 0.000 | 7281.384 |
| 0.823 | 0.000 | 472.765 | |||
| 0.801 | 8.586 | 252.036 | |||
| 0.801 | −8.586 | 252.036 | |||
| 0.360 | 0.000 | 126.034 | |||
| (4) FT |
|
220 | 1.000 | −7.890 | 70.690 |
| 1.000 | 7.890 | 70.690 | |||
| 0.171 | 3.080 | −415.864 | |||
| 0.171 | −3.080 | −415.864 | |||
| 0.119 | 0.000 | 133.925 | |||
| (5) 0S |
|
540 | 1.000 | 0.000 | −205,813.156 |
| 0.368 | −3.720 | 62.582 | |||
| 0.368 | 3.720 | 62.582 | |||
| (6) RC |
|
1450 | 1.000 | 0.000 | 271.094 |
| 0.708 | −0.051 | 2153.802 | |||
| 0.708 | 0.051 | 2153.802 | |||
PS – pre-stimulus, RT – rise time, HT – hold time, FT – fall time, OS – over shoot and RC – recovery.
A similar but not identical pattern of artifacts was observed in all the other four subjects’ data that were processed in our study. For instance, the Phase-3 damped sinusoid was modeled at 8.577, 8.586, 8.410, 8.577 and 8.605 Hz in each of the five subjects.
4. Discussion
In many experimental MEG studies, causality is an important feature in order to perform coherence and connectivity analysis. A recent study (Florin et al., 2010) investigated different MEG preprocessing techniques and concluded that information content in the data and hence causality could be compromised if artifact removal is performed without the a priori knowledge of the artifact under question. In general, the preferred pre-processing technique should closely match the nature of the artifact.
In this paper, we presented our experiences using the CHEPS device in the MEG environment and the possible solutions to remove its electromagnetic artifact. The CHEPS is designed for rapid heating and cooling capabilities, and our MEG data clearly demonstrate sophisticated electronic oscillatory control algorithms regulating the temperature. Our damped sinusoidal modeling reveals different frequencies employed in each stage of the temperature control, and our SSP modeling reveals different spatial characteristics for each stage. To further understand the artifacts, we collected additional data while the thermode was thermally blocked, yet otherwise attached to the subject in the same position, by placing a non-conducting pad between the thermode and skin. We observed the spatial pattern of the CHEPS artifact to be completely different. Based on the observation, we believe that the device uses an active feedback control system that takes in to account a galvanic connection factor with the subject’s cutaneous surface. We also believe that this is one of the reasons behind nonidentical patterns of artifact recorded in each of the five subjects tested in this study, apart from target temperatures being different. Thus the artifacts are dynamic and variable, requiring careful consideration of the method used to remove them.
Conventional frequency filtering generally works well with stationary periodic interference, such as power line frequencies. Simply fitting sine and cosine functions at desired frequency to the data (Mitra and Pesaran, 1999) is suitable for these line artifacts, but would not capture the exponential dampening features. Notch filtering using high order FIR frequency filters can result in secondary artifacts (e.g. “ringing”) which would lead to erroneous interpretation of the data and disruption of the causality (Florin et al., 2010); low-order notch filters would remove too large a band, here centered around 8 Hz.
SSP methods generally work well for environmental interferences and artifacts arising from within the magnetically shielded room whose spatial pattern do not change randomly over time, and we initially expected SSP to work well here, with the initial assumption that the CHEPS thermode was the primary source of contamination. A rank 3 SSP computed from each of these three phases (rise, hold and fall) applied to entire trial did not remove the artifact everywhere, indicating that each phase comprised spatially different components. Our inference is that different components of the thermode and its umbilical cord are active at different stages of the temperature control, yielding spatially distinct sources. Results from the SSP operator computed and applied separately to each phase performed slightly better than the overall SSP operator.
TSSS is one of the methods that work well for artifacts arising from within human head (caused by metallic implants) and artifacts that are completely uncorrelated to brain signals. From Figs. 4 and 5 it is evident that tSSS performed well both temporally and spectrally in removing the artifact. TSSS has been proven to be efficient in detecting evoked potentials even in the presence of artifact from near by and far sources (Taulu and Hari, 2009). Part of it effectiveness, however, is achieved by its use of a reduced-rank multipolar head model; here, using the inner expansion order of 8 and the outer expansion of 3 (default settings), the effective head model rank is only 64, out of 204 planar gradiometers. In contrast, the SSP we employed reduced the rank by only three components, and our DSM model only subtracted two or three damped sinusoids.
Unlike other sensory stimulus such as visual or auditory that are purely evoked responses and localized to one cortical area; pain is a complex phenomenon that involves a combination of physical, cognitive and emotional factors (Tracey, 2008) encompassing a broader cortical network that oscillate at different phase and frequency. The response to painful stimulus is often an evoked response with high signal to noise ratio (SNR), whereas pain anticipatory phenomena may be more induced than evoked (low SNR) due to its complex nature. We are concerned that strong projection techniques such as tSSS may delete some of the underlying signals of interest, prior to detailed source modeling.
A previous study of the CHEPS artifact (Adjamian et al., 2009) demonstrated the use of reference sensors (Vrba and Robinson, 2001) by applying a third order synthetic gradiometer, which attenuated but did not remove the artifact completely. The same study further went on to show that a SAM beamformer (Robinson and Vrba, 1999) was able to localize evoked potential even in the presence of the CHEPS artifact. Again, as in tSSS, the use of this modeling approach requires commitment to a source model (i.e. current dipoles), a sampling of the source model (e.g. volume or surface grids), and careful spatial covariance estimation of the data. By contrast, the DSM is a simpler direct model of the artifact, without such strong source modeling assumptions.
The DSM method based on either a matrix pencils or equivalently a Hankel-TLS approach has been successfully applied in nuclear magnetic resonance imaging to estimate the temporal signal parameters of the free induction decay (FID) (Vanhuffel et al., 1994; Volegov et al., 2006; Barkhuijsen et al., 1987). The FID is directly modeled as a sum of decaying sinusoids, where the frequency and dampening factor of each sinusoid relates the underlying physical parameters. In a similar fashion, in the case of the CHEPS device, the oscillatory control parameters are again damped sinusoids that are used to regulate and prevent overshoot of the temperature rise in the thermode. Consistent with the artifact rejection comments of (Florin et al., 2010), our preference in the initial stages of data pre-processing is to use the simplest direct model of the underlying interference, and thus a damped sinusoid model remains the clear choice. The DSM method offers tight control over what is removed from the data; for instance, a damped 8.6 Hz is removed only from Phase-3 of the 9 s trial. A high order DSM model could model and remove higher frequency oscillatory components (e.g. beta and gamma) that might of interest in pain research, hence we limited our model order to low orders that was just sufficient enough to remove the low frequency CHEPS artifacts, as demonstrated in the Table 1.
In conclusion, we believe the CHEPS could be suitable in an MEG environment despite the presence of artifacts and elevated noise floors. The DSM showed satisfactory performance in removing the deterministic CHEPS artifact while maintaining tight control on exactly what was deleted from the data. Though a causality analysis was beyond the scope of this article, we believe that simple subtraction of the DSM from the data has minimal or no effect on causality when compared to classic convolutional (FIR and IIR) frequency filters (Florin et al., 2010). We conclude that further signal processing techniques in both temporal and frequency domains can be safely applied after eliminating the artifact using DSM.
HIGHLIGHTS.
CHEPS introduces artifacts and elevates noise floor in the MEG data.
SSP failed to remove artifact due to changing spatial patterns.
TSSS performed better but may alter subtle information in pain related signals.
A novel DSM based on matrix pencils effectively removed CHEPS artifact.
DSM preserves causality and information content.
Acknowledgments
Research reported in this publication was supported by National Institutes of Health New Innovator Award under award number DO006469A and by the National Institute of Biomedical Imaging and Bioengineering of the National Institutes of Health under award number R01EB009048. The content is solely the responsibility of the authors and does not represent the official views of the National Institutes of Health.
Abbreviations
- MEG
magnetoencephalography
- CHEP(S)
contact heat evoked potentials (stimulator)
- FDA
Food and Drug Administration
- DBS
deep brain stimulation
- SSP
signal space projection
- tSSS
temporal signal space separation
- DSM
damped sinusoid model
- SNR
signal to noise ratio
- SVD
singular value decomposition
- TLS
total least squares
- RMS
root mean square
- FID
free induction decay
- SAM
synthetic aperture magnetometry
- MSR
magnetically shielded room
- fMRI
functional magnetic resonance imaging
Appendix A. Appendix A
A brief description of the method for modeling damped sinusoids is presented here, following the developments of (Vanhuffel et al., 1994, Hua and Sarkar, 1990, Nieminen et al., 2010). Let x represent the signal vector, then the basic model can be formulated as
for the n = 1, …, N samples in the vector x, and with assumed error e(n). The parameters r and z are the residues and poles, resp., of the damped sinusoidal model, for M total poles. The goal is to estimate first the complex poles z, where z = exp(−α+jω), representing the damping factor and frequency; a complex conjugate pair of poles can therefore model a real sinusoid. Once the poles are found, the residues are found using a simple least-squares fit. See Marple (1987) for the rich history of historical methods that have been proposed to solve this model.
Let H represents signal in Hankel matrix form, where N is the length of the signal and L is the length of a window sliding through this data, . For multiple channels of signals {xi}, we concatenate multiple Hankel matrices, each generated by the corresponding signal vector, yielding H = [H1, H2, …].
The matrix H is then singular value decomposed, where U and V are unitary matrices and Σ is the diagonal matrix of singular values, to yield
The model order describes the number of complex sinusoids to be generated; each real sinusoid therefore requires a model order of two for the complex conjugate pair, and each purely decaying exponential requires a model order of one. Let M represent this model order, then we truncate and shift the left singular vectors to form the two matrices (Kung et al., 1983)
A generalized eigen analysis,
yields a vector of M poles {λi}. The absolute value of a pole relates to the exponential rise or decay time of the sinusoid, and the angle of the pole relates to the sinusoidal frequencies, when properly scaled for the sampling rate. To solve for the amplitude and initial phase of the sinusoid, we need only solve a simple least-squares problem. We form a Vandermonde matrix using the poles to solve the linear components (residues),
The residues ri are then computed for each signal vector xi as a solution to a simple least squares problem, ri = Z+xi, where Z+ is the pseudo-inverse of Z. The damped sinusoid model for each signal vector, yi, is computed as yi = Zri.
References
- Adjamian P, Worthen SF, Hillebrand A, Furlong PL, Chizh BA, Hobson AR, Aziz Q, Barnes GR. Effective electromagnetic noise cancellation with beamformers and synthetic gradiometry in shielded and partly shielded environments. J Neurosci Methods. 2009;178:120–7. doi: 10.1016/j.jneumeth.2008.12.006. [DOI] [PubMed] [Google Scholar]
- Apkarian AV, Bushnell MC, Treede R, Zubieta J. Human brain mechanisms of pain perception and regulation in health and disease. Eur J Pain. 2005;9:463–84. doi: 10.1016/j.ejpain.2004.11.001. [DOI] [PubMed] [Google Scholar]
- Arendt-Nielsen L, Chen ACN. Lasers and other thermal stimulators for activation of skin nociceptors in humans. Neurophysiol Clin. 2003;33:259–68. doi: 10.1016/j.neucli.2003.10.005. [DOI] [PubMed] [Google Scholar]
- Babiloni C, Capotosto P, Brancucci A, Del Percio C, Petrini L, Buttiglione M, Cibelli G, Romani GL, Rossini PM, Arendt-Nielsen L. Cortical alpha rhythms are related to the anticipation of sensorimotor interaction between painful stimuli and movements: a high-resolution EEG study. Pain. 2008;9:902–11. doi: 10.1016/j.jpain.2008.05.007. [DOI] [PubMed] [Google Scholar]
- Barkhuijsen H, de Beer R, van Ormondt D. Improved algorithm for noniterative time-domain model fitting to exponentially damped magnetic resonance signals. J Magn Reson. 1987;73:553–7. [Google Scholar]
- Druschky K, Lang E, Hummel C, Kaltenhauser M, Kohlloffel LU, Neundorfer B, Stefan H. Pain-related somatosensory evoked magnetic fields induced by controlled ballistic mechanical impacts. J Clin Neurophysiol. 2000;17:613–22. doi: 10.1097/00004691-200011000-00007. [DOI] [PubMed] [Google Scholar]
- Fairhurst M, Wiech K, Dunckley P, Tracey I. Anticipatory brainstem activity predicts neural processing of pain in humans. Pain. 2007;128:101–10. doi: 10.1016/j.pain.2006.09.001. [DOI] [PubMed] [Google Scholar]
- Florin E, Gross J, Pfeifer J, Fink GR, Timmermann L. The effect of filtering on Granger causality based multivariate causality measures. Neuroimage. 2010;50:577–88. doi: 10.1016/j.neuroimage.2009.12.050. [DOI] [PubMed] [Google Scholar]
- Gross J, Baillet S, Barnes GR, Henson RN, Hillebrand A, Jensen O, Jerbi K, Litvak V, Maess B, Oostenveld R, Parkkonen L, Taylor JR, van Wassenhove V, Wibral M, Schoffelen J. Good practice for conducting and reporting MEG research. Neuroimage. 2013;65:349–63. doi: 10.1016/j.neuroimage.2012.10.001. [DOI] [PMC free article] [PubMed] [Google Scholar]
- Hauck M, Lorenz J, Engel AK. Attention to painful stimulation enhances gamma-band activity and synchronization in human sensorimotor cortex. J Neurosci. 2007a;27:9270–7. doi: 10.1523/JNEUROSCI.2283-07.2007. [DOI] [PMC free article] [PubMed] [Google Scholar]
- Hauck M, Lorenz J, Zimmermann R, Debener S, Scharein E, Engel AK. Duration of the cue-to-pain delay increases pain intensity: a combined EEG and MEG study. Exp Brain Res. 2007b;180:205–15. doi: 10.1007/s00221-007-0863-x. [DOI] [PubMed] [Google Scholar]
- Hobson AR, Aziz Q. Central nervous system processing of human visceral pain in health and disease. Physiology. 2003;18:109–14. doi: 10.1152/nips.01428.2002. [DOI] [PubMed] [Google Scholar]
- Hua Y, Sarkar TK. Matrix pencil method for estimating parameters of exponentially damped/undamped sinusoids in noise. IEEE Trans Acoust Speech Signal Process. 1990;38:814–24. [Google Scholar]
- Iannetti GD, Hughes NP, Lee MC, Mouraux A. Determinants of laser-evoked EEG responses: pain perception or stimulus saliency? J Neurophysiol. 2008;100:815–28. doi: 10.1152/jn.00097.2008. [DOI] [PMC free article] [PubMed] [Google Scholar]
- Ikramov KD. Matrix pencils: theory, applications, and numerical methods. J Soviet Math. 1993;64:783–853. [Google Scholar]
- Kay SM, Marple SL. Spectrum analysis – a modern perspective. Proc IEEE. 1981;69:1380–419. [Google Scholar]
- Kobal G. Pain-related electrical potentials of the human nasal mucosa elicited by chemical stimulation. Pain. 1985;22:151–63. doi: 10.1016/0304-3959(85)90175-7. [DOI] [PubMed] [Google Scholar]
- Kung SY, Arun KS, Rao DVB. State-space and singular-value decomposition-based approximation methods for the harmonic retrieval problem. J Opt Soc Am. 1983:73. [Google Scholar]
- Marple SL. Digital spectral analysis: with applications. Englewood cliffs, NJ: Prentice-hall; 1987. [Google Scholar]
- Melzack R. Pain and the neuromatrix in the brain. J Dent Educ. 2001;65:1378–82. [PubMed] [Google Scholar]
- Mitra PP, Pesaran B. Analysis of dynamic brain imaging data. Biophys J. 1999;76:691–708. doi: 10.1016/S0006-3495(99)77236-X. [DOI] [PMC free article] [PubMed] [Google Scholar]
- Nieminen JO, Burghoff M, Trahms L, Ilmoniemi RJ. Polarization encoding as a novel approach to MRI. J Magn Reson. 2010;202:211–6. doi: 10.1016/j.jmr.2009.11.010. [DOI] [PubMed] [Google Scholar]
- Robinson SE, Vrba J. Functional neuroimaging by synthetic aperture magnetometry (SAM) In: Yoshimoto T, Kotani M, Kuriki S, Karibe H, Nakasato N, editors. Recent advances in biomagnetism. Sendai: Tohuku University Press; 1999. pp. 302–5. [Google Scholar]
- Taulu S, Hari R. Removal of magnetoencephalographic artifacts with temporal signal-space separation: demonstration with single-trial auditory-evoked responses. Hum Brain Mapp. 2009;30:1524–34. doi: 10.1002/hbm.20627. [DOI] [PMC free article] [PubMed] [Google Scholar]
- Taulu S, Simola J. Spatiotemporal signal space separation method for rejecting nearby interference in MEG measurements. Phys Med Biol. 2006:51. doi: 10.1088/0031-9155/51/7/008. [DOI] [PubMed] [Google Scholar]
- Tracey I. Imaging pain. Br J Anaesth. 2008;101:32–9. doi: 10.1093/bja/aen102. [DOI] [PubMed] [Google Scholar]
- Treede RD, Apkarian AV, Bromm B, Greenspan JD, Lenz FA. Cortical representation of pain: functional characterization of nociceptive areas near the lateral sulcus. Pain. 2000;87:113–9. doi: 10.1016/S0304-3959(00)00350-X. [DOI] [PubMed] [Google Scholar]
- Uusitalo MA, Ilmoniemi RJ. Signal-space projection method for separating MEG or EEG into components. Med Biol Eng Comput. 1997;35:135–40. doi: 10.1007/BF02534144. [DOI] [PubMed] [Google Scholar]
- Vanhuffel S, Chen H, Decanniere C, Vanhecke P. Algorithm for time-domain NMR data fitting based on total least squares. J Magn Reson. 1994;110:228–37. [Google Scholar]
- Volegov PL, Matlachov AN, Kraus RH., Jr Ultra-low field NMR measurements of liquids and gases with short relaxation times. J Magn Reson. 2006;183:134–41. doi: 10.1016/j.jmr.2006.07.021. [DOI] [PubMed] [Google Scholar]
- Vrba J, Robinson SE. Signal processing in magnetoencephalography. Methods. 2001;25:249–71. doi: 10.1006/meth.2001.1238. [DOI] [PubMed] [Google Scholar]


