

Abstract
Extensive research has recently been conducted on plant factory with artificial light, which is one type of closed plant production system (CPPS) consisting of a thermally insulated and airtight structure, a multi-tier system with lighting devices, air conditioners and fans, a CO2 supply unit, a nutrient solution supply unit, and an environment control unit. One of the research outcomes is the concept of resource use efficiency (RUE) of CPPS.
This paper reviews the characteristics of the CPPS compared with those of the greenhouse, mainly from the viewpoint of RUE, which is defined as the ratio of the amount of the resource fixed or held in plants to the amount of the resource supplied to the CPPS.
It is shown that the use efficiencies of water, CO2 and light energy are considerably higher in the CPPS than those in the greenhouse. On the other hand, there is much more room for improving the light and electric energy use efficiencies of CPPS. Challenging issues for CPPS and RUE are also discussed.
Keywords: closed plant production system, plant factory, resource use efficiency
Introduction
The world is increasingly faced with global problems including unusual weather, environmental pollution, and shortages of water, fossil fuel and plant biomass. Accordingly, the stable and safe supply of plant-derived food and other products will be endangered.1) When leaf vegetables are grown in the open field, their quality and productivity tend to vary with the local climate, weather conditions and soil fertility.2) On the other hand, when plants are grown in the greenhouse, their quality and productivity are generally improved.3) In this case, however, overuse of agrochemicals for plant production and fossil fuel for heating in winter and/or cooling in summer results in excessive emission of environmental pollutants including CO2 gas and water containing fertilizer.4)
Leaf vegetables are increasingly produced under the controlled environment of greenhouses that are located in or near a large city. This is mainly because of the significant savings in resource consumption in terms of the cost and time involved in transporting fresh leaf vegetables from the production site to the consumer.5) In addition, the short transport distance significantly reduces the loss of quality and quantity during the transport of fresh vegetables with about 90% water content.6) These characteristics have recently been discussed with respect to ‘vertical farming’ and urban agriculture.7)
Thus, there is a need to develop a resource-efficient system for producing high-quality leaf vegetables at high yield in a limited land area in a large city, where most consumers live, to minimize the distance between the production and consumption sites of fresh vegetables.
At moderate temperatures, indispensable resources for growing photoautotrophic plants are light energy or photosynthetically active radiation (PAR hereafter; wavelength: 400–700 nm), water, CO2 and inorganic nutrients.8) In order to evaluate and improve the resource use efficiency (ratio of the amount of the resource fixed or held in plants to the amount of the resource supplied (RUE hereafter) in plant production, the concept of ‘closed plant production system with artificial light’ (CPPS hereafter) has been proposed.9–15)
The purpose of using CPPS is to maximize the plant growth with the minimum inputs of light energy, water, CO2 and inorganic fertilizer; in other words, to maximize plant growth with the maximum RUE, resulting in the minimum emission of environmental pollutants and minimum costs for the essential resources. It should be noticed that CPPS is not for production of staple food plants such as rice, wheat, maize and potatoes.
In this paper, the definition and characteristics of the CPPS with respect to RUE are reviewed mainly in terms of the use efficiencies of water, CO2 and light energy. Then, it will be shown that their use efficiencies are considerably higher in the CPPS than in the greenhouse. Electric energy use efficiency of CPPS is also discussed in terms of the light energy conversion ratio of the light source.
In Japan, the number of plant factories with artificial light (PFAL hereafter) for commercial production of leaf vegetables such as lettuce and spinach plants increased from 35 in December 2009 to 106 in December 2011.16) It is estimated that the number increased to over 130 by the end of 2012 and is estimated to increase further in 2013. Research, development and commercial operation of PFAL have recently been extensively conducted in Korea, China and Taiwan as well.15) This movement has also been initiated by the private sector in the US and the Netherlands according to related websites, although scientific papers on this matter are scarce. It is noted, however, that most PFAL are not designed based on the concept of CPPS and are not operated on the basis of the monitoring of RUE.
On the other hand, most facilities with artificial light for producing only transplants (seedlings and plantlets from cuttings or bulblets) are designed and operated based on the concept of CPPS.13,14) The transplants include those of fruit vegetables (tomato, cucumber, eggplant, etc.), leaf vegetables (lettuce and spinach plants, etc.) for hydroponics and flowering bedding plants such as pansy (Viola × wittrockiana Gams). In 2011, CPPS was used commercially at more than 130 locations in Japan.14) In this paper, the RUE of CPPS for production of transplants and leaf vegetables found in the literature is compared with that of the greenhouse, and methods for improving RUE are discussed.
The first commercial PFAL was developed by General Electric (GE) of the US in the early 1970s, but it closed at the beginning of the 1980s. In Japan, the first commercial PFAL, Miura Farm, was established in 1983. This was followed in 1985 by a PFAL at a vegetable sales area in a shopping center.17) Until around 1995, high-pressure sodium lamps were used as the light source. After that, straight-tube fluorescent lamps were the preferred choice mainly due to improvements with respect to PAR output per watt. Then, a multi-layer system with a vertical distance of about 40 cm could be installed in the PFAL, which significantly improved the annual productivity per land area. PFAL using LEDs (light-emitting diodes) as the light source began commercial operation in 2005 in Japan, although the initial investment cost of LEDs was still several times higher than that of fluorescent lamps as of 2013.17) LEDs will become an important light source in PFAL in the near future, since the cost performance has more than doubled every year since 2010.17,18)
The spectral energy distribution and electric-to-light energy conversion factor of the light source are the important factors for assessing the efficiency of the lighting system.17,18) The spectral energy distribution of the light source is important in two aspects: photosynthesis and photomorphogenesis. Photosynthesis is basically affected by photosynthetic photon flux density or photosynthetically active radiation flux with wave band of 400–700 nm. On the other hand, photomorphgenesis and morphology are affected by the light spectrum ranging from around 300–800 nm. Currently, the conversion factors of typical high-pressure sodium and fluorescent lamps are, respectively, around 0.38 and 0.26. Whereas, the conversion factor of recent LED is around 0.40, which will be further improved the forthcoming years.17,18)
Configuration and function of closed plant production system (CPPS)
The CPPS consists of six principal structural elements (Fig. 1):13,14) 1) thermally well-insulated and nearly airtight warehouse-like structure covered with opaque walls; 2) multi-tier system (mostly 4–16 tiers or layers; about 40 cm vertically between tiers) equipped with lighting devices such as fluorescent lamps and LEDs over the culture beds; 3) air conditioners (also known as heat pumps), principally used for cooling and dehumidification to eliminate heat generated by lamps and water vapor transpired from plants in the culture room, and fans for circulating the room air to enhance photosynthesis and transpiration and to achieve uniform spatial air distribution; 4) a CO2 delivery unit to maintain CO2 concentration in the room at 1,000–2,000 µmol mol−1 (or ppm) under light for enhanced plant photosynthesis; 5) a nutrient solution delivery unit; and 6) an environmental control unit including EC (electric conductivity) and pH controllers for the nutrient solution.
Figure 1.

Configuration of the closed plant production system (CPPS) consisting of six principal components. Electricity is needed for operating Nos. 2–6.
The CPPS must be designed and operated to maximize the following functions:13,14) 1) the material and energy balance is controlled to produce the maximum possible amount of usable or salable parts of plants with the highest values using the minimum amount of resources; 2) the percentages of all resources added as energy or raw materials are converted into plants or products (parts of plants), meaning that the RUE of the CPPS is the highest possible, and as a result; 3) there is a minimum release of pollutants into the environment; 4) minimum resource consumption with the highest RUE results in the lowest costs for resources and for recovering environmental pollution.
Among the resources, a considerable amount of electric energy is consumed in the CPPS mainly for lighting and air conditioning. Thus, electric and light energy are the most important resources for improving the use efficiencies in the CPPS.
Definition of resource use efficiency (RUE)
The concept of RUE is schematically shown in Fig. 2. With respect to essential resources for growing plants in CPPS, namely, water, CO2, light energy, electric energy and inorganic fertilizer, the use efficiencies per unit time interval (‘hour’ is used for unit time in this paper) are defined in Eqs. [1]–[10] and illustrated schematically in Fig. 3.19–24) These are WUE (water use efficiency), CUE (CO2 use efficiency) and LUEL (light energy use efficiency with respect to PARL), LUEP (light energy use efficiency with respect to PARP), EUEL (electric energy use efficiency) and FUEI (inorganic fertilizer use efficiency). The unit for each variable on the right-hand side of Eqs. [1] and [3] is kg m−2 (floor area) h−1. These use efficiencies are defined with respect to CPPS containing plants. It should be noted that in the fields of plant ecology and agronomy, WUE is defined with respect to plants or plant community.8) CUE in Eq. [3] is defined only when CO2 is supplied or enriched in the CPPS. Methods for measuring or estimating the values of variables given on the right-hand side of Eqs. [1]–[7] are described in Li et al.23–25)
Figure 2.

Scheme showing the concept of resource use efficiency (RUE). In the CPPS, each resource is converted into produce at its maximum level, so that resource consumption and emission of environmental pollutants are minimized, resulting in the maximum resource use efficiency and lowest cost for resource and pollution processing.
Figure 3.

Schematic diagram showing the rate and state variables in the CPPS. Solid line represents flow of material, and dotted line represents flow of energy. Numbers in brackets represent equation numbers in the text. For the meanings of symbols, see List of symbols, etc. Relationships among the variables are given in Eqs. [1]–[16] in the text.
Water use efficiency (WUE).
 |
[1] |
 |
[2] |
where WC is the mass (or weight) of water collected at the cooling panel of the air conditioner for recycling use; WP is the change in the mass of water held in plants and substrates; WS is the mass of water irrigated (or supplied) to the CPPS; WL is the mass of water vapor lost to the outside by air infiltration through small gaps in the entrance/exit and walls. In Eq. [2], N is the number of air changes per hour in the culture room (h−1), VA is the air volume in the culture room (m3), and Xin and Xout are, respectively, the mass of water vapor per volume of air containing water vapor inside and outside the culture room (kg m−3). Generally, no liquid wastewater is drained from the culture room to the outside. If there is any, it must be added as a variable on the right-hand side of Eq. [1].
CO2 use efficiency (CUE).
 |
[3] |
 |
[4] |
where CP is the net photosynthetic rate; CS is the CO2 supply rate; CR is the respiration rate of workers in the culture room, if any; CL is the rate of CO2 lost to the outside due to air infiltration. CR can be estimated using the data on the number of workers, working hours per person, and hourly amount of CO2 release by human respiration per person (about 0.05 kg h−1).24) In Eq. [4], kC is the conversion factor from volume to mass of CO2, (1.80 kg m−3 at 25℃), N and VA are the same as in Eq. [2], and Cin and Cout are, respectively, CO2 concentration inside and outside the culture room (mol mol−1).
It is assumed in Eqs. [2] and [4] that Xin and Cin at time t are the same as at time (t + δ) where δ is the estimation time interval. If not, the terms (Xin(t) − Xin(t + δ)VA)/δt and (Cin(t) − Cin(t + δ)VA)/δt are, respectively, added on the right-hand side of Eq. [2] and Eq. [4], the value of which is negligibly small in most cases. In a case where Xout and/or Cout change with time during the estimation time interval, the average value is used in Eq. [2] and/or Eq. [4].
Light energy use efficiency of lamps and plant community (LUEL and LUEP).
 |
[5] |
 |
[6] |
where f is the conversion factor from dry mass to chemical energy fixed in dry mass (about 20 MJ kg−1); D is the dry mass increase of whole plants or salable parts of plants in the CPPS (kg m−2 h−1); PARL and PARP are, respectively, photosynthetically active radiation (PAR) emitted from lamps and received at the plant community surface in the CPPS (MJ m−2 h−1).
LUEL and LUEP can also be defined, respectively, as b × CP/PARL and b × CP/PARP where b is the minimum PAR energy to fix one mole of CO2 in plants (0.475 MJ mol−1) and CP is the net photosynthetic rate of plants (mol m−2 h−1). The ratio of PARP to PARL is often referred to as the ‘utilization factor’ in illumination engineering.
Electric energy use efficiency of lighting (EUE).
 |
[7] |
where h is the conversion coefficient from electric energy to PARL energy, which is around 0.25 for white fluorescent lamps, and 0.3–0.4 for recently developed LEDs.17,18) The electric energy consumed by lamps, AL, can be expressed by:
 |
[8] |
Electric energy use efficiency of heat pumps for cooling (COP).
 |
[9] |
where Hh is the heat energy removed from the culture room by heat pumps (air conditioners) (MJ m−2 h−1) and AA is the electricity consumption of the heat pumps (MJ m−2 h−1). This efficiency is often referred to as the coefficient of performance for cooling of heat pumps (COP hereafter).
Inorganic fertilizer use efficiency (FUEI).
 |
[10] |
where IU is the absorption rate of inorganic fertilizer of ion element ‘I’ by plants, and IS is the supply rate of ‘I’ to the CPPS. ‘I’ includes nitrogen (NO3−, NO4+), phosphorous (PO4−), potassium (K+), etc. N is dissolved in water as NH4+ or NO3−, but is counted as N in Eq. [10]. Then, N use efficiency, P use efficiency, K use efficiency, etc. can be defined for each nutrient element.
Results and discussion
WUE, CUE, LUE and EUE for CPPS found in the literature are summarized in Table 1, in comparison with those of a greenhouse with ventilators closed and/or open, together with their theoretical maximum values. In Table 1, LUEL and EUEL are defined only for CPPS using lamps. N/A (not available) in Table 1 means that the efficiencies of WUE, CUE and LUEP can be obtained experimentally but the data were not found in the literature.
Table 1.
Estimated representative values of use efficiencies of water (WUE), CO2 (CUE), light energy (LUEL), and electric energy (EUEL) for CPPS (closed plant production system), and WUE, CUE and LUEP for greenhouses with ventilators closed and/or open. Maximum value for CPPS based on theoretical consideration of each use efficiency is also given in the column ‘Theoretical maximum value’. For the definitions of WUE, CUE, LUEL, EUEL, and EUEP, see Eqs. [1]–[7] in the text. The numerical data in Table 1 is cited from or based on the literature in references Nos. 18–25 and 26–31
| Use efficiency | CPPS | Greenhouse with ventilators closed and enriched CO2 | Greenhouse with ventilators open | Theoretical maximum value for CPPS |
|---|---|---|---|---|
| WUE (water) | 0.95–0.98 | N/A | 0.02–0.03 | 1.00 |
| CUE (CO2) | 0.87–0.89 | 0.4–0.6 | N/A | 1.00 |
| LUEL (lamps, PARL) | 0.027 | - | - | About 0.10 |
| LUEP (plant community) | 0.032–0.043 | N/A | 0.017 | About 0.10 |
| 0.05 | 0.003–0.032 | |||
| EUEL (electricity) | 0.007 | - | - | About 0.04 |
Note: LUEL and EUEL are defined only for CPPS using artificial lamps. N/A (not available) means that the efficiencies of WUE, CUE and LUEP can be obtained experimentally but the data were not found in the literature.
It is shown in Table 1 that WUE and CUE of CPPS are considerably higher compared with those of the greenhouse with ventilators open. LUEP of CPPS ranges between 0.032–0.043, while LUEP of the greenhouse with ventilators open varies from 0.003 to 0.032. As for CPPS, LUEP of 0.032–0.043 is about 60–70% of LUEL of 0.06, which means that PARP is about 60–70% of PARL.
EUEL and LUEL in Table 1 are, respectively, 0.027 and 0.007, which means that 0.7% of electric energy and 2.7% of PAR energy were converted into chemical energy contained in dry matter of plants. Chemical energy contained in dry matter is 20.0 MJ kg−1 (Eqs. [5] and [6]). Thus, electricity consumption to produce one kg of dry matter are 2857 (= 20.0/0.007) MJ/kg or 794 (= 2857/3.6) kWh. Similarly, PAR energy consumed to produce one kg of dry matter is 740 (= 20.0/0.027) MJ/kg or 205 (= 740/3.6) kWh.
Water use efficiency (WUE).
WUE is 0.95–0.98 in the CPPS and 0.02–0.03 in the greenhouse, meaning that WUE of the CPPS is approximately 30 to 50 (nearly equal to 0.95/0.03–0.98/0.02) times greater than that of the greenhouse.20) Namely, CPPS is a highly water-saving plant production system compared with the greenhouse.
CPPS with thermal insulation walls and a high level of airtightness (N is 0.01–0.02 h−1) must be cooled by air conditioning while the lamps are turned on, even on cold winter nights in order to maintain a suitable internal temperature by eliminating the heat generated from the lamps. With cooling, a large portion of the evaporated water, WC in Eq. [1], can be collected as condensation on the cooling panels of the heat pump, and recycled for irrigation. Only a small percentage of WS is lost to the outside, because of the high airtightness of CPPS. The N value must be lower than about 0.02 h−1 to minimize CO2 loss to the outside and prevent entry of insects, pathogens and dust into the culture room.
On the other hand, water vapor evapotranspired in the greenhouse cannot be collected for recycling use, because most of the evapotranspired water vapor is lost to the outside with the ventilated air. The rest of the water vapor is mostly condensed on the inner surfaces of the greenhouse walls, which cannot be collected. The amount of water vapor lost to the outside, WL in Eq. [2], increases with increasing (Xin − Xout) and N of the greenhouse with ventilators open; N varies in a range between 0.5–100 h−1 depending on the number of ventilators and degree of opening as well as the wind velocity outside.26)
If all the lamps are turned off, the relative humidity of the room air in the CPPS approaches 100%, resulting in little transpiration, which may cause physiological disorders of the plants. To avoid this, the tiers in the CPPS are often divided into two or three groups and the lamps in each group are turned on for 12–16 hours per day in rotation to generate heat from the lamps at any time of the day so that the heat pumps are activated all day for dehumidification and cooling of room air.
CO2 use efficiency (CUE).
CUE is 0.87–0.89 in CPPS with N of 0.01–0.02 h−1 and CO2 concentration of 1,000 µmol mol−1, whereas CUE is around 0.5 in the greenhouse with ventilators closed having N of about 0.1 h−1 and enriched CO2 concentration of 700 µmol mol−1.19,21) Thus, CUE is roughly 1.8 (= 0.88/0.50) times higher in CPPS than in the greenhouse with all ventilators closed and CO2 enrichment.21) This is because the amount of CO2 released to the outside, CL in Eq. [4], increases with increasing N and (Cin − Cout). It is thus natural that the set point of CO2 concentration for CO2 enrichment is generally higher (1,000–2,000 µmol mol−1) in the CPPS than in the greenhouse (700–1,000 µmol mol−1).
When N and (Cin − Cout) of the CPPS are constant with time, CUE increases with increasing LAI (leaf area index or ratio of leaf area to cultivation area) in a range between 0 and 3.19) This is because, in Eq. [2], CP increases with increasing LAI but CL is not affected by LAI. In order to maintain a high CUE regardless of LAI, the set point of the CO2 concentration for CO2 enrichment should be increased with increasing LAI.
Light (PARL) energy use efficiencies (LUEL and LUEP).
The average LUEP over tomato seedling production in the greenhouse was 0.017.27) On the other hand, the average LUEL over tomato seedling production in the CPPS was 0.027.22) It should be noted, however, that LUEL of the CPPS in Eq. [5] is estimated based on PARL emitted from the lamps,17,22) whereas LUEP in Eq. [6] of the greenhouse is estimated based on PARP received at the community surface. The ratio PARP/PARL is estimated to be 0.63–0.71.22) Thus, LUEP in the CPPS would be approximately in a range between 0.038 (= 0.027/0.71) and 0.043 (= 0.027/0.63), which is 1.9 (= 0.032/0.017) to 2.5 (= 0.043/0.017) times higher than that in the greenhouse. LUEP in the CPPS increases almost linearly with increasing LAI at LAI of 0–3.22) The maximum LUEP, which is strongly related to the inverse of ‘quantum yield’, is estimated to be of the order of 0.1.8,28) The LUEP of various crops in space research by the NASA group in the US is around 0.05.29–32) Thus, there should be more room for improving the LUEL and LUEP of CPPS.
Improving LUEL and EUEL
Various methods can be considered to improve LUEL in Eq. [5] and thus EUEP in Eq. [6].33) However, as research on improving LUEL is limited, some of the methods described below are not based on experimental data, but rather theoretical consideration and practical experience in commercial plant production using PFAL.
Interplant lighting.
LEDs can be installed just above the culture panels within the plant community for sideward and upward lighting. This interplant lighting provides more light energy to the lower leaves compared with downward lighting only. Then, the net photosynthetic rate of a whole plant community with LAI of about 3 would be increased. This is because the net photosynthetic rate of the lower leaves, which is often negative or nearly zero, will turn to be positive by interplant lighting.34)
The net photosynthetic rate of the upper leaves of a plant community under downward lighting is reduced when a portion of the light energy emitted from the lamps is used for sideward and upward lighting. Net photosynthetic rate of the whole plant community is considered to be maximized when the light energy emitted from the lamps is distributed evenly over all the leaf surfaces.
Improving the ratio of light energy received by leaves.
The LUEL increases with the increasing ratio of light energy received by leaves to light energy emitted by lamps. This ratio can be improved by well-designed light reflectors, reduction in vertical distance between lamps and plants, increase in distance between plants (or planting density) as plants grow, etc.32) The ratio increases linearly from zero up to unity with increasing LAI of 0–3.22) Thus, LUEL can be significantly improved by maintaining LAI at around 3 throughout the culture period by automatic or manual spacing of plants.
Using LEDs.
A direct method for improving EUEL is to use a light source with a high h value in Eq. [7]. The h value of recently developed LEDs is around 0.4,35) whereas that of fluorescent lamps (FL) is around 0.25.33) Although the price of LEDs with h of about 0.4 is several times higher compared with that of FL as of 2013, the price has decreased considerably every year and this trend will continue in the forthcoming several years. Spectral distributions or light quality of LED lamps affect plant growth and development and consequently LUEL.18,32,35–37)
Controlling environmental factors other than light.
LUEL is largely affected by the plant environment and ecophysiological status of plants, as well as by the genetic characteristics of plants. An optimal combination of temperature, CO2 concentration, air current speed, water vapor pressure deficit, and the composition, pH and EC (electric conductivity) of the nutrient solution must be optimized to improve LUEL.28–31,33–36,38–41)
Air current speed.
Horizontal air current speed of 0.3–0.5 m s−1 within the plant community enhances diffusion of CO2 and water vapor from room air into the stomatal cavity in leaves, and consequently photosynthesis, transpiration and thus plant growth, if VPD (vapor pressure deficit) is controlled at an optimum level.39) Control of air current speeds in accordance with plant growth stage by changing the rotation speed of fans is an advantage of CPPS for improving plant growth.
Increasing salable portion of plants.
Electricity is consumed to produce whole plants consisting of leaves with petioles, roots, stems, and sometimes flower stalks and buds. Thus, in order to improve EUEL and LUEL of salable parts of plants, it is important to minimize the dry mass of the non-salable portion of plants. Leaf vegetables such as lettuce plants should be grown with a minimum percentage of root mass, typically lower than 10% of the total mass. This is not so difficult because water stress of plants can be minimized by controlling VPD of the room air and water potential of the nutrient solution in the culture beds of CPPS. In the case of root crops such as turnip plants, the salable portion can be significantly increased by harvesting them earlier than usual so that the aerial part will be edible. This is widely practiced in commercial PFAL.
Electricity consumption: Its percentage by components and COP
Commercial production from CPPS or PFAL is limited to value-added plants because the electricity consumption for lighting to increase the dry mass of plants is significant, and, in general, its cost account for around 25% of the total production cost.15) Accordingly, plants suitable for production in CPPS are those that can be grown at high planting density (50–1,000 plants/m2) to the harvestable stage under relatively low light intensity (100–300 µmol m−2 s−1) and within a short cultivation period (30–60 days). Also, the plant height needs to be lower than around 30 cm because the multi-tier system must be used to increase annual productivity per land area.
Electricity consumption in the culture room of PFAL per floor area (MJ m−2 h−1), AT, and its components are given by:
 |
[11] |
 |
[12] |
where AL, which is expressed as (PARL/h) in Eq. [8], is the electricity consumption for lighting; AA for air conditioning and AM for other equipment such as air circulation fans and nutrient solution pumps. HV is the cooling load due to air infiltration and heat penetration through walls, both of which account for only a small percentage of AA. Hh is the heat energy removed from CPPS using heat pumps. COP is the coefficient of performance of heat pumps as defined in Eq. [9], which increases with decreasing outside temperature at a fixed room air temperature.
On the annual average, AL, AA and AM of CPPS account for, respectively, 85%, 10% and 5% of AT in Tokyo.44) The annual average COP for cooling in a CPPS with room air temperature of 25℃ was 5–6 in Tokyo where the annual average temperature is about 15℃; approximately 4 in summer and 10 in winter.42) Thus, in order to reduce the total electricity consumption, the reduction in AL by improving LUEL is most efficient, followed by the improvement of COP.
Increasing annual production capacity and sales volume per land area
Relative annual production capacity per land area of CPPS with 10 tiers can be nearly 100-fold compared with that of open field, by improving the following five factors: 1) 10-fold by use of 10 tiers; 2) 2-fold by shortening the culture period from transplanting to harvest by optimal environmental control (germination and seedling production are conducted elsewhere in PFAL); 3) 2-fold by extending the annual duration of cultivation by all the year round production with virtually no time loss between harvest and next transplanting; 4) 2-fold by increasing planting density per cultivation area mainly by controlling the air current speed and VPD within the plant community, and increased ratio of cultivation area of each tier to floor area; and 5) 1.5-fold per cropping because there is no damage due to abnormal weather such as strong wind, heavy rain and drought, and outbreak of pest insects. In total, 96-fold (= 10 × 2 × 2 × 2 × 1.2 = 96). Sales price of PFAL-grown lettuce is generally 1.2-fold–1.5-fold due to improved quality compared with that of field-grown plants, resulting in relative annual sales volume of about 115-fold (96 × 1.2 = 115).
Monitoring and controlling RUE and rate variables
Interactions between plants and their environments in a CPPS equipped with a hydroponic culture system are fairly simple compared with those in the greenhouse and open field. This is because the CPPS is thermally well-insulated and nearly airtight, so that the environment is not affected by the weather, especially the fluctuations in solar radiation with time. Therefore, the energy and mass balance of the CPPS and related rate variables (namely, flows that include the time dimension in units) such as those given in Eqs. [1] and [2] can be measured, evaluated and controlled relatively easily.23–25)
The quality of environmental control will be significantly improved by monitoring, visualizing, understanding and controlling the RUE (WUE, CUE, LUEL, EUEL and FUE in Eqs. [1]–[10]) and rate variables. The rate variables include the rates of net photosynthesis (gross photosynthesis minus dark and photorespirations), dark respiration, transpiration, water uptake, and nutrient uptake, which represent the ecophysiological status of the plant community. Another group of rate variables includes the supply rates of CO2, irrigation water, fertilizer constituents, and electricity consumption by its components in the CPPS.
The set points of environmental factors can be determined, for example, for maximizing LUEL, with the minimum resource consumption or at the lowest cost.33) In order to maximize the cost performance (ratio of economic benefit to production cost), instead of maximizing the LUEL, the concept and method of integrative environmental control must be introduced.43,44) Continuous monitoring, visualizing and controlling of the rate variables and RUE will become important research subjects in the integrated environmental control for plant production using CPPS.43,44)
Net photosynthetic rate (CP).
CP at time t during the time interval of δt can be estimated by modifying Eqs. [3] and [4] as follows:
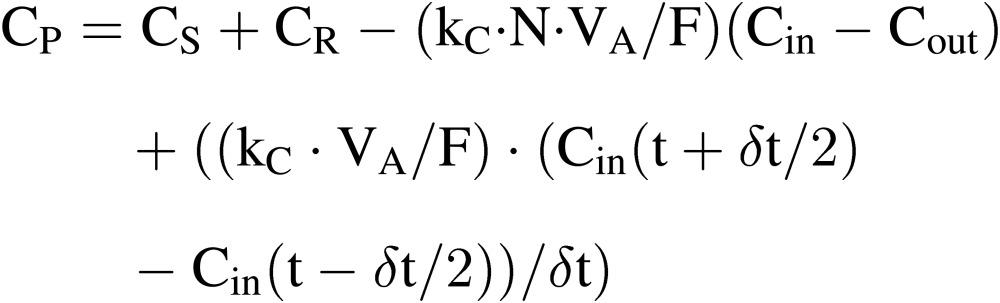 |
[13] |
where the fourth term expresses the change in CO2 mass in the air of the culture room during the time interval of δt between (t − δt/2) and (t + δt/2). For practical application, δt would be 0.5–1.0 h. CP can be estimated fairly accurately using Eq. [13], since 1) kC and VA are constant; 2) CS, Cin and Cout can be accurately measured; and 3) N can be estimated using Eq. [13] as described later.
Transpiration rate (WT).
In a CPPS, the transpiration rate of plants grown in the hydroponic culture beds in the CPPS at time t during the time interval of δt, WT, can be estimated by Eq. [14]. In the CPPS, no evaporation from the substrate in the culture can be assumed, because the culture beds are covered with plastic panels with small holes for growing plants. In the CPPS, neither evaporation nor condensation from/to the walls and floor can also be assumed, because the walls and floors are thermally well insulated.
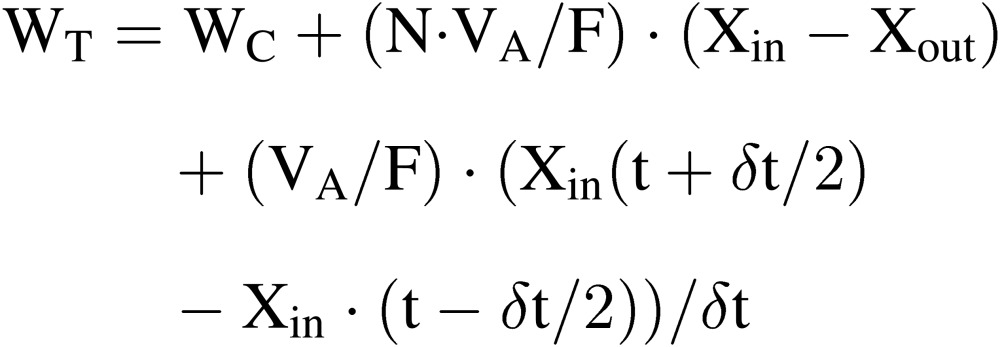 |
[14] |
where the third term expresses the change in water vapor mass in the air of the culture room during the time interval of δt between (t − δt/2) and (t + δt/2). Since VA and F are constants, and WC, Xin and Xout can be measured relatively accurately, N can be estimated for the time interval of (t − δt/2) and (t + δt/2) using Eq. [14′].23,43–45)
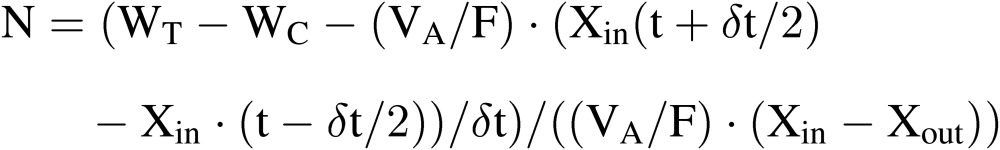 |
(14′) |
Water uptake rate by plants (WU).
WU can be expressed by modifying Eq. [14] as:
 |
[15] |
where WP is the change in water mass of plants during time interval δ, which is difficult to estimate accurately. On the other hand, WU can be estimated relatively easily by the equation:
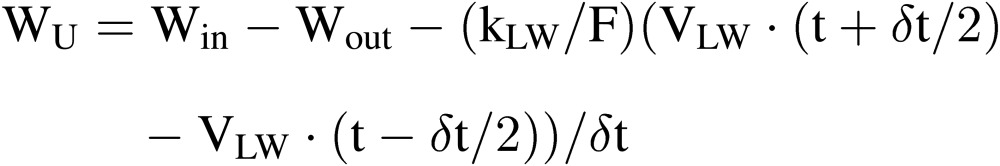 |
[16] |
where Win and Wout are, respectively, the flow rate of nutrient solution into and from the culture beds. (VLW(t + δt/2) − VLW(t − δt/2)) is the change in nutrient solution volume in the culture beds and/or the nutrient solution tank during the time interval of δt. WU in Eq. [16] can be estimated for each culture bed or for all the culture beds, by changing the measuring points of Win and Wout.
Ion uptake rate by plants (IU).
The ion uptake rate by plants in the culture bed, IU, can be estimated by:
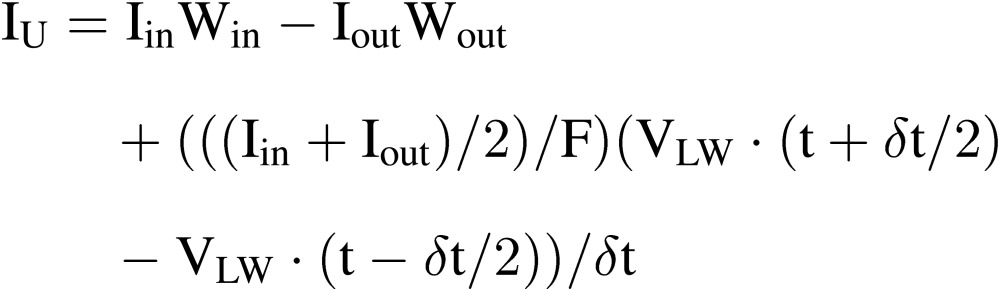 |
[17] |
where Iin and Iout are, respectively, the concentration of ion ‘I’ at the inlet and outlet of the culture bed. Win and Wout are, respectively, the flow rate of nutrient solution at the inlet and outlet of the culture bed. The third term shows the change in amount of ion ‘I’ in the culture beds during the time interval of δ. IU can be measured for each culture bed, more than one culture bed or all the culture beds.
Inorganic fertilizer use efficiency (FUEI).
The culture beds in the CPPS are isolated from the soil, and the nutrient solution drained from the culture beds is returned to the nutrient solution tank for recirculation. Nutrient solution is rarely discharged to the outside, usually about once or twice a year when certain ions such as Na+ and Cl−, which are not well absorbed by plants, have excessively accumulated in the nutrient solution or when certain pathogens are spread in the culture beds by accident. In these cases, the supply of fertilizer is stopped for several days before removing the plants from the culture beds so that most nutrient elements in the culture beds and nutrient tank are absorbed by the plants. Then, the discharged water from the CPPS to the outside is relatively clean. Therefore, FUEI of the CPPS should be fairly high, even though no literature is found regarding this subject.
On the other hand, FUEI of the greenhouse and open field is relatively low, which occasionally causes salt accumulation on the soil surface.46) In the open field, excess supply of nitrates and phosphates occasionally causes nutrient run-off and leaching, resulting in eutrophication in river and lakes.46,47)
Applications.
The estimation methods of rate variables given above can be applied to small CPPS-type plant growth chambers used for research, education, self-learning and hobby purposes,48) as well as PFAL for commercial plant production.
Since all the major rate and state variables in the CPPS can be measured and graphically displayed, the quantitative relationships among these variables can be analyzed and understood relatively easily. This benefit could be enhanced when the relationships are displayed together with camera images of the plants. Major rate and state variables of the CPPS are schematically shown in Fig. 3.
Toward sustainable plant production system (SPPS)
Any plant production system needs to be developed or improved to be as sustainable as possible.48–50) The CPPS should relatively satisfy the necessary (but not sufficient) conditions of a system with high sustainability for production of functional plants such as leaf vegetables, medicinal plants and transplants, compared with the greenhouse, because:
1) The CPPS is operated to obtain the maximum yield or value with the minimum amount of resources and minimum emission of environmental pollutants including CO2 gas, resulting in high use efficiencies of water, CO2, light energy/electricity, and inorganic fertilizer.
2) The CPPS consists of six principal structural components, as shown in Fig. 1, which are established in society to recycle the structural components after they have reached the end of their service lives.
3) The CPPS heightens the stability of plant production in the face of abnormal weather and the presence of pathogens and other contaminants, and achieves planned high quality and high yields all year.
4) The CPPS saves considerable land area per plant productivity, resulting in saving labor hours per production. In addition, the CPPS can be built in a shaded area, an unused space or the basement of a building, etc.
5) The CPPS is safe and pleasant for the operators under unfavorable weather conditions, providing greater potential to bring out the creativity of the operators, and contributing to creating an industry in which environmental safety and welfare can coexist. High airtightness of the CPPS prevents the entry of insects and/or pathogens. Thus, no pesticides are necessary. Also, the rigid structure prevents theft and physical damage.
6) Thermally well-insulated CPPS needs no heating even on cold winter nights by turning on a certain number of lamps, which generate heat energy to keep the room air temperature sufficiently high. Also, since heat penetration and air infiltration are minimal with no penetration of solar radiation energy, the cooling load of the CPPS is almost equal to the heat generated by the lamps and other electric equipment.
7) The CPPS has high potential to contribute to expanding employment opportunities throughout the year under any climate conditions, and giving meaning to life for a broad range of people, including the aged and disabled, since the working environment is mostly maintained at an air temperature of about 25℃ and relative humidity of 70–80%. The workers can also enjoy watching the plants grow at a relatively high speed. It is estimated that a PFAL with 10 tiers and total floor area of 1 ha creates job opportunities for approximately 300 persons for plant production alone. At a commercial PFAL with culture room floor area of 338 m2 in Kashiwa city in Chiba, Japan has an annual production capacity of one million leaf lettuce heads by one manager and 10 part-time workers (7 working hours per day) for production. Thus, it is roughly estimated that nearly 300 (= 10 × (10,000/338) part-time workers would be necessary to operate a PFAL with floor area of 1 ha.
8) The CPPS as a whole, including its operators, can aptly evolve with changes in the natural environment and diverse social environments. In the CPPS with a well-controlled environment, the relationships among the environment, plant growth and the plant’s functional components are relatively straightforward. It is then easy to devise and implement effective methods of controlling the environment for the optimal growth of plants, and to improve the cultivation systems. The environmental effects on plant growth in CPPS become much simpler and more understandable compared with those in the greenhouse.
9) The CPPS facilitates international technology transfer through the development of standardized systems to be shared globally. After all, LCA of CPPS including its construction, operation and termination can be evaluated more easily, regardless of its physical size, which may make the CPPS a relatively universal plant production system. It should be noted, however, that application of CPPS is limited to the production of leaf vegetables, transplants (seedlings, etc.) and some other high-value or functional plants usually grown in the greenhouses. Thus, CPPS will never absorb the traditional outdoor farming systems. On the other hand, CPPS has been commercially used at around 150 different locations in Japan, and the number of CPPS has been increasing steadily year by year.
Challenges
On the other hand, there are several challenging issues to improving the CPPS as sustainable as possible. For examples:
Using the information of rate variables together with state variables.
Measurement and control of the CPPS and greenhouse environments are conventionally conducted based on the physical state variables (without time dimension in units) such as air temperature, relative humidity, CO2 concentration, EC and pH of nutrient solution, with the exception of PAR (MJ m−2 h−1). Research on continuous intact measurement, estimation or visualization of state variables of plants such as stomatal conductance, chlorophyll fluorescence and water content in plant leaves has also been conducted.49)
The information on state variables will become more useful when used for control purposes together with the information on rate variables such as rates of net photosynthesis, transpiration and ion uptake. Measurement and control of the plant environment based on both the rate and state variables will open a new field of technology and science in plant production.24)
LCA, food mileage and virtual water.
Life cycle assessment (LCA) is required for a quantitative discussion on RUE of a whole food supply chain,50) including the resources consumed in establishing a plant production system, human and machinery resources for cultivation and harvesting, processing of harvests, transportation and packaging of produce, and processing of plant residue at the consumers’ side.
LCA and analyses of food mileage and virtual water of agricultural and horticultural production in the open fields and in the greenhouse have been conducted.50–54) Similar studies need to be conducted in the near future for comparisons among open field, greenhouse and CPPS.55) For the LCA of PFAL, the following points need to be considered: 1) the plants grown in CPPS are clean and free of insects and agrochemicals, so that washing and inspection for eliminating insects and agrochemicals after production are unnecessary; 2) the CPPS can be built close to consumers or manufacturer sites, so that resource consumption for transportation and packing, and loss of produce due to damage during transportation can be significantly reduced.
Networks of real and virtual PFALs.
A network linking PFALs via the Internet needs to be opened up, which brings about the following possibilities.56,57) The latest information on cultivation methods and plant varieties can be downloaded from cloud servers. Growers can exchange ideas about cultivation and food preparation using social network services (SNS), and they can remotely check, in real time, how their plants are doing by using built-in cameras. They can ascertain environmental data, and adjust these settings. Growers can upload their own cultivation instructions onto cloud servers, making them available to others. Social media tools such as Twitter and Facebook can also be used by the grower members for exchanges of information and opinions.
A trial project along these lines using small household PFAL was launched in 2012 in Kashiwa City, Japan.55) The project is examining (1) how people can grow vegetables in household spaces; (2) the effectiveness of providing cultivation advice and the operability of factory equipment; and (3) the value added from creating a network. It also examines the usefulness and commercial feasibility of an exclusively web-based service where growers can ask experts questions on cultivation management, share information on their own circumstances and experiences, and arrange to swap the vegetables they have grown. The experiences and results obtained from this project can be applied to networks that link schools, local communities, hobby grower groups, restaurants, hospitals, and hotels. By being connected to household and local community energy management systems, these networks can also form a part of those systems.
With a virtual PFAL system incorporating an e-learning function, and a real PFAL system involving the actual cultivation of plants, these networks have a dual aspect as an extended form of both. In the virtual system, growers can operate a PFAL using a simulator that incorporates a plant growth model, an environment model, and a business model, and after attaining a certain level of proficiency there, they can move on to trying their hand at operating a real PFAL, or they can engage in both in parallel.
As people become familiar with this model, their ability to achieve the greatest possible production of food and quality of life will become second nature, as they minimize their environmental impact by reducing their electricity and water consumption, eliminating the production of wastewater, absorbing carbon dioxide, and producing more oxygen for the atmosphere.
Residents/users living in urban areas and having little chance to grow plants in the open field may enjoy using a household PFAL. It is suggested that such a PFAL and its network have a potential to contribute to a better life of some people in urban areas.56)
Conclusion
Community interest in PFAL has grown along with the unusual weather, uncontrollable fluctuations in the oil price, and greater community concern for health, safety and security. On the other hand, PFAL has evoked criticism and concern regarding the involvement of electricity- and other resource-consuming characteristics for plant production.
This paper addresses the criticism that PFAL systems make heavy use of electricity, and that they have high production costs and are not financially viable. This paper shows that PFAL, if properly designed and operated, can contribute to the production of value-added plants at high yield with efficient resource consumption — especially electricity consumption — and without environmental pollution. On the other hand, there are many possibilities and challenges for the further improvement and diverse application of CPPS.
Acknowledgement
The author would like to express his sincere thanks to Dr. Michihiro Hara, Professor Emeritus of Iwate University, for his skillful examination of Equations [1]–[17] in the text.
Abbreviations
- COP
Coefficient of performance for cooling
- CPPS
Closed plant production system
- EC
Electric conductivity of nutrient solution
- FL
Fluorescent lamp
- LAI
Leaf area index
- LCA
Life cycle assessment
- LED
Light emitting diode
- PAR
Photosynthetically active radiation
- PFAL
Plant factory with artificial light
- RUE
Resource use efficiency
- SPPS
Sustainable plant production system
- VPD
Water vapor partial pressure deficit
Profile
Toyoki Kozai was born in 1943. After establishing his early work on greenhouse solar light transmission, ventilation, and energy saving, he performed pioneering work on photoautotrophic culture of in vitro plants. This study led to a development of closed plant production system with artificial light and its commercialization. He was promoted to Professor of Chiba University in 1990 and became Dean of Faculty of Horticulture in 1999, Director of Center for Environment, Health and Field Sciences in 2003, and President of Chiba University in 2005. He was back in research in 2008 as a professor at the Center mentioned above, with a focus on medicinal plant production under controlled environments. He was awarded Japan Prize of Agricultural Science from Association of Japanese Agricultural Scientific Societies, Purple Ribbon Award from Japanese Ministry of Education, Culture, Sports, Science and Technology and Lifetime Achievement Award from The Society for In Vitro Biology. Since 2010, he has been working as the Chief-director of Japan Plant Factory Association (non-profit organization) and is leading research, development and extension of plant factories.
Appendix
List of symbols, variables and coefficient names, units and equation numbers
| Symbol | Variable name | Unit | Eq. No. |
|---|---|---|---|
| AA | Electricity consumption of air conditioners (heat pumps) | MJ m−2 | 9, 11, 12 |
| AL | Electricity consumption of lamps | MJ m−2 | 8, 11, 12 |
| AM | Electricity consumption of water pumps, air fans, etc. | MJ m−2 | 11, 12 |
| AT | Total electricity consumption (AA + AL + AM) | MJ m−2 | 11 |
| CUE | CO2 use efficiency | - | 3 |
| COP | Coefficient of performance of heat pumps for cooling | - | 9, 12 |
| Cin | CO2 concentration of room air | mol mol−1 | 4, 13 |
| Cout | CO2 concentration of outside air | mol mol−1 | 4, 13 |
| CL | CO2 loss to the outside | kg m−2 | 3, 4 |
| CP | CO2 fixed by plants | kg m−2 | 3, 13 |
| CR | CO2 released in room air by human respiration | kg m−2 | 3, 13 |
| CS | CO2 supplied to room air from CO2 cylinder | kg m−2 | 3, 13 |
| D | Dry mass increase of plants | kg m−2 | 5, 6, 7 |
| EUEL | Electric energy use efficiency | - | 7 |
| F | Floor area of culture room | m2 | 13, 14, 16, 17 |
| f | Conversion factor from plant dry mass to chemical energy, 20 MJ kg−1 | MJ kg−1 | 5, 6, 7 |
| FUEI | Inorganic fertilizer use efficiency | mol m−2 | 10 |
| h | Conversion factor from electric energy to PARL | - | 7, 8 |
| Hh | Heat energy removed from culture room by heat pumps | MJ m−2 h−1 | 9, 12 |
| HV | Heat energy exchange by air infiltration and penetration through walls | MJ m−2 h−1 | 12 |
| Iin | Ion concentration of ‘I’ in nutrient solution at the inlet of culture beds | mol mol−1 | 17 |
| Iout | Ion concentration of ‘I’ in nutrient solution at the outlet of culture beds | mol mol−1 | 17 |
| IS | Supply rate of inorganic fertilizer ion element ‘I’ supplied to the CPPS | mol m−2 h−1 | 10 |
| IU | Absorption rate of inorganic fertilizer ion element ‘I’ by plants | mol m−2 h−1 | 10, 17 |
| kC | Conversion factor from volume to mass of CO2 1.80 kg m−3 at 25℃ and 101.3 kPA | kg m−3 | 4, 13 |
| kLW | Conversion factor from volume to mass of liquid water | kg m−3 | 16 |
| (997 kg m−3 at 25℃ and 101.3 kPa) | |||
| LUEL | Light energy use efficiency with respect to PARL | - | 5, 7 |
| LUEP | Light energy use efficiency with respect to PARP | - | 6 |
| N | Number of air exchanges | h−1 | 2, 4, 13, 14 |
| PARL | Photosynthetically active radiation emitted from lamps | MJ m−2 h−1 | 5, 7, 8 |
| PARP | Photosynthetically active radiation received at plant community surface | MJ m−2 h−1 | 6 |
| VA | Volume of room air | m3 | 2, 4, 13, 14 |
| VLW | Volume of nutrient solution in culture beds | m3 | 16, 17 |
| Xin | Water vapor density of room air | kg m−3 | 2, 14 |
| Xout | Water vapor density of outside air | kg m−3 | 2, 14 |
| WC | Liquid water collected for recycling use in the CPPS | kg m−2 h−1 | 1, 14 |
| WL | Water vapor loss rate from the CPPS to the outside | kg m−2 h−1 | 1, 2 |
| WP | Water held in plants in the CPPS | kg m−2 h−1 | 1, 15 |
| WS | Liquid water supply rate into the CPPS | kg m−2 h−1 | 1 |
| WT | Tanspiration rate of plants in the CPPS | kg m−2 h−1 | 14, 15 |
| WU | Water uptake rate of plants in culture beds in the CPPS | kg m−2 h−1 | 15, 16 |
| Win | Water inflow rate to hydroponic culture beds in the CPPS | kg m−2 h−1 | 16, 17 |
| Wout | Water outflow rate from hydroponic culture beds in the CPPS | kg m−2 h−1 | 16, 17 |
| WUE | Water use efficiency | - | 1 |
References
- 1).Rosenzweig, C. and Liverman, D. (1992) Predicted effects of climate change on agriculture: A comparison of temperate and tropical regions. In Global Climate Change: Implication, Challenges and Mitigation Measures, Philadelphia (ed. Majumdar, S.K.). Pennsylvania Academy of Sciences, pp. 342–361. [Google Scholar]
- 2).Wilson J.P., Gerhart E.S., Nielsen G.A., Ryan C.M. (1992) Climate, soil and crop yield relationships in Cascade County, Montana. Appl. Geogr. 12, 261–279 [Google Scholar]
- 3).Castilla N., Hernandez J. (2007) Greenhouse technological packages for high quality crop production. Acta Hortic. 761, 285–297 [Google Scholar]
- 4).Ozkan B., Kurklu A., Akcaoz H. (2004) An input-output energy analysis in greenhouse vegetable production: A case study for Antalya region of Turkey. Biomass and Energy 26, 89–95 [Google Scholar]
- 5).Ohyama K., Takagaki M., Kurasaka H. (2008) Urban horticulture: its significance to environmental conservation. Sustainability Science 3, 241–247 [Google Scholar]
- 6).Atanda S.A., Pessu P.O., Agoda S., Isong I.U., Ikotun I. (2011) The concepts and problems of post-harvest food losses in perishable crops. African J. Food Science 5, 603–613 [Google Scholar]
- 7).Despommier, D. (2010) The Vertical Farm — Feeding the world in the 21st century. St. Martin’s Press, New York. [Google Scholar]
- 8).Salisbury, F.B. and Ross, C.W. (1991) Plant physiology. Wadsworth Publishing Company, Belmont, Calif. [Google Scholar]
- 9).Kozai, T. (1999) Development and Application of Closed Transplant Production System. Yokendo Pub. Co., Tokyo. [Google Scholar]
- 10).Kozai, T., Kubota, C., Chun, C., Afreen, F. and Ohyama, K. (2000) Necessity and concept of the closed transplant production system. In Transplant Production in the 21st Century (eds. Kubota, C. and Chun, C.). Kluwer Academic Publishers, The Netherlands, pp. 3–19. [Google Scholar]
- 11).Kozai, T. (2005) Closed systems for high quality transplants using minimum resources. In Plant Tissue Culture Engineering (eds. Gupta, S. and Ibaraki, Y.). Springer, Berlin, pp. 275–312. [Google Scholar]
- 12).Kozai, T., Afreen, F. and Zobayed, S.M.A. (eds.) (2005) Photoautotrophic (Sugar-Free Medium) Micropropagation as a New Micropropagation and Transplant Production System. Springer, Dordrecht, The Netherlands. [Google Scholar]
- 13).Kozai T., Ohyama K., Chun C. (2006) Commercialized closed systems with artificial lighting for plant production. Acta Hortic. 711, 61–70 [Google Scholar]
- 14).Kozai T. (2007) Propagation, grafting, and transplant production in closed systems with artificial lighting for commercialization in Japan. J. Ornamental Plants 7 (3), 145–149 [Google Scholar]
- 15).Kozai, T. (2012) Plant Factory with Artificial Light. Ohm Publishing Company (in Japanese). [Google Scholar]
- 16).SuperHort Project Association (2012) Report on Advance Horticulture 2012 (in Japanese). [Google Scholar]
- 17).Takatsuji, M. and Mori, Y. (2011) LED Plant factory. Nikkan Kogyo Co., Tokyo, p. 4 (in Japanese). [Google Scholar]
- 18).Mitchell C.A., Both A.-J., Bourget C.M., Burr J.F., Kubota C., Lopez R.G., Morrow R.C., Runkle E.S. (2012) LEDs: The future of greenhouse lighting! Chron. Horticult. 52 (1), 6–11 [Google Scholar]
- 19).Yoshinaga K., Ohyama K., Kozai T. (2000) Energy and mass balance of a closed-type transplant production system (Part 3) — Carbon dioxide balance. J. SHITA 13, 225–231(in Japanese with English abstract and captions) [Google Scholar]
- 20).Ohyama K., Yoshinaga K., Kozai T. (2000) Energy and mass balance of a closed-type transplant production system (Part 2) — Water balance. J. SHITA 12 (4), 217–224(in Japanese with English abstract and captions) [Google Scholar]
- 21).Yokoi S., Kozai T., Hasegawa T., Chun C., Kubota C. (2005) CO2 and water utilization efficiencies of a closed transplant production system as affected by leaf area index of tomato seedling populations and the number of air exchanges. J. SHITA 18, 182–186(in Japanese with English abstract and captions) [Google Scholar]
- 22).Yokoi S., Kozai T., Ohyama K., Hasegwa T., Chun C., Kubota C. (2003) Effects of leaf area index of tomato seedling population on energy utilization efficiencies in a closed transplant production system. J. SHITA 15, 231–238(in Japanese with English abstract and captions) [Google Scholar]
- 23).Li M., Kozai T., Niu G., Takagaki M. (2012) Estimating the air exchange rate using water vapour as a tracer gas in a semi-closed growth chamber. Biosystems Eng. 113, 94–101 [Google Scholar]
- 24).Li M., Kozai T., Ohyama K., Shimamura S., Gonda K., Sekiyama S. (2012) Estimation of hourly CO2 assimilation rate of lettuce plants in a closed system with artificial lighting for commercial production. Eco-engineering 24 (3), 77–83 [Google Scholar]
- 25).Li M., Kozai T., Ohyama K., Shimamura D., Gonda K., Sekiyama T. (2012) CO2 balance of a commercial closed system with artificial lighting for producing lettuce plants. HortScience 47 (9), 1257–1260 [Google Scholar]
- 26).Chiapale J.P., de Villele O., Kittas C. (1984) Estimation of ventilation requirements of a plastic greenhouse. Acta Hortic. 154, 257–264(in French with English abstract) [Google Scholar]
- 27).Shibuya T., Kozai T. (2001) Light-use and water-use efficiencies of tomato plug sheets in the greenhouse. Environment Control in Biology 39, 35–42(in Japanese with English abstract and captions) [Google Scholar]
- 28).Bugbee B.G., Salisbury F.B. (1988) Exploring the limits of crop productivity I Photosynthetic efficiency of wheat in high irradiance environments. Plant Physiol. 88, 869–878 [DOI] [PMC free article] [PubMed] [Google Scholar]
- 29).Sager J.C., Edwards J.L., Klein W.H. (2011) Light energy utilization efficiency for photosynthesis. Trans. ASAE 25 (6), 1737–1746 [Google Scholar]
- 30).Wheeler R.M., Mackowiac C.L., Stutte G.W., Yorio N.C., Rufffe L.M., Sager J.C., Prince R.P., Knott W.M. (2006) Crop productivities and radiation use efficiencies for bioregenerative life support. Adv. Space Res. 41, 706–713 [Google Scholar]
- 31).Wheeler R.M. (2006) Potato and human exploration of space: Some observations from NASA-sponsored controlled environment studies. Potato Res. 49, 67–90 [Google Scholar]
- 32).Massa G.D., Kim H.-H., Wheeler R.M. (2008) Plant productivity in response to LED lighting. HortScience 43 (7), 1951–1956 [Google Scholar]
- 33).Kozai T. (2011) Improving light energy utilization efficiency for a sustainable plant factory with artificial light. Proc. of Green Lighting Shanghai Forum 2011, 375–383 [Google Scholar]
- 34).Dueck T.A., Grashoff C., Broekhuijsen G., Marcelis L.F.M. (2006) Efficiency of light energy used by leaves situated in different levels of a sweet pepper canopy. Acta Hortic. 711, 201–205 [Google Scholar]
- 35).Liu, W.K., Yang, Q. and Wei, L.L. (2012) Light Emitting Diodes (LEDs) and Their Applications in Protected Horticulture as a Light Source. China Agric. Sci. Tech. Pub., Beijing (in Chinese). [Google Scholar]
- 36).Morrow R.C. (2008) LED lighting in horticulture. HortScience 43 (7), 1947–1950 [Google Scholar]
- 37).Jokinen K., Sakka L.E., Nakkila J. (2012) Improving sweet pepper productivity by LED interlighting. Acta Hortic. 956, 59–66 [Google Scholar]
- 38).Thongbai P., Koai T., Ohyama K. (2011) Promoting net photosynthesis and CO2 utilization efficiency by moderately increased CO2 concentration and air current speed in a growth chamber and a ventilated greenhouse. J. of ISSAAS 17, 121–134 [Google Scholar]
- 39).Yabuki, K. (2004) Photosynthetic Rate and Dynamic Environment. Kluwer Academic Publishers, Dordrecht. [Google Scholar]
- 40).Nederhoff E.M., Vegter J.G. (1994) Photosynthesis of stands of tomato, cucumber and sweet pepper measured in greenhouses under various CO2-concentrations. Ann. Bot. (Lond.) 73, 353–361 [Google Scholar]
- 41).Evans J.R., Poorter H. (2001) Photosynthetic acclimation of plants to growth irradiance: the relative importance of specific leaf area and nitrogen partitioning in maximizing carbon gain. Plant Cell Environ. 24, 755–767 [Google Scholar]
- 42).Ohyama K., Kozai T., Kubota C., Chun C. (2002) Coefficient of performance for cooling of a home-use air conditioner installed in a closed-type transplant production system. J. SHITA 14, 141–146(in Japanese with English abstract and captions) [Google Scholar]
- 43).Kozai T., Ohyama K., Tong Y., Tongbai P., Nishioka N. (2011) Integrative environmental control using heat pumps for reductions in energy consumption and CO2 gas emission, humidity control and air circulation. Acta Hortic. 893, 445–449 [Google Scholar]
- 44).Dayan E., Presnov E., Dayan J., Shavit A. (2004) A system for measurement of transpiration, air movement and photosynthesis in the greenhouse. Acta Hortic. 654, 123–130 [Google Scholar]
- 45).Kozai, T., Li, M. and Tong, Y. (2011) Plant environment control by integrating resource use efficiencies and rate variables with state variables of plants. Proc. of Osaka Forum 2011, Japanese Society of Agricultural, Biological and Environmental Engineers and Scientists, Osaka, pp. 37–54 (in Japanese). [Google Scholar]
- 46).Nishio, M. (2005) Agriculture and environmental pollution — soil environment policy and technology in Japan and the world. Nohbunkyo, Tokyo (in Japanese). [Google Scholar]
- 47).Sharpley, A.N.T., Daniel, T., Sims, J., Lemunyon, R., Stevens, R. and Parry, R. (2003) Agricultural phosphorous and eutrophication. Second ed. US Department of Agriculture, Agricultural Research Service, ARS-149, Maryland. [Google Scholar]
- 48).Kozai, T. (2013) Innovation in agriculture: plant factories with artificial light. APO News, January-February Issue, 2–3.
- 49).Ohmasa K., Takayama K. (2003) Simultaneous measurement of stomatal conductance, non-photochemical quenching, and photochemical yield of photosystem II in intact leaves by thermal and chlorophyll fluorescence imaging. Plant Cell Physiol. 44, 1290–1300 [DOI] [PubMed] [Google Scholar]
- 50).Brentrup F., Kusters J., Kuhlmann H., Lammel J. (2001) Application of the Life Cycle Assessment methodology to agricultural production. Eur. J. Agron. 14, 221–233 [Google Scholar]
- 51).Ozkan B., Kurklu A., Akcaoz H. (2004) An input-output energy analysis in greenhouse vegetable production: A case study for Antalya region in Turkey. Biomass and Energy 26, 89–95 [Google Scholar]
- 52).Christopher L.W., Matthews H.S. (2008) Food-miles and the relative climate impact of food choices in the United States. Environ. Sci. Technol. 42, 3508–3513 [DOI] [PubMed] [Google Scholar]
- 53).Roy P., Nei D., Okadome H., Nakamura N., Orikasa T., Shiina O. (2008) Life cycle inventory analysis of fresh tomato distribution systems in Japan considering the quality aspect. J. Food Eng. 86, 225–233 [Google Scholar]
- 54).Oki, T., Sato, M., Kawamura, M., Miyake, M., Kanae, S. and Musiake, M. (2003) Virtual water trade to Japan and in the world. In Virtual Water Trade (ed. Hoekstra, A.Y.). Proc. of the International Expert Meeting on Virtual Water Trade, Delft, The Netherlands. Value of Water Research Report Series No. 12, pp. 221–235. [Google Scholar]
- 55).Ohyama K., Manabe K., Ohmura Y., Kubota C., Kozai T. (2003) A comparison between closed- and open-type transplant production systems with respect to quality of tomato plug transplants and resource consumption during summer. Environment Control in Biology 41, 57–61(in Japanese with English abstract and captions) [Google Scholar]
- 56).Kozai T. (2013) Plant factory in Japan — current situation and perspectives. Chron. Horticult. 53 (2), 8–11 [Google Scholar]
- 57).Yang, Q.C., Wei, L.L., Liu, W.K. and Cheng, R.F. (2012) Plant Factories: systems and practice. Chemical Industry Pub. Co. Beijing (in Chinese). [Google Scholar]