

Abstract
Maternal diabetes and obesity are independent risk factors for neural tube defects, although it is unclear whether the effects are mediated by common pathogenic mechanisms. In this manuscript, we report a genome-wide survey of histone acetylation in neurulation stage embryos from mouse pregnancies with different metabolic conditions: maternal diabetes, and maternal consumption of a high fat content diet. We find that maternal diabetes, and independently, exposure to high-fat diet, are associated with increases and decreases of H3 and H4 histone acetylation in the embryo. Intriguingly, changes of H3K27 acetylation marks are significantly enriched near genes known to cause neural tube defects in mouse mutants. These data suggest that epigenetic changes in response to diet and metabolic condition may contribute to increased risk for neural tube defects in diabetic and obese pregnancies. Importantly, the responses to high-fat diet and maternal diabetes were distinct, suggesting that perturbed embryonic development under these conditions is mediated by different molecular pathways. This conclusion is supported by morphometric analyses that reveal a trend for maternal diabetes to delay embryonic development in the C57BL/6 strain, while high-fat diet appears to be associated with accelerated development. Taken together, our results link changes in histone acetylation to metabolic conditions during pregnancy, and implicate distinct epigenetic mechanisms in susceptibility to neural tube defects under conditions of maternal diabetes and obesity.
Keywords: choomating, diabetic embryopathy, epigenetic, gene expression, high-fat diet, inbread mouse, neural tube defect, obesity
INTRODUCTION
Adverse Pregnancy Conditions and Embryonic Development
Diabetes during pregnancy has well-documented teratogenic effects and significantly increases the risk for major birth defects (Mills, 1982; Buchanan and Kitzmiller, 1994; Greene, 1999). Congenital malformations of the heart (Loffredo et al., 2001) or the neural tube (Cleves and Hobbs, 2004) are up to 10-fold more frequent with preexisting type I (Kucera, 1971; Casson et al., 1997), type II (Chung and Myrianthopoulos, 1975; Brydon et al., 2000), or gestational diabetes (Kousseff, 1999), and these birth defects present a significant burden to public health. In similar fashion, offspring of obese women are at increased risk for neural tube defects (NTDs; Waller et al., 1994), heart defects (Cedergren and Kallen, 2003) and omphalocele (Watkins et al., 2003). In both metabolically abnormal conditions, molecular mediators of this adversity to the embryo are not well understood. Although various indirect mechanisms (Mills, 1982; Goldman et al., 1985; Freinkel, 1988; Carver et al., 1995; Reece and Eriksson, 1996; Kousseff, 1999; Reece, 1999; Sakamaki et al., 1999; Stephens et al., 2001; Wentzel et al., 2001; Zaken et al., 2001) have been proposed for teratogenesis in diabetic pregnancies, the cardinal cause remains hyperglycemia (Eriksson et al., 1991; Baker and Piddington, 1993; Corrigan et al., 2009). In the search for explanations for the teratogenic effects of glucose, a recent intriguing finding is that excess glucose can affect histone acetylation via the citrate lyase pathway (Wellen et al., 2009). This finding suggests the possibility that maternal diabetes affects the epigenome of the developing embryo.
In diabetic pregnancies, the regulation of gene expression in the embryo (Jiang et al., 2008; Pavlinkova et al., 2009) is significantly changed. We found deregulation of crucial developmental factors for heart morphogenesis and neural tube closure, implicating these genes in the etiology of maternal diabetes-elicited birth defects (Pavlinkova et al., 2008; 2009). We have also detected altered expression of many prominent chromatin-modifying factors, among them Ep300, Kat2a, Hdac5, Hdac6, and Hdac7, which may contribute to altered gene regulatory patterns.
Birth Defects, Variation, and Gene Expression
When considering the relationship of changes in gene expression to phenotypes such as NTDs, it is imperative to accounts for birth the fact that do not arise in every individual offspring of every diabetic mother. This fact is obvious in the rodent model, in which, despite shared exposure to the diabetic milieu of the dam, only a fraction of the litter is afflicted with the birth defect. Such a pattern matches the classic definition of phenotypes of incomplete penetrance, and explanations for these phenotypes have always invoked an element of biologic variation. Our recent studies suggested a molecular correlate for this variability; we found that maternal diabetes not only alters expression levels of specific genes (Pavlinkova et al., 2009), but also causes a general increase in the variation of gene expression levels (Salbaum and Kappen, 2010). We therefore hypothesize that the underlying mechanisms are of epigenetic nature, postulating that maternal diabetes acts on embryonic gene regulation through changes in the embryonic epigenome.
Maternal Nutrition and Metabolism: Mediators of Epigenetic Plasticity
Evidence for plasticity of the epigenetic landscape has accumulated from several lines of investigations: epigenomic change has been observed during cell differentiation (Bernstein et al., 2006; Mikkelsen et al., 2007), in response to diet (Waterland and Jirtle, 2003; Davison et al., 2009), and as a result of excess glucose (Wellen et al., 2009). During development, extrinsic factors such as maternal diet can alter epigenetic modifications (Aagaard-Tillery et al., 2008), and the effect of epigenetics on development is further highlighted by studies on intrinsic factors: many chromatin-modifying factors have proved to be essential for embryonic development. P300, a product of the Ep300 gene, is a transcriptional coactivator that mediates acetylation of lysine 27 at histone 3 (H3K27Ac), a mark associated with transcriptional enhancers (Creyghton et al., 2010). Ep300 expression is decreased in embryos from diabetic pregnancies (Salbaum and Kappen, 2010), and loss of Ep300 function leads to NTDs (Yao et al., 1998). Kat2a/GCN5 histone acetyltransferase (Suka et al., 2001; Imoberdorf et al., 2006) is deregulated by maternal diabetes (Salbaum and Kappen, 2010), and the respective targeted mutation causes NTDs (Lin et al., 2008; Wagschal et al., 2008). Furthermore, maternal diet effects may not be limited to histone acetylation processes, but include other epigenetic modalities such as histone methylation (Feldman et al., 2006; Lin et al., 2008; Wagschal et al., 2008), or DNA methylation (Davison et al., 2009). Although genomewide surveys of epigenetic marks have been performed with a focus on embryonic stem cells (Mikkelsen et al., 2007), it is currently not known whether and how the embryonic epigenome in its entirety is changed under adverse pregnancy conditions, such as maternal diabetes or obesity. Since dietary studies imply plasticity of the epigenome, it is important to identify targets that could be modified by dietary intervention as corrective or protective measure. In the experiments we report here, we sought to address this fundamental question by assessing histone acetylation patterns in mouse embryos at the stage of neurulation, prior to completion of neural tube closure. We provide evidence that maternal metabolic imbalance can have significant effects on chromatin modifications and can identify maternal diabetes-responsive histone modification marks in known NTD genes.
MATERIALS AND METHODS
Animal Models
All animal experiments were performed with prior approval of the Pennington Biomedical Research Center IACUC. Mice of the strain C57BL/6 were used for all experiments. Animals were housed with a 12-hour light and dark cycle, with access to food and water ad libitum. All male mice, as well as female mice designated for control or diabetic pregnancies, were fed Purina 5001 diet (protein, 28.5 kcal%; carbohydrate, 58 kcal%; fat, 13.5 kcal%); to induce obesity, females were fed a high-fat diet: Research Diets D12331 (protein, 16.4 kcal%; carbohydrate, 25.5 kcal%; fat, 58.0 kcal%; Research Diets, New Brunswick, NJ). Body composition was determined on a Bruker minispec body composition analyzer (Bruker Optics, Billerica, MA); body composition and blood glucose levels were monitored weekly. No nuclear magnetic resonance (NMR) assays were performed once the females were pregnant. Induction of diabetes with streptozotocin was performed as described previously (Pavlinkova et al., 2009) by injecting streptozotocin twice intraperitoneally within a week at a concentration of 100 mg/ kg body weight. Females were considered diabetic once blood glucose levels exceeded 250 mg/dl. After mating, noon of the day of appearance of a vaginal plug was designated day 0.5 of gestation. At 8.5 days of gestation, embryos were dissected from the uterus; visceral yolk sac and amnion were removed by dissection. Embryos were inspected for normal morphology, and somites were counted using a Leica MZ6 stereomicroscope. In separate experiments, two size groups were generated: one consisting of embryos with five to seven somites, and a second one of embryos with seven to nine somites. Embryos were pooled according to somite number, fixed in phosphatebuffered saline with 1% formaldehyde (Sigma Aldrich, St. Louis, MO) for 10 minutes, quenched in 0.25 M Glycine, and stored at −80°C for chromatin preparations.
Chromatin Immunoprecipitation
Chromatin was prepared from embryos using a reagent kit (ActiveMotif, Carlsbad, CA), following the instructions of the manufacturer. Embryos were transferred to lysis buffer, homogenized using a Dounce homogenizer with a tight-fitting pestle, and soluble non-chromatin material was removed after centrifugation. The pellet was resuspended in digestion buffer; chromatin was fractionated by limited nuclease digestion, which was terminated by addition of EDTA. Inspection of chromatin preparations by gel electrophoresis revealed major DNA bands at sizes corresponding to one, two, and three nucleosomes. For chromatin immunoprecipitations, polyclonal antibodies specific for acetylated lysine 5 of histone 4 (H4K5Ac; Millipore, Billerica, MA) or acetylated lysine 27 of histone 3 (H3K27Ac; Abcam, Cambridge, MA) were allowed to bind to magnetic beads coated with protein G (New England Biolabs, Ipswich, MA). Beads were washed and incubated with embryo chromatin preparations for 16 hours at 4°C in immunoprecipitation buffer with constant agitation. Beads were washed to remove unbound material, and chromatin was eluted from the beads. For chromatin obtained from immunoprecipitation as well as for input chromatin, formaldehyde-induced Schiff bases were reversed, protein and RNA were removed by digestion with proteinase K and RNaseA (ActiveMotif), and the resulting DNA was further purified by phenol extraction and concentrated by precipitation with Ethanol. After resuspension, DNA was quantified using a Qbit fluorometer (Life Technologies, Grand Island, NY) following instructions by the manufacturer.
Library Construction and Sequencing
For each preparation (7–9 somites, normal pregnancy, H4K5Ac; 7–9 somites, diabetic pregnancy, H4K5Ac; 7–9 somites, high-fat diet pregnancy, H4K5Ac; 5–7 somites, normal pregnancy, H3K27Ac; 5–7 somites, diabetic pregnancy, H3K27Ac), fragment libraries were generated from input chromatin and from chromatin obtained after immunoprecipitation. Fragment libraries were prepared for sequencing on an AB SOLiD sequencer (Applied Biosystems, Foster City, CA) using reagent kits according to instructions from the manufacturer. Library quality control was done on an Agilent 2100 bioanalyzer (Agilent Technologies, Santa Clara, CA). The H4K5AC experiment was performed on an AB SOLiD version 4, whereas the samples for the H3K27Ac experiment were processed on an AB SOLiD 5500XL.
Analysis of Sequencing Data
Data obtained from the sequencer runs were uploaded to GALAXY (http://galaxy.psu.edu/). Conversion of color space data in csfasta file format was done in GALAXY; BOWTIE served as the alignment tool. Libraries were filtered to remove PCR artifacts, and any reads that map to more than three genomic locations. First, filtered read libraries representing immunoprecipitation-derived chromatin and the corresponding input chromatin were compared using SICER (Zang et al., 2009) running on a local Linux workstation to take advantage of features not implemented in the GALAXY version of the program; the resulting “islands” indicating the presence of either an H3K27Ac or an H4K5Ac histone mark were recognized if they passed the SICER test statistics, with false discovery rate cutoff set at 0.01. Finally, islands of histone acetylation were compared across metabolic modalities using SICER. For this purpose, islands identified from the 5–7 somites, diabetic pregnancy-H3K27Ac SICER output were compared to islands obtained from the 5–7 somites, normal pregnancy-H3K27Ac SICER output. Relying on the test statistics in SICER and a false discovery rate upper limit of 0.01, such a comparison yielded three groups of features (we use the term features to distinguish these from islands that were called in the immunoprecipitation versus input chromatin comparison): (1) unchanged between diabetic and normal modality, (2) increased in the diabetic modality, and (3) decreased in the diabetic modality. Parallel comparisons were performed for the different metabolic conditions of embryos in the 7–9 somite group. The resulting lists of features were used in annotation studies.
Annotations
To correlate the genomic locations of histone features to the presence of genes, we obtained mouse RefSeq gene coordinates from MGI (http://www.informatics.jax.org/ ). This yielded 23,516 mouse genes designated with a current gene symbol; genes were sorted by chromosome and transcription start. For genes on the plus strand, the genomic start coordinate was designated as the transcription start; for genes on the minus strand, the genomic stop coordinate was designated as the transcription start. Histone features identified in the SICER comparative analysis were then sorted into the gene list, using the center of each histone feature as the genomic coordinate for sorting. We then queried for potential association between histone features and genes by asking whether there was a histone feature present in an initial envelope stretching from 350 kb upstream of the transcription start to 350 kb downstream of the transcription start. Similar queries were run for envelopes of 275, 200, 100, and 50 kb, each generating a set of categorical data: presence or absence of a histone feature for each gene. The association of specific groups of genes with the presence of histone features was tested by comparing the numbers of genes with or without a histone feature in the list of genes of interest to the numbers of genes with or without a histone feature in a randomly drawn, similarly sized group of genes. Randomly drawn groups of genes were curated to eliminate duplicates, which were replaced with other randomly drawn genes to bring the group to proper size; random draws were not curated for incidental presence of NTD genes. Such a comparison yielded a 2×2 contingency table, and statistical significance was evaluated with Fisher’s exact test. Overall statistical significance was determined by performing multiple random draws, and a p value was obtained by dividing the number of nonsignificant outcomes of the Fisher’s exact test by the number of random draws; a p value less than 0.05 was deemed to demonstrate statistical significance of association.
Statistical Evaluation
Categorical data were evaluated with Fisher’s exact test; two-sided p values are given. Serum glucose levels, weight, and body fat data were analyzed with one-way ANOVA.
RESULTS
The overall design of our experimental and computational approaches is shown in Figure 1. Females were fed either normal chow or high-fat diet; half of the chow-fed dams were made diabetic by injection of streptozotocin. Mated females were examined for appearance of a vaginal plug (noon of this day is designated as embryonic day [ED] 0.5), and embryos were isolated at gestational day ED 8.5.
Figure 1.

Experimental and computational analysis of histone modifications in embryos exposed to maternal diabetes and high-fat diet during pregnancy. Epigenomic analysis was performed on neurulation-stage embryos from normal (blue), diabetic (yellow), and high-fat–diet (pink) dams. Embryos were assigned to two main groups for the separate experiments: 5–7 somites or 7–9 somites. This resulted in five chromatin preparations: D57 (embryos from diabetic pregnancies, 5–7 somites); N57 (normal, 5–7 somites); D79 (diabetic, 7–9 somites); N79 (normal, 7–9 somites); and F79 (high-fat diet, 7–9 somites). D57 and N57 chromatin preparations were assayed for H3K27 acetylation, whereas D79, N79, and F79 were probed for H4K5 acetylation. A fraction of each chromatin preparation was used for immunoprecipitation with the respective specific antibody. DNA recovered from the immunoprecipitate (IP) was used to construct a sequencing library; as control, a sequencing library was prepared from non-immunoprecipitated chromatin. Sequence reads were processed using GALAXY, with BOWTIE as the tool for alignment and quality control; only uniquely mapped sequence reads were included in further analyses. Genomic regions enriched for histone acetylation, termed histone islands, were determined using SICER from a comparison of IP versus Non-IP sequencing data derived from each chromatin preparation. Again using SICER, the resulting histone islands were then compared between the different metabolic modalities to identify histone features that are sensitive to maternal metabolism: comparison of histone islands from D57 and N57 chromatin yielded a set of diabetes-responsive H3K27Ac features, and comparison of results from D79 and N79 revealed a set of diabetes-responsive H4K5Ac features, whereas comparison of data from F79 and N79 produced a set of H4K5Ac features responsive to high fat diet. All feature datasets were subjected to genomic location analyses to determine distances of features from genes, and H4K5Ac features were compared to determine commonalities and differences in the responses to maternal diabetes or high-fat diet. Diabetes-responsive features were queried for association with neural tube defect genes.
Pregnancies Under Different Metabolic Conditions
Maternal weight at the time of dissection (Fig. 2A) was different among experimental groups: normal females on average weighed 23.06 gm (±2.045 SD), diabetic females weighed 18.3 gm (± 2.084 SD), and females fed a high-fat-diet weighed an average of 30.62 gm (± 6.785 SD); the differences between all groups were statistically significant. The increased weight in high-fat–diet females was largely accounted for by increased body fat, which was evident by 3 weeks after starting on the high-fat diet, and more pronounced by 6 weeks (Figs. 2B, 2C). As expected, blood glucose levels were elevated in diabetic females (Fig. 2D), which exhibited a mean glucose level of 372.86 mg/dl (± 82.84 SD), whereas normal and high-fat–diet females had normal blood glucose levels at the time of sacrifice (131 ± 14.7 and 131.55 ± 19.5, respectively). Both diabetes and the high-fat diet reduced pregnancy success (Fig. 2E): in 54 matings of normal mice, 26 females were pregnant (48.1%), and 28 were not. After mating 57 diabetic females, we obtained only 10 pregnancies (17.6%; p = 0.001 compared to normal), and 81 matings of high-fat–diet females yielded 23 successful pregnancies (28.4%; p 5 0.001 compared to normal; not significantly different when compared to diabetic females). Rates of resorptions were 12 of 205 (normal, 5.9%), 10 of 84 (diabetic, 11.9%) and 15 of 160 (high-fat diet, 9.4%); differences were not statistically significant. Similarly, although litter size was reduced in high-fat–diet females (Fig. 2F), the differences in litter size were not statistically significant. In summary, our data show that maternal metabolism affects reproductive success in this paradigm, with reduction in pregnancy rates by maternal diabetes or high-fat diet consumption.
Figure 2.

Parameters of normal, diabetic, and high-fat–diet pregnancies. Bar diagrams depict arithmetic means ± SD; group size is indicated by numbers in the bottom of each bar, and metabolic status for the pregnancy was either normal (blue), diabetic (orange), or high-fat diet (pink). (A) Maternal weight included embryo weight. (B, C) Body fat was determined by NMR as the fraction of total weight of the animal. (D) Blood glucose measurements. One diabetic female exhibited a glucose reading at the upper limit of sensitivity of the meter, at 600 mg/dl. Removing this individual from the group did not change the average by more than 1%. Significant differences between means are mentioned in the text. (E) Pregnancy success was calculated as the fraction of pregnant dams of all females placed into mating cages. (F) All females were sacrificed at embryonic day 8.5, when embryos were dissected out from successful pregnancies. (G) Embryo counts were converted into fractions by dividing by the number of embryos with the same number of somite pairs by the total number of embryos recovered. Blue indicates normal pregnancies; orange indicates diabetic pregnancies; pink indicates high-fat– diet pregnancies. (H) Each data point represents one embryo from the latter group; the groups plotted at the top of the panel represent embryos with 15 and more somite pairs.
Embryos were isolated from all pregnancies at ED 8.5, and their developmental age was determined by counting the number of pairs of somites present in each embryo. In normal pregnancies, the mean number of somites pairs was 8, although some variation was evident (Fig. 2G), even within a given pregnancy. In diabetic pregnancies, a greater fraction of embryos was developmentally delayed, having lower somite numbers than normal. Well-advanced embryos were only present in dams with moderate hyperglycemia, but we were unable to detect a strict correlation with maternal glucose level, probably because of the low number of successful pregnancies (n = 10). Nonetheless, 75% of the embryos (45 of 60) from diabetic pregnancies had fewer than eight somite pairs, whereas only 40.9% (70 of 171) had fewer than eight somite pairs in normal pregnancies (p < 0.01). In contrast, feeding of a high-fat diet was associated with a greater fraction of embryos (61.3%; 70 of 111) with 10 or more somite pairs, when in normal pregnancies, these stages account only for 24% of embryos (41 of 171; p < 0.01). Delayed embryos were also found with a higher frequency than in normal pregnancies. Interestingly, the extent of developmental progression appeared to be inversely correlated to maternal adiposity (Fig. 2H). In highly obese dams (>30% body fat), only delayed embryos were found, whereas advanced development was generally associated with lower maternal adiposity (p < 0.01 in regression analysis). This finding suggests that intrauterine conditions could vary by degree of adiposity. Our results indicate that, in addition to reduced pregnancy success, if diabetic females become pregnant, development will generally be delayed by the metabolic condition; however, if a female receiving a high-fat diet becomes pregnant, the diet promotes developmental advancement as long as adiposity is moderate. Furthermore, it is noteworthy that the overall variability was increased in both diabetic and obese conditions.
Detection of Histone Modifications in Embryos from Metabolically Distressed Pregnancies
To determine whether maternal metabolic conditions affect the status of histone modifications in the developing embryo, we conducted chromatin immunoprecipitation experiments with antibodies specific for acetylated histone 3 lysine 27 (H3K27Ac), followed by sequencing the DNA enriched by immunoprecipitation to obtain a genome-wide survey (Fig. 1). Chromatin from embryos with 5–7 somites derived from diabetic and normoglycemic dams was analyzed with an antibody against H3K27Ac. We were able to generate filtered sequence read libraries that averaged 29.7 million reads; those libraries lead to the identification of 11,559 islands that carry the H3K27 acetylation mark (Fig. 3). Of these islands, 2080 were features where the H3K27 acetylation mark was increased in chromatin from diabetic pregnancies, with an average fold change of 2.04; in contrast, 3695 of these were features where maternal diabetes was associated with a loss of the H3K27 acetylation mark, with an average fold change of 1.82. These results indicate that maternal diabetes affects histone 3 acetylation at lysine 27 in neurulation stage embryos.
Figure 3.

Diabetes-responsive H3K27Ac features in neurulation-stage embryos. SICER analysis revealed a total of 11,559 islands with enrichment in H3K27 acetylation in either D57 or N57 chromatin. Using a statistical cutoff at a false discovery rate (FDR) of 0.01 or less, 2080 of these islands showed an increase in chromatin from embryos of diabetic pregnancies (with an average fold change of 2.04), whereas 3695 such islands suffered a decrease in acetylation from diabetic embryos compared to normal (average fold change or 1.82). Islands that respond to maternal diabetes are termed features if they pass the statistical threshold. Data are visualized in form of a volcano plot, depicting the negative log10 of the false discovery rate associated with a given feature (y-axis) plotted against the log2 of the observed fold change in either direction (x-axis). Islands that either do not pass the statistical threshold, and features with less than a 1.5-fold change in either direction (up or down) are shown as gray circles, whereas features that pass the statistical threshold and show a fold change >1.5 in either direction are shown as black circles.
Separately, we conducted chromatin immunoprecipitation experiments with antibody specific for histone 4 lysine 5 acetylation (H4K5Ac) on chromatin obtained from embryos with 7–9 somites; library sizes for this experiment averaged 8.0 million filtered reads. The results for embryos from diabetic pregnancies (Fig. 4) again support the notion that maternal metabolic distress, as brought about by hyperglycemia, changes patterns of histone acetylation across the genome. In addition, we analyzed H4K5 acetylation in embryos (with 7–9 somites) that were isolated from dams fed a high-fat diet. Figure 4 shows that this diet was associated with changes in the distribution of acetylation marks, indicating that the maternal diet affects histone modification patterns in exposed embryos. A comparison of the diabetes- and high fat diet-responsive features is shown in Figure 4B. For features that decrease in response to diabetes or high-fat diet, there is a significant overlap between the two conditions. However, for features that increase in response to maternal metabolic imbalance, only a small fraction of H4K5Ac features responded to both conditions; the majority of the detected features are unique for each metabolic modality. This indicates that, overall, the histone acetylation responses to the two forms of metabolic distress may be distinct. To understand whether these changes could be responsible for increased risk for NTDs, such as in diabetic pregnancies, we asked whether any of these marks showed association to known NTD genes.
Figure 4.

Responses of H4K5Ac patterns to different metabolic conditions in diabetic and high-fat–diet pregnancies. We detected a total of 3396 H4K5Ac islands in the comparison of chromatin from diabetic and normal embryos at 7–9 somites. Using SICER, we found that 1139 island had increased acetylation in the diabetic condition (average fold change of 2.43), whereas 764 had decreased acetylation (average fold change of 2.07). Similarly, in a comparison of data from embryos exposed to maternal high-fat diet versus normal, we detected 5001 islands; of these, 2699 were increased in the high-fat diet condition (average fold change of 2.41), whereas 640 were decreased (average fold change of 2.14). A comparison of the features that were increased in either the diabetic (orange) or the high-fat (pink) modality revealed little overlap: 67 features with increased acetylation (green) were common between the two modalities, whereas 1072 were unique to the diabetic condition, and 2632 were exclusive to the high-fat diet condition. We observed a higher overlap between features that were decreased in either metabolic modality compared to the normal pregnancy: 414 of such features (red) were common between diabetic (orange) and high-fat (pink) modalities, with 350 features unique to the diabetic condition, and 256 such features exclusive to the high-fat diet condition.
Neural Tube Defect Genes and Diabetes-Responsive Histone Modifications
We defined NTD genes (Supplemental Table 1) (Salbaum and Kappen, 2010) as those where a loss of gene function either results directly in a NTD phenotype or leads to an aggravation of an NTD phenotype brought about by loss of function at another gene locus (Harris and Juriloff, 2010; Salbaum and Kappen, 2010). We first determined whether a relationship existed between NTD genes and H3K27Ac histone marks that respond to conditions of maternal diabetes. H3K27Ac is considered a mark associated with activation of transcription and is thought to occur at transcriptional enhancer sites (Creyghton et al., 2010).
We performed a local neighborhood analysis for each gene, initially allowing for a maximum distance of an H3K27Ac feature of 350 kb from the transcription start of a gene in either direction. The criteria reflect that transcriptional enhancers, particularly those that direct embryonic development, can be located at considerable distances from the gene they regulate (Bien-Willner et al., 2007). An example is shown in Figure 5 for the Ep300 gene, in which one of the islands with reduced H3K27 acetylation in diabetes-exposed embryos overlaps the region where a known P300 binding site is located (Visel et al., 2009). We then determined the overall number of histone features located in such a distance envelope around each gene, as well as the number of genes that had at least one H3K27Ac feature present. Figure 6 shows that the majority of maternal diabetes-responsive histone features are located between 50 and 200 kb from the transcription start in either direction. We did not detect significant differences between the distribution of features that increase in response to maternal diabetes or those that decrease. We also did not detect differences in the distribution of histone features for all genes from the distribution for NTD genes.
Figure 5.
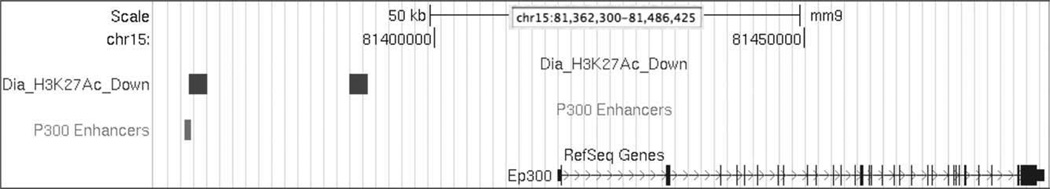
Location of diabetes-responsive H3K27Ac features in the vicinity of the Ep300 gene. We detected two features of H3K27 acetylation upstream of the Ep300 gene; both decrease in response to maternal diabetes (Dia_H3K27Ac_Down). These locations of features were visualized using the UCSC Genome Browser, using mouse genome version mm9 and five browser tracks: scale, chromosome, Dia_H3K27Ac_Down, p300 Enhancers, and RefSeq Genes. The scale track also contains the chromosomal location of the depicted window. The track “P300 Enhancers” was generated from published data derived from ChIPSeq analyses with an antibody against p300. The distal feature overlaps with a known site for P300 binding.
Figure 6.

Location of diabetes-responsive H3K27Ac features relative to transcription start sites. Distances of H3K27Ac features to transcription start sites were determined for all such features that were located in a distance envelope ranging from 350 kb upstream to 350 kb downstream of the transcription start site of each gene. Distance bins were 350,000 to 275,001 bp, 275,000 to 200,001 bp, 200,000 to 100,001 bp, 100,000 to 50,001 bp, 50,000 to 10,001 bp, and 10,000 to 1 bp in each direction. The number of histone features found either upstream or downstream were each set to 100%, and features in the respective distance bins upstream or downstream were expressed as percentage. All_Dia_Up: H3K27Ac features that are increased in diabetic conditions derived from all genes; All_Dia_Down: histone features that are decreased in diabetic conditions derived from all genes; NTD_Dia_Up: H3K27Ac features that are increased in diabetic conditions derived from neural tube defect genes; NTD_Dia_Down: histone features that are decreased in diabetic conditions derived from neural tube defect genes.
When we evaluated H3K27Ac features that show increase in the diabetic condition (Table 1), we found that a higher fraction of NTD genes exhibited the presence of such a feature when compared to all RefSeq genes. This was also the case when we reduced the maximum permitted distance to 275, 200b, 100, and finally 50 kb in either direction from the transcription start. A similar relationship was found for H3K27Ac features that were decreased in response to maternal diabetes: the group of NTD genes contained a higher fraction of such genes compared to all genes; the relationship was found for all five distance criteria that we tested. To determine whether any differences would be statistically significant, we compared the numbers of NTD genes with or without a histone feature in a specific distance envelope to the numbers of genes with or without a histone feature derived from subgroups of all genes. Because we evaluated 370 NTD genes in this study, the comparisons to all genes were done on randomly drawn subgroups of the same size, to avoid unbalanced sample numbers in the Fisher’s exact test. We performed 100 random draws to generate such subgroups, tallied the number of statistically nonsignificant outcomes (i.e., no significant difference between NTD genes and a randomly drawn group from all genes) from the 100 tests, and designated as p value the number of nonsignificant outcomes divided by the number of random draws. This analysis was performed separately for all five distance envelopes, and the results of this approach are summarized in Figure 7.
Table 1.
Presence of H3K27Ac Features Near NTD Genes in Diabetic Pregnancies
| Distance (bp) |
|||||
|---|---|---|---|---|---|
| 50,000 | 100,000 | 200,000 | 275,000 | 300,000 | |
| H3K27Ac_Dia_Up | |||||
| All genes (%) | 5.6 | 10.0 | 15.8 | 18.2 | 19.9 |
| NTD genes (%) | 7.8 | 15.9 | 22.7 | 25.4 | 28.4 |
| H3K27Ac_Dia_Down | |||||
| All genes (%) | 14.1 | 22.9 | 30.6 | 33.0 | 34.3 |
| NTD genes (%) | 23.5 | 35.1 | 47.3 | 51.4 | 53.5 |
The distances of H3K27Ac features from the transcription start site of a neighboring gene were classified into bins of 0 to 50000 bp, 0 to 100,000 bp, 0 to 200,000 bp, 0 to 275,000 bp, and 0 to 350,000 bp. For each bin, the fraction of the 370 NTD-genes with a H3K27Ac feature close by was calculated; with greater distance, a greater fraction of NTD genes exhibits presence of an H3K27 acetylation feature. For control, we determined the presence of H3K27Ac features in 100 random draws of groups of 370 genes from all RefSeq genes.
NTD, neural tube defect.
Figure 7.

Relationship of H3K27 acetylation features and NTD genes. (A) H3K27Ac features increased by diabetes. Numbers of genes in the neural tube defect group that are associated with a diabetes-increased H3K27Ac features are plotted (NTD_genes). These were compared to the average number of genes with such a histone feature obtained from 100 randomly drawn groups of genes (Rand_mean), with group size of each random draw identical to the group size of neural tube defect genes. In addition, the maximum (Rand_max) and minimum (Rand_min) observations from the random draws are shown (dotted lines). Statistical tests were performed for the different distance envelopes indicated; none of these test reached statistical significance. (B) H3K27Ac features decreased by diabetes. In contrast, neural tube defect genes are statistically significantly associated with the presence of H3K27Ac features that decrease under conditions of maternal diabetes; tests reached statistical significance for all distance envelopes.
Figure 7A displays the results for the association of genes to H3K27Ac features that are increased under conditions of maternal diabetes. For each distance, the number of NTD genes with a histone feature is compared to the average number of genes with a feature in the random groups. In addition, maximum and minimum numbers observed in the 100 random draw groups are also shown (dotted lines). The values for NTD genes with features increased under diabetic conditions closely parallel the line for the maximum observations from random draws. The p values for these comparisons ranged from 0.19 for the 350 kb distance to 0.86 for the 50kb distance, indicating absence of statistically significant differences. In contrast, the results from the analysis of H3K27Ac features that are decreased under conditions of maternal diabetes (Fig. 7B) demonstrated that the number of NTD genes with such a histone feature was higher than in random draws, and well exceeded the maximum observations. Our statistical test indicated significance for all the distance envelopes analyzed: p values for the 350, 275, and 200 kb distances were less than 0.01; p value for the 100 kb distance was 0.01; and the p value for the 50 kb distance was 0.03. These analyses showed that NTD genes have the same incidence of diabetes-increased H3K27Ac features, but they exhibit a significantly higher association with diabetes-decreased H3K27Ac features compared with all genes in the genome.
We also queried whether diabetes- or fat-responsive H4K5Ac features would be associated with NTD genes in a comparison of chromatin from embryos of normal, diabetic, and high fat diet pregnancies. H4K5 acetylation is typically enriched at promoters in differentiated cells (Rosenfeld et al., 2009); however, it is also a mark of active chromatin assembly. In our experiments, H4K5Ac features were typically not located in the vicinity of promoters or gene starts, but could be found in distant locations (data not shown). While the results in Figure 4 indicate that both metabolic conditions affect histone acetylation patterns in the embryo, and that this effect is distinct between diabetes and high-fat–diet pregnancies, we found no statistically significant association of H4K5Ac features of any kind (up or down in diabetic compared to normal; up or down in high fat compared to normal; up or down in diabetic compared to high fat) with the group of NTD genes.
DISCUSSION
These experiments provide insights into the relationship between maternal metabolic conditions and the epigenome of the developing rodent embryo. Based on the reported effects of excess glucose on histone acetylation (Wellen et al., 2009), we limited our focus on this particular modality of the epigenome. Within the spectrum of histone modifications, we chose H4K5Ac as a mark correlated with active promoters (Rosenfeld et al., 2009) and H3K27Ac as a mark found to be associated with tran-scriptional enhancers (Creyghton et al., 2010; Szerlong et al., 2010). Our results show that in chromatin of neurulation-stage embryos, genomic patterns of histone acetylation marks are affected by the metabolic status of the mother, supporting the hypothesis that the embryonic epigenome is the target of adverse maternal metabolic conditions.
Based on the published evidence that excess glucose caused higher levels of histone acetylation in cultured cells, one initial expectation was that we would detect embryonic histone acetylation features that increase under conditions of maternal diabetes; however, this was not the case in our experiments. Although we detected histone features that increased in embryos exposed to diabetes as expected, we also detected a many features that decreased in response to maternal diabetes. In the H4K5Ac experiments, the features with increases out-numbered the features with decreases; in the case of H3K27Ac, the ratio was reversed, with a greater fraction of features decreased in response to maternal diabetes. This observation supports a model in which maternal metabolic imbalance, rather than affecting overall levels of histone acetylation, leads to an imbalance in embryonic histone acetylation patterns. A possible explanation for this observation lies in the network properties of the epigenome (Salbaum and Kappen, 2011): as histone acetylation changes in response to the perturbed maternal metabolism, gene expression levels are altered, including expression levels of genes that encode epigenetic factors. Consistent with this notion are results from our expression studies on embryos from diabetic pregnancies at a slightly later stage of embryonic development: we find genes deregulated whose products contribute to the shape of the epigenome. Genes affected by such expression changes include both “writers” of epigenetic marks, such as histone acetyltransferases and histone methyltransferases, and “erasers” of epigenetic marks, such as histone deacetylases and histone demethylases (Salbaum and Kappen, 2010). Based on these considerations, it appears more likely that metabolic interference with the embryonic epigenome would result in imbalances and altered patterns of epigenetic marks, rather than in a wholesale change in one direction. Furthermore, compared to acute in vitro challenge of cultured cells with excess glucose, the in vivo situation for neurulation stage embryos is more comparable to a chronic challenge. The initial consequence might well be a general increase in histone acetylation levels, but over time, the network properties would be expected to translate an initial insult into imbalance of histone acetylation patterns, as we observed here. As proper regulation of gene expression (i.e., the outcome of epigenomic action) at neurulation is a key determinant for correct morphogenesis, the imbalances in histone acetylation patterns could be causal for NTDs. Taken together, our experiments provide evidence that the embryonic epigenome is a target for metabolic interference in embryonic development.
Interestingly, maternal consumption of the high-fat diet was associated with a greater number of features that increased in response to the diet than features that decreased in exposed embryos. This was the case when the comparison was to the normal condition, but also held when compared with diabetic pregnancies. It is known that high-fat diet affects histone acetylation (Aagaard-Tillery et al., 2008; Honma et al., 2009) in other paradigms, and our findings are consistent with this notion. However, it is important to note that dams consuming the high-fat diet were normoglycemic, suggesting that the effect of the diet is not mediated through glucose, but through other signals. Furthermore, when comparing the locations of H4K5Ac features that increase in response to maternal metabolic imbalance, there is little overlap between the features responsive to high-fat diet and those responsive to maternal diabetes. In part, this small degree of overlap could be explained by the fact that our library sizes in the H4K5Ac experiment were smaller and might not reach genome saturation. In addition, the use of whole embryos as the source for chromatin is expected to average results over all cell types present, which would be expected to affect detectability and apparent magnitude of changes in the histone features. We recognize that it would be preferable to conduct epigenomic studies in purified cell populations (Salbaum and Kappen, 2011); the results presented here provide strong justification that this is warranted, as epigenomic changes are already detectable in the mixed-cell preparations from whole embryos. Comparing locations of H4K5Ac features that decrease in response to maternal metabolic perturbations, we find that 54% of those features that decrease with diabetes also decrease in response to the high-fat diet exposure. This considerable overlap indicates that, in fact, our libraries were large enough to detect common features (if present) in the different modalities, and thus demonstrates the feasibility of such epigenomic studies.
From a biological perspective, commonalities between diabetes and high-fat responses at the level of H4K5Ac were largely restricted to decreasing features, whereas the increasing features, which comprise the majority of the overall responses, display little concordance. This leads us to conclude that embryonic epigenomic responses to maternal diabetes and to high-fat diet exposure involve distinct repertoires of histone acetylation marks. The morphologic variations in embryo development under both these conditions bear this out as well: embryos from diabetic pregnancies on average incurred a slight developmental delay, whereas embryos with exposure to a high-fat diet display a wider variation of developmental stages—both delayed and advanced—than either the normal control or the diabetic pregnancies. The exact nature and biological function of these H4K5Ac features remains to be elucidated in future experiments. Thus, the outcomes both at the level of phenotypic parameters as well as at the level of H4K5 acetylation underscore the importance of analyzing models for NTDs induced by maternal diabetes or maternal obesity separately, despite their apparent convergence in human birth defect phenotypes.
NTDs are prominent birth defects in pregnancies affected by diabetes and obesity; therefore, we queried whether there is a special relationship of embryonic histone features that respond to maternal metabolism to known NTD genes. The majority of NTD genes in mice are characterized by the fact that a loss of function, either as a consequence of a naturally occurring mutation or of a gene knockout or other targeted mutation, leads to a developmental phenotype that includes, but is not limited to, neurulation defects. In addition, a small fraction of NTD genes may act as modifiers of a NTD phenotype that is brought about by loss of function at another gene locus: loss of function of the modifier gene can aggravate the neurulation defect. In the vast majority of cases, the morphogenetic defect is correlated with a loss of function of such genes. Loss of function would also result from abnormal regulation of gene expression: failure to express an NTD gene at the correct levels, or at the appropriate place and time in development, can lead to adverse consequences for neurulation and may constitute a susceptibility for birth defects.
Gene regulation in embryonic development is dependent on transcriptional enhancers, which are gene control elements that typically are not directly located at transcription start sites. H3K27 acetylation is a histone mark that is co-localized with such transcriptional enhancers (Creyghton et al., 2010). In fact, p300, an enzyme generating the H3K27Ac mark, is regarded as a transcriptional activator (Szerlong et al., 2010); the corresponding gene Ep300 is an NTD gene (Yao et al., 1998). Furthermore, we find that the Ep300 gene itself is responsive to maternal diabetes, showing decreased expression in embryos at ED 10.5 from dams of the FVB inbred mouse strain with chemically induced diabetes (−1.38-fold; p = 0.006; Parlikova et al., 2009) and in ED 8.5 embryos of nonobese diabetic dams with spontaneously occurring diabetes (−.49-fold; p = 0.00013; Salbaum and Kappen, unpublished data) compared with embryos from normoglycemic dams. Intriguingly, we found reduced H3K27 acetylation features upstream of the Ep300 gene, one of which overlaps with a known site for P300 binding in the embryo (Visel et al., 2009). This finding raises two possibilities. First, Ep300 could be subject to autoregulation. Second, this autoregulation may be responsive to maternal diabetes, which could result in feed-forward reduction or a lack of H3K27 acetylation in the embryo or, considering the network properties of the epigenome, to an imbalance of H3K27 acetylation patterns. Consequently, through reduced transcriptional enhancer activity, such an imbalance would be expected lead to decreased gene expression at specific loci, and decrease or loss of gene expression may be the cause for an increased risk of the afflicted embryo to incur an NTD. We therefore investigated whether known NTD genes were associated with maternal diabetes-responsive sites of H3K27 acetylation.
Altered patterns of embryonic H3K27 acetylation included features that increased, as well as features that decreased, in response to maternal diabetes. The balance was tilted in favor of decreased features, which would be concordant with the change of expression we previously found for Ep300, the writer of this histone mark. More than 4400 genes showed association with diabetes-increased H3K27Ac features, and approximately 8800 genes had a diabetes-decreased H3K27Ac feature in their vicinity. When we annotated these gene lists for biological function using DAVID (Huang da et al., 2009a, 2009b), the GO-term transcriptional regulation was detected as a topscoring term in both gene lists. This finding suggests that maternal diabetes may, through altered H3K27 acetylation, affect transcriptional regulatory networks on a broad scale, in a manner reminiscent of the epigenomic network properties (Salbaum and Kappen, 2011) discussed previously. It is also noteworthy that genes of the Wnt signaling pathway show association (as determined by DAVID analysis) with diabetes-decreased H3K27Ac features. Consistent with our earlier findings that expression of genes of the Wnt signaling pathway is altered in the embryo as a consequence of maternal diabetes (Pavlinkova et al., 2008, 2009), these results advance the working hypothesis that loss of H3K27 acetylation at enhancers may contribute to decreased expression of Wnt pathway genes in embryos of diabetic pregnancies.
Considering the many genes with a diabetes-responsive H3K27Ac feature in their vicinity, it is compelling that the group of known NTD genes exhibited such a strong association with the presence of diabetes-decreased H3K27Ac features. This was the only association that passed statistical tests; neither diabetes-increased H3K27Ac features nor any of the H4K5Ac features exhibited a statistically significant association. This association between known NTD genes and diabetes-decreased H3K27Ac features suggests a biological concordance. Loss of H3K27Ac is linked to a lack of transcriptional activation; loss of NTD gene expression is linked to the birth defect phenotype. It is plausible that these diabetes-decreased H3K27Ac features could represent enhancers or regulatory elements for at least some of the NTD genes, but this will require future experimental verification. If indeed the loss of H3K27 acetylation at these features in response to maternal diabetes is correlated to altered NTD gene expression, it represents an attractive molecular mechanism for NTD susceptibility. Conceivably then, H3K27 acetylation could be suitable as a target for intervention, perhaps through histone deacetylase inhibitors. However, in light of the concept of epigenomic networks, the targeting of a single modality, or even a single modification, could have wide-ranging consequences for embryonic development.
In summary, our results show that maternal metabolic distress leads to significant alterations in the epigenome of the developing embryo, with H3K27 acetylation specifically as a potential mechanistic link between the metabolic imbalance and the NTD phenotype. Given that we have established feasibility with chromatin from whole embryos, it will be necessary to perform similar studies for specific cell types, to resolve the epigenomic basis of metabolically altered cellular behaviors that are pathogenic in developing embryos and cause NTDs.
Supplementary Material
ACKNOWLEDGMENTS
We thank Jacalyn McGowan for technical support with animal husbandry, body composition and glucose measurements, dissections, and the feeding paradigms; Xiaoying Zhang for assistance with the chromatin preparations; and Richard Carmouche, Susan Newman, and Diana Holmes for expert technical assistance.
Supported by a Pilot and Feasibility grant (to J.M.S.) from the PBRC Nutrition and Obesity Research Center (NORC NIH-P30DK072476), which also contributed to the Genomics Core, together with the PBRC Center of Biomedical Research Excellence (COBRE NIH-P20GM103528). J.M.S. is also funded through RO1-HD055528. C.K. received support from RO1-HD37804.
Footnotes
DNA sequencing and data analysis was performed by the Pennington Biomedical Research Center Genomics Core Facility.
REFERENCES
- Aagaard-Tillery KM, Grove K, Bishop J, et al. Developmental origins of disease and determinants of chromatin structure: maternal diet modifies the primate fetal epigenome. J Mol Endocrinol. 2008;41:91–102. doi: 10.1677/JME-08-0025. [DOI] [PMC free article] [PubMed] [Google Scholar]
- Baker L, Piddington R. Diabetic embryopathy: a selective review of recent trends. J Diabetes Complications. 1993;7:204–212. doi: 10.1016/1056-8727(93)90046-2. [DOI] [PubMed] [Google Scholar]
- Bernstein BE, Mikkelsen TS, Xie X, et al. A bivalent chromatin structure marks key developmental genes in embryonic stem cells. Cell. 2006;125:315–326. doi: 10.1016/j.cell.2006.02.041. [DOI] [PubMed] [Google Scholar]
- Bien-Willner GA, Staukiewicz P, Lupski JR. Soxgcre1, a cis-acting regulatory element located 1.1 Mb upstream of SOXS, mediates its enhancement through the SHH pathway. Hum Mol Genet. 2007;16:1143–1156. doi: 10.1093/hmg/ddm061. [DOI] [PubMed] [Google Scholar]
- Brydon P, Smith T, Proffitt M, et al. Pregnancy outcome in women with type 2 diabetes mellitus needs to be addressed. Int J Clin Pract. 2000;54:418–419. [PubMed] [Google Scholar]
- Buchanan TA, Kitzmiller JL. Metabolic interactions of diabetes and pregnancy. Annu Rev Med. 1994;45:245–260. doi: 10.1146/annurev.med.45.1.245. [DOI] [PubMed] [Google Scholar]
- Carver TD, Anderson SM, Aldoretta PA, Esler AL, Hay WW., Jr Glucose suppression of insulin secretion in chronically hyperglycemic fetal sheep. Pediatr Res. 1995;38:754–762. doi: 10.1203/00006450-199511000-00020. [DOI] [PubMed] [Google Scholar]
- Casson IF, Clarke CA, Howard CV, et al. Outcomes of pregnancy in insulin dependent diabetic women: results of a five year population cohort study. BMJ. 1997;315:275–278. doi: 10.1136/bmj.315.7103.275. [DOI] [PMC free article] [PubMed] [Google Scholar]
- Cedergren MI, Kallen BA. Maternal obesity and infant heart defects. Obes Res. 2003;11:1065–1071. doi: 10.1038/oby.2003.146. [DOI] [PubMed] [Google Scholar]
- Chung CS, Myrianthopoulos NC. Factors affecting risks of congenital malformations. II. Effect of maternal diabetes on congential malformations. Birth Defects Orig Artic Ser. 1975;11:23–37. [PubMed] [Google Scholar]
- Cleves MA, Hobbs CA. Collaborative strategies for unraveling the complexity of birth defects. J Matern Fetal Neonatal Med. 2004;15:35–38. doi: 10.1080/14767050310001650699. [DOI] [PubMed] [Google Scholar]
- Corrigan N, Brazil DP, McAuliffe F, et al. Fetal cardiac effects of maternal hyperglycemia during pregnancy. Birth Defects Res A Clin Mol Teratol. 2009;85:523–530. doi: 10.1002/bdra.20567. [DOI] [PubMed] [Google Scholar]
- Creyghton MP, Cheng AW, Welstead GG, et al. Histone H3K27ac separates active from poised enhancers and predicts developmental state. Proc Natl Acad Sci USA. 2010;107:21931–21936. doi: 10.1073/pnas.1016071107. [DOI] [PMC free article] [PubMed] [Google Scholar]
- Davison JM, Mellott TJ, Kovacheva VP, et al. Gestational choline supply regulates methylation of histone H3, expression of histone methyltransferases G9a (Kmt1c) and Suv39h1 (Kmt1a), and DNA methylation of their genes in rat fetal liver and brain. J Biol Chem. 2009;284:1982–1989. doi: 10.1074/jbc.M807651200. [DOI] [PMC free article] [PubMed] [Google Scholar]
- Eriksson UJ, Borg LA, Forsberg H, Styrud J. Diabetic embryopathy. Studies with animal and in vitro models. Diabetes v40. 1991;(Suppl 2):94–98. doi: 10.2337/diab.40.2.s94. [DOI] [PubMed] [Google Scholar]
- Feldman N, Gerson A, Fang J, et al. G9a-mediated irreversible epigenetic inactivation of Oct-3/4 during early embryogenesis. Nat Cell Biol. 2006;8:188–194. doi: 10.1038/ncb1353. [DOI] [PubMed] [Google Scholar]
- Freinkel N. Diabetic embryopathy and fuel-mediated organ teratogenesis: lessons from animal models. Horm Metabol Res. 1988;20:463–475. doi: 10.1055/s-2007-1010861. [DOI] [PubMed] [Google Scholar]
- Goldman AS, Baker L, Piddington R, et al. Hyperglycemia-induced teratogenesis is mediated by a functional deficiency of arachidonic acid. Proc Natl Acad Sci USA. 1985;82:8227–8231. doi: 10.1073/pnas.82.23.8227. [DOI] [PMC free article] [PubMed] [Google Scholar]
- Greene MF. Spontaneous abortions and major malformations in women with diabetes mellitus. Semin Reprod Endocrinol. 1999;17:127–136. doi: 10.1055/s-2007-1016220. [DOI] [PubMed] [Google Scholar]
- Harris MJ, Juriloff DM. An update to the list of mouse mutants with neural tube closure defects and advances toward a complete genetic perspective of neural tube closure. Birth Defects Res A Clin Mol Teratol. 2010;88:653–669. doi: 10.1002/bdra.20676. [DOI] [PubMed] [Google Scholar]
- Honma K, Mochizuki K, Goda T, et al. Inductions of histone H3 acetylation at lysine 9 on SGLT1 gene and its expression by feeding mice a high carbohydrate/fat ratio diet. Nutrition. 2009;25:40–44. doi: 10.1016/j.nut.2008.07.006. [DOI] [PubMed] [Google Scholar]
- Huang da W, Sherman BT, Lempicki RA. Bioinformatics enrichment tools: paths toward the comprehensive functional analysis of large gene lists. Nucleic Acids Res. 2009a;37:1–13. doi: 10.1093/nar/gkn923. [DOI] [PMC free article] [PubMed] [Google Scholar]
- Huang da W, Sherman BT, Lempicki RA. Systematic and integrative analysis of large gene lists using DAVID bioinformatics resources. Nat Protoc. 2009b;4:44–57. doi: 10.1038/nprot.2008.211. [DOI] [PubMed] [Google Scholar]
- Imoberdorf RM, Topalidou I, Strubin M, et al. A role for gcn5-mediated global histone acetylation in transcriptional regulation. Mol Cell Biol. 2006;26:1610–1616. doi: 10.1128/MCB.26.5.1610-1616.2006. [DOI] [PMC free article] [PubMed] [Google Scholar]
- Jiang B, Kumar SD, Loh WT, et al. Global gene expression analysis of cranial neural tubes in embryos of diabetic mice. J Neurosci Res. 2008;86:3481–3493. doi: 10.1002/jnr.21800. [DOI] [PubMed] [Google Scholar]
- Kousseff BG. Gestational diabetes mellitus (class A): a human teratogen? Am J Med Genet. 1999;83:402–408. [PubMed] [Google Scholar]
- Kucera J. Rate and type of congenital anomalies among offspring of diabetic women. J Reprod Med. 1971;7:73–82. [PubMed] [Google Scholar]
- Lin W, Zhang Z, Srajer G, et al. Proper expression of the Gcn5 histone acetyltransferase is required for neural tube closure in mouse embryos. Dev Dyn. 2008;237:928–940. doi: 10.1002/dvdy.21479. [DOI] [PMC free article] [PubMed] [Google Scholar]
- Loffredo CA, Wilson PD, Ferencz C, et al. Maternal diabetes: an independent risk factor for major cardiovascular malformations with increased mortality of affected infants. Teratology. 2001;64:98–106. doi: 10.1002/tera.1051. [DOI] [PubMed] [Google Scholar]
- Mikkelsen TS, Ku M, Jaffe DB, et al. Genome-wide maps of chromatin state in pluripotent and lineage-committed cells. Nature. 2007;448:553–560. doi: 10.1038/nature06008. [DOI] [PMC free article] [PubMed] [Google Scholar]
- Mills JL. Malformations in infants of diabetic mothers. Teratology. 1982;25:385–394. doi: 10.1002/tera.1420250316. [DOI] [PubMed] [Google Scholar]
- Pavlinkova G, Salbaum JM, Kappen C, et al. Wnt signaling in caudal dysgenesis and diabetic embryopathy. Birth Defects Res A Clin Mol Teratol. 2008;82:710–719. doi: 10.1002/bdra.20495. [DOI] [PMC free article] [PubMed] [Google Scholar]
- Pavlinkova G, Salbaum JM, Kappen C, et al. Maternal diabetes alters transcriptional programs in the developing embryo. BMC Genomics. 2009;10:274. doi: 10.1186/1471-2164-10-274. [DOI] [PMC free article] [PubMed] [Google Scholar]
- Reece EA. Maternal fuels, diabetic embryopathy: pathomechanisms and prevention. Semin Reprod Endocrinol. 1999;17:183–194. doi: 10.1055/s-2007-1016225. [DOI] [PubMed] [Google Scholar]
- Reece EA, Eriksson UJ. The pathogenesis of diabetes-associated congenital malformations. Obstet Gynecol Clin North Am. 1996;23:29–45. doi: 10.1016/s0889-8545(05)70243-6. [DOI] [PubMed] [Google Scholar]
- Rosenfeld JA, Wang Z, Schones DE, et al. Determination of enriched histone modifications in non-genic portions of the human genome. BMC Genomics. 2009;10:143. doi: 10.1186/1471-2164-10-143. [DOI] [PMC free article] [PubMed] [Google Scholar]
- Sakamaki H, Akazawa S, Ishibashi M, et al. Significance of glutathione-dependent antioxidant system in diabetes-induced embryonic malformations. Diabetes. 1999;48:1138–1144. doi: 10.2337/diabetes.48.5.1138. [DOI] [PubMed] [Google Scholar]
- Salbaum JM, Kappen C. Neural tube defect genes and maternal diabetes during pregnancy. Birth Defects Res A Clin Mol Teratol. 2010;88:601–611. doi: 10.1002/bdra.20680. [DOI] [PMC free article] [PubMed] [Google Scholar]
- Salbaum JM, Kappen C. Diabetic embryopathy: a role for the epigenome? Birth Defects Res A Clin Mol Teratol. 2011;91:770–780. doi: 10.1002/bdra.20807. [DOI] [PMC free article] [PubMed] [Google Scholar]
- Stephens E, Thureen PJ, Goalstone ML, et al. Fetal hyperinsulinemia increases farnesylation of p21 Ras in fetal tissues. Am J Physiol Endocrinol Metab. 2001;281:E217–E223. doi: 10.1152/ajpendo.2001.281.2.E217. [DOI] [PubMed] [Google Scholar]
- Suka N, Suka Y, Carmen AA, et al. Highly specific antibodies determine histone acetylation site usage in yeast heterochromatin and euchromatin. Mol Cell. 2001;8:473–479. doi: 10.1016/s1097-2765(01)00301-x. [DOI] [PubMed] [Google Scholar]
- Szerlong HJ, Prenni JE, Nyborg JK, et al. Activator-dependent p300 acetylation of chromatin in vitro: enhancement of transcription by disruption of repressive nucleosome-nucleosome interactions. J Biol Chem. 2010;285:31954–31964. doi: 10.1074/jbc.M110.148718. [DOI] [PMC free article] [PubMed] [Google Scholar]
- Visel A, Blow MJ, Li Z, et al. ChIP-seq accurately predicts tissue-specific activity of enhancers. Nature. 2009;457:854–858. doi: 10.1038/nature07730. [DOI] [PMC free article] [PubMed] [Google Scholar]
- Wagschal A, Sutherland HG, Woodfine K, et al. G9a histone methyltransferase contributes to imprinting in the mouse placenta. Mol Cell Biol. 2008;28:1104–1113. doi: 10.1128/MCB.01111-07. [DOI] [PMC free article] [PubMed] [Google Scholar]
- Waller DK, Mills JL, Simpson JL, et al. Are obese women at higher risk for producing malformed offspring? Am J Obstet Gynecol. 1994;170:541–548. doi: 10.1016/s0002-9378(94)70224-1. [DOI] [PubMed] [Google Scholar]
- Waterland RA, Jirtle RL. Transposable elements: targets for early nutritional effects on epigenetic gene regulation. Mol Cell Biol. 2003;23:5293–5300. doi: 10.1128/MCB.23.15.5293-5300.2003. [DOI] [PMC free article] [PubMed] [Google Scholar]
- Watkins ML, Rasmussen SA, Honein MA, Botto LD, Moore CA. Maternal obesity and risk for birth defects. Pediatrics. 2003;111:1152–1158. [PubMed] [Google Scholar]
- Wellen KE, Hatzivassiliou G, Sachdeva UM, et al. ATP-citrate lyase links cellular metabolism to histone acetylation. Science. 2009;324:1076–1080. doi: 10.1126/science.1164097. [DOI] [PMC free article] [PubMed] [Google Scholar]
- Wentzel P, Wentzel CR, Gareskog MB, et al. Induction of embryonic dysmorphogenesis by high glucose concentration, disturbed inositol metabolism, and inhibited protein kinase C activity. Teratology. 2001;63:193–201. doi: 10.1002/tera.1034. [DOI] [PubMed] [Google Scholar]
- Yao TP, Oh SP, Fuchs M, et al. Gene dosage-dependent embryonic development and proliferation defects in mice lacking the transcriptional integrator p300. Cell. 1998;93:361–372. doi: 10.1016/s0092-8674(00)81165-4. [DOI] [PubMed] [Google Scholar]
- Zaken V, Kohen R, Ornoy A, et al. Vitamins C and E improve rat embryonic antioxidant defense mechanisms in diabetic culture medium. Teratology. 2001;64:33–44. doi: 10.1002/tera.1045. [DOI] [PubMed] [Google Scholar]
- Zang C, Schones DE, Zeng C, et al. A clustering approach for identification of enriched domains from histone modification ChIP-Seq data. Bioinformatics. 2009;25:1952–1958. doi: 10.1093/bioinformatics/btp340. [DOI] [PMC free article] [PubMed] [Google Scholar]
Associated Data
This section collects any data citations, data availability statements, or supplementary materials included in this article.