Abstract
Care must be exercised in the use of Raman spectroscopy for the identification of blood in forensic applications. The 785 nm excited Raman spectra of dried whole human blood are shown to be exclusively due to oxyhemoglobin (oxyHb) or related hemoglobin denaturation products. Raman spectra of whole blood are reported as a function of incident 785 nm laser power and features attributable to heme aggregates are observed for fluences on the order of 104 W/cm2 and 20 sec signal collection times. In particular, the formation of this local heating induced heme aggregate product is indicated by a red-shifting of several heme porphyrin ring vibrational bands, the appearance of a large broad band at 1248 cm−1, the disappearance of the Fe-O2 stretching and bending bands, and the observation of a large overlapping fluorescence. This denaturation product is also observed in the low power excited Raman spectrum of older ambient air exposed bloodstains (≥ two weeks). The 785 nm excited Raman spectrum of methemoglobin whole blood is reported and increasing amounts of this natural denaturation product can also be identified in dried whole blood Raman spectra particularly when the blood has been stored prior to drying. These results indicate that to use 785 nm excited Raman spectra as an identification methodology for forensic applications to maximum effectiveness, incident laser powers need to be kept low to eliminate variable amounts of heme aggregate spectral components contributing to the signal and the natural aging process of hemoglobin denaturation needs to be accounted for. This also suggests that there is a potential opportunity for 785 nm excited Raman to be a sensitive indicator of dried bloodstain age at crime scenes.
Keywords: Raman Spectroscopy, Bioanalytical methods, Biological samples, Forensics
Introduction
Raman spectroscopy is a technique that has just recently been recognized as a potentially useful method in the field of forensic science. This optical methodology has proven successful for the identification of a variety of materials relevant to forensic investigations such as inks,1 paints,2 fibers,3, 4 illicit drugs,5 explosives6 and gunshot residue.7 In the past few years, the use of Raman spectroscopy to identify human body fluids, an important component of many crime scene investigations, has been proposed and demonstrated.8–17 As shown in these prior preliminary reports, Raman spectroscopic analysis is particularly attractive for forensic purposes because it allows nondestructive, rapid, on-site, specific and low cost identification of body fluids, and requires only minimal sample size. Identification is accomplished by comparison of the in situ acquired Raman spectrum of the interrogated potential fluid with a library of previously obtained human body fluid Raman spectra. Statistical analysis procedures can then be used to provide a match to the suspected body fluid type for confirmatory identification.10, 11, 15 Thus, the ability to acquire robust and reproducible Raman vibrational signatures is essential for the successful application of this methodology for forensic purposes. Although not essential for body fluid identification, it is also useful to know the chemical origins of these vibrational spectral signatures so that any fundamental limitations for identification purposes arising from biochemical activity or subsequent degradation processes are properly recognized.
Human blood is probably the body fluid most commonly encountered at a crime scene. In prior studies of the near infrared (NIR) excited Raman spectrum of dried whole blood several molecular components were identified via principal component analysis (PCA), and a corresponding methodology based on statistical analysis techniques was developed allowing human blood identification.12, 14, 15 The three main components consistently found to contribute to the observed 785 nm excited dried blood Raman spectrum were identified as hemoglobin, fibrin and a broad fluorescence background.10–12, 14 The hemoglobin contribution is expected given that 33% of red blood cells (RBCs) are hemoglobin by volume. The second molecular component of the dried blood spectrum identified in the prior work was attributed to the Raman bands of fibrin, the protein involved with the clotting of blood. The basis of this assignment was the resemblance of this component to the spectrum of fibrin and the reported spectral differences between the liquid and dried blood Raman spectra.12 Furthermore, the 785 nm excited Raman spectra of whole blood samples showed a large heterogeneity in the relative contributions of these three components to the dried blood spectrum in these prior studies thus complicating the identification of this body fluid by Raman spectroscopy. However, a statistical procedure was developed to account for this inhomogeneity and thus provide identification via Raman of this body fluid type.10–12
In a previous study primarily describing the surface enhanced Raman spectroscopy (SERS) of whole human blood and red blood cells, we compared normal (non-SERS) Raman spectra of whole blood to SERS spectra of the same blood samples excited at 785 nm.18 For low incident laser powers we showed that the normal (non-SERS) Raman spectrum of fresh whole dried blood is essentially identical to the Raman spectrum of red blood cells (RBCs). Every vibrational feature observed in the Raman spectra of whole blood excited at 785 nm could be found in the corresponding Raman spectra of RBCs.18 Thus, this prior work already called into question the interpretation of the 785 nm excited Raman spectrum of whole blood as arising from non-heme contributions.12 More specifically, we demonstrate here that the second component tentatively identified in the earlier Raman studies of whole human blood as due to fibrin12 is the signature of a photodegradation heme aggregation product produced by high excitation fluences.
Furthermore, as for any biological sample removed from its in vivo environment, naturally occurring degradation or denaturation processes in vitro may contribute to the heterogeneity of observed Raman signals of a bloodstain sample. The effects of ambient exposure and aging could contribute a time dependent heterogeneous component in blood that could also offer challenges for blood identification by a variety of physical techniques. Whole blood components arising from the auto-oxidation of oxyhemoglobin (oxyHb) to the non-dioxygen binding methemoglobin (metHb) and additional denaturation products known as hemichromes have been recently described.19 A steady state population corresponding to ~2% of the hemoglobin (Hb) in normal human blood is in the high spin metHb form. Outside of the body and in the ambient environment, the relative amount of this heme oxidation product changes with time.19 Changes in the Raman spectrum of whole blood with time was noted in a previous 532 nm excitation study.17 However, the NIR excitation employed here is further from regions of electronic resonance for Hb and its denaturation products. Thus, spectral changes due to Hb degradation or denaturation may contribute very differently at these NIR Raman excitation wavelengths.
The results described here illustrate that care must be taken to use reduced incident powers to avoid optically induced thermal degradation effects in whole blood and the products of natural Hb aging in the ambient environment can be detected in dried whole blood. However, these effects do not preclude the use of Raman spectroscopy to be an effective platform for identification of whole human bloodstains when low laser power conditions are employed and the signatures of the expected in vitro “aging” products are known and incorporated into data analysis methodologies.
Experimental
Sample preparations
Following standard protocols, 5 mL of blood was collected by venipuncture from healthy donors into vacutainer blood collection tubes containing EDTA as an anticoagulant (BD, Franklin Lakes, NJ). Blood samples were stored in an 8 °C refrigerator immediately after collection until required for measurements or additional separation steps. MetHb whole blood was prepared by mixing 1mL of whole blood with 10 mL of 0.1 wt % sodium nitrite in PBS (phosphate buffered saline) and incubating for one hour at room temperature. Conversion to metHb was confirmed by UV/Vis absorption change. Following previous procedures,18, 20 metRBCs were prepared from a centrifugation (1 min at 10000 rpm) concentrated RBC sample. 10 μL of concentrated RBCs were suspended in 10 ml of 0.1% (by wt.) sodium nitrite in PBS and incubated for one hour at room temperature. MetRBCs were recovered after centrifugation and washed three times with saline before re-suspending in 0.5 mL of saline before Raman data acquisition. The dried RBC pellet was made by drying 50 μL of packed RBCs on a silicon wafer.
Raman spectral data acquisition
An RM-2000 Renishaw Raman microscope employing a 20x (short working distance) objective and 785 nm excitation was used to obtained all of the spectra shown here. The Raman illumination area is ~100 μm2 (5μ x 20μ). Dried whole blood spectra were typically obtained from a drop of blood that has been placed on a silicon wafer, open to the ambient air and allowed to dry for about 1 hour. The 520 cm−1 band of a silicon wafer was used for frequency calibration. 1.8 mW of incident 785 nm laser power and 20 sec data accumulation times are used to acquire Raman spectra in order to avoid any photo-induced thermal effects as described further below.
Results
785 nm incident power dependence
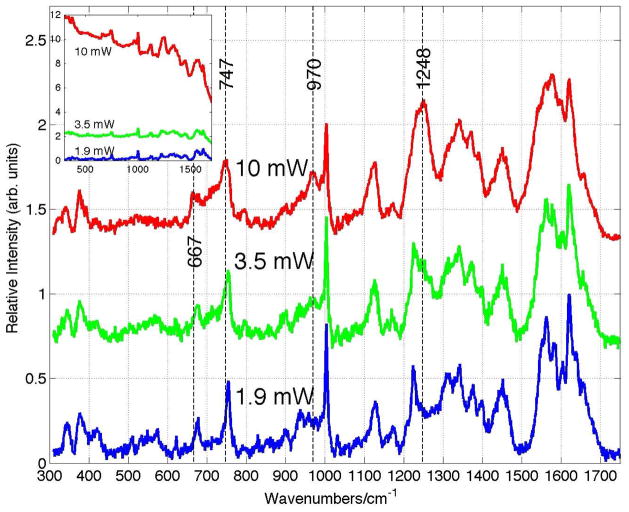
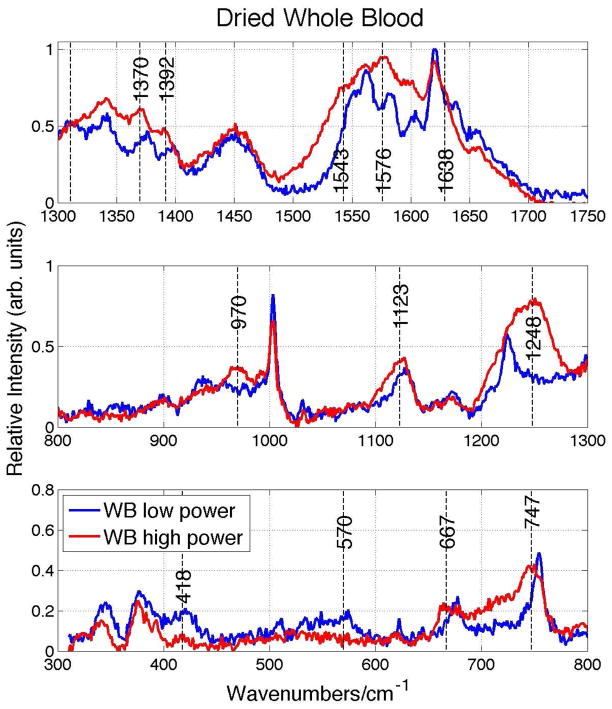
The Raman spectra of whole blood dried for one hour after being stored at 8 °C for ~24 hours as a function of incident 785 nm laser power are shown in Fig. 1. Each displayed spectrum is the average of 5 scans and has been background corrected, i.e. any broad overlapping fluorescence emission component has been removed. Changes in the appearance of the dried whole blood Raman spectrum are evident as the incident laser power is increased from 1.9 mW, corresponding to a fluence of ~1.9 x 10³ W/cm2, to 10 mW or a fluence of ~1.0 x 10⁴ W/cm2. A more direct comparison of the relative vibrational band positions and intensities of dried whole blood spectrum at the low (1.9mW) and high (10 mW) Raman excitation powers is shown in Fig. 2. New vibrational bands at 970 and 1248 cm−1 are observed, and several other vibrational bands shift 5 – 10 cm−1 to lower frequency as the incident fluence at 785 nm is increased to the 104 W/cm2 level. For example, bands at 677 (ν7), 754 (ν15), 1128 (ν5), 1374 (ν4), 1398 (ν20), 1549 (ν11), 1582 (ν37) and 1639 (ν10) cm−1 at 1.9 mW down shift to 667, 747, 1123, 1370, 1392, 1543, 1576 and 1629 cm−1 when the incident power is 10 mW. These are all vibrational modes that are due to the porphyrin moiety of the oxyhemoglobin (oxyHb) protein and their vibrational assignments21–23 are indicated above. In addition, bands associate with Fe-O2 stretching (570 cm−1) and bending (418 cm−1) are greatly reduced in intensity in the high fluence spectrum (Figs. 1 and 2). The observed frequency changes, vibrational assignments and corresponding local coordinate motion for the modes affected by the high power laser excitation are summarized in Table 1. Furthermore, as seen in the inset of Fig. 1, a large increase in the fluorescence background that overlaps the Raman emission region is also observed in the 785 nm excited dried whole blood spectrum as the laser excitation power is increased to 10 mW.
Figure 1.
Power/fluence dependence of 785 nm excited Raman spectra of dried whole human blood. The Raman spectrum on top of the observed fluorescence as a function of incident laser power is shown in the inset. Spectral changes at 667, 747, 970 and 1248 cm−1 are highlighted by vertical lines. The whole blood was stored at 8 °C for about 2 weeks before drying in the ambient for ~2 hours. The Raman illuminated area is 100 μm2 corresponding to incident laser fluences of 1.9x10³ (1.9 mW), 3.5x10³ (3.5 mW) and 1.0x10⁴ W/cm2 (10 mW) at 785 nm for the three spectra.
Figure 2.
Expanded view of 785 nm excited dried whole blood spectrum at low and high laser powers shown in Fig. 1.
Table 1.
Vibrational bands of whole blood and RBCs affected by high laser fluence.
| Low power spectrum (cm−1)b | High power spectrum (cm−1)b | Vibrational Assignmenta | Local coordinate |
|---|---|---|---|
| 419 | _ | δ(Fe-O2) | Fe-O2 bend |
| 570 | _ | ν(Fe-O2) | Fe-O2 stretch |
| 677 | 667 | ν7 | ν(pyr deform)sym |
| 754 | 747 | ν15 | ν(pyr breathing) |
| _ | 970 | γ(CαH=)? | |
| 1128 | 1123 | ν5 | ν(Cβ-methyl) |
| _ | 1248 | ν13 or ν42 | δ(CmH) |
| 1311 | _ | ν21 | δ(CmH) |
| 1374 | 1370 | ν4 | ν(pyr half-ring)sym |
| 1398 | 1392 | ν20 | ν(pyr quarter-ring) |
| 1549 | 1543 | ν11 | ν(CβCβ) |
| 1582 | 1576 | ν37 | ν(CβCm)asym |
| 1638 | 1629 | ν10 | ν(CβCm)asym |
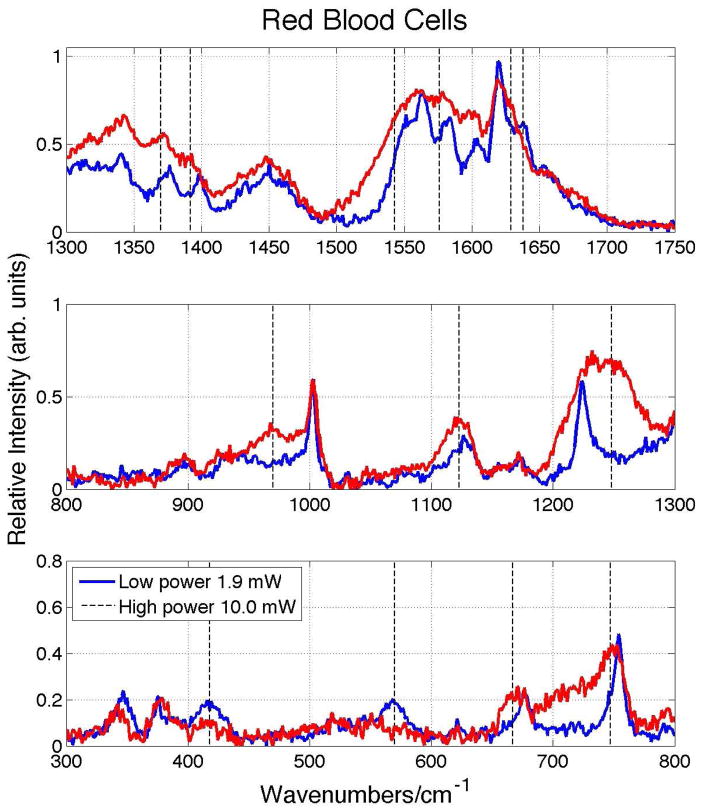
We have previously shown that all the bands observed in the 785 nm excited low power Raman spectrum of dried human blood were also observed in the corresponding Raman spectra of isolated red blood cells (RBCs) and could be assigned to oxyHb more specifically.18 This was also the conclusion of an earlier 720 nm excited Raman study of whole blood.24 Further evidence that all the features of the NIR spectrum of whole blood are attributable to oxyHb result from a comparison of the incident Raman excitation power dependence of dried whole blood and RBCs. As shown in Fig. 3, the spectral changes observed in the 785 nm excited Raman spectrum of RBCs as the incident power is raised from 1.9 mW to 10 mW are identical to those seen for whole blood (Fig. 2). Specifically, the appearance of bands at 970 cm−1 and 1248 cm−1, the disappearance of the Fe-O2 stretch (570 cm−1) and bend (418 cm−1), and the red-shift of the ν7, ν15, ν4, ν20, ν11, ν37 and ν10 oxyHb bands are analogously seen in the high incident (10 mW) laser power excited RBC Raman spectra. Thus these features can have nothing to do with blood components other than Hb as discussed further below.
Figure 3.
Raman spectra of 785 nm excited red blood cells (RBCs) at low (1.9 mW) and high (10 mW) laser power. These spectra are essentially identical to those corresponding to the power dependent 785 nm excited Raman spectra of dried whole blood (Figs. 1 and 2).
The effects of high incident laser power and/or prolonged laser excitation of RBCs at red, 632.8 nm,25 and NIR, 785 nm,21 wavelengths have been previously reported. In agreement with the spectral changes described above, vibrational bands at 1396, 1365, 1248, 972, and 662 cm−1 were identified as features due to prolonged laser excitation, high excitation power or sample heating (>42 °C) in these previous studies of RBCs.21, 25 These vibrational changes were attributed to the formation of hemoglobin aggregates resulting from thermal or photo-induced protein (Hb) denaturation. As shown in Figs. 1 and 2 and Table 1, bands at these nearly identical frequencies are seen in the 10 mW spectra of whole blood and indicate that these same heme aggregation products are formed in response to high Raman excitation fluences in dried whole blood samples. In the prior RBC Raman reports the appearance of new bands and the changes in intensity of several others are highlighted,21, 25 however this study more carefully shows that spectral red shifts are noted for an number of these bands in addition to the appearance of these new vibrational features and some changes in relative intensities. The concurrent appearance of a dramatically increasing fluorescence component in the 785 nm excited spontaneous emission (Fig. 1 inset) and the red-shifting of the heme vibrational bands described above is consistent with changes in electronic structure due to aggregation. Furthermore, the significant decrease in the observed intensity of the Fe-O2 stretch and bend bands at 570 cm−1 and 418 cm−1, respectively, indicates that O2 is no longer ligated to Fe in the thermally produced heme aggregates. The ν10 band at 1638 cm−1 in oxyHb, which has ν(CαCm)asym local coordinate character,21 is a dioxygen marker band and is known to weaken and red-shift in deoxygenated Hb.21 Similarly, the ν7 band at 677 cm−1 is another vibrational frequency that red-shifts when oxygen is no longer ligated to Fe.25 Thus, these observations are consistent with the loss of dioxygen in this heme aggregate photo/thermal complex resulting from excessive 785 nm laser irradiation.
Blood aging effects
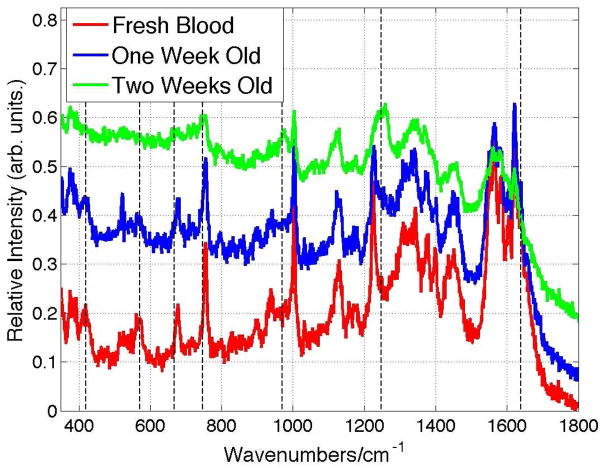
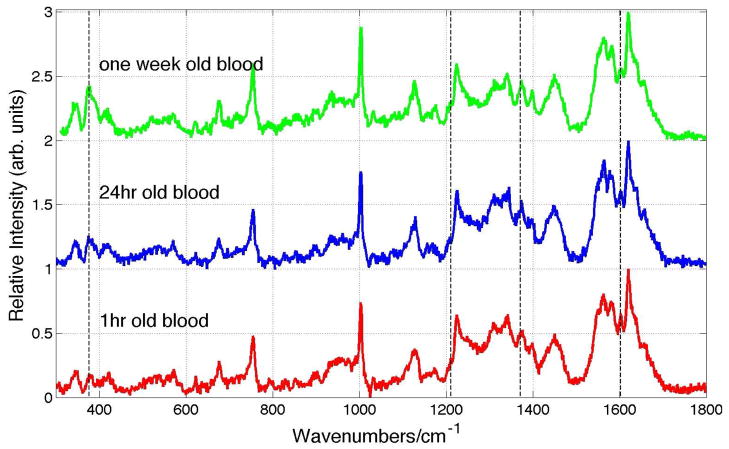
In addition to the consequences of high incident NIR laser fluence for Raman spectral signal acquisition of dried blood, the effects of whole blood age has not been fully considered or carefully demonstrated for the use of Raman spectroscopy as a sensitive identification methodology in forensic applications.8, 9, 12, 14, 15 As noted above, some spectral changes with blood age were reported in a prior 532 nm Raman study.17 Whole blood age may be considered both in terms of length of time a dried fresh whole blood stain has been exposed to ambient air or the age of a stored liquid whole blood sample before drying 1 – 2 hours preceding sample acquisition. The effects of exposure to ambient conditions for a dried blood sample that has been prepared from fresh whole human blood (~1 hour after acquisition) is shown in Fig. 4 for exposure times of up to two weeks. The 785 nm excited spectrum of a dried whole blood sample after approximately two weeks exhibits the same vibrational features that are observed at high laser powers; new bands at 667, 747 and, most obvious, 1248 cm−1 appear. In addition, bands at 419, 570 and 1638 cm−1, all Fe-O2 markers, disappear in the 785 nm excited Raman spectrum of the two week old blood. All of the dried blood spectra shown in Fig. 4 have been obtained with low laser power (1.9 mW, 20x). Thus the same oxyhemoglobin denaturation product attributed to heme aggregates resulting from high laser power incident on fresh dried whole blood samples results when dried blood is exposed to ambient conditions for about two weeks.
Figure 4.
Fluorescence and Raman emission of dried whole blood excited at low 785 nm power (1.9 mW) as a function of exposure time to ambient. Vertical lines highlight the appearance of bands at 667, 747, 970, 1248 and 1629 in these low power spectra. These same features are seen in the high power excited Raman spectra of “fresh” dried whole blood. (See Fig. 1.)
Furthermore, hemoglobin undergoes chemical changes as soon as it leaves the human body.19 About 1 – 2 % of oxyhemoglobin (low spin Fe+3) in the blood of normal healthy human bodies is auto-oxidized to methemoglobin (metHb) (high spin Fe+3) and water takes the place of the dioxygen site. MetHb does not bind dioxygen and its concentration is maintained at this low level in vivo by the reduction of metHb back to Hb by the reductase protein cytochrome b5.26 Upon blood exiting the body, the contact with oxygen in the ambient environment and the decreasing availability of cytochrome b5 for reduction back to Hb leads to an increase in metHb concentration and other Hb denaturation products such as hemichrome.19 Thus, it can be anticipated that the Raman signature of whole blood could exhibit an additional inhomogeneity due to the relative amount of metHb in the dried sample resulting from the storage time of the liquid blood, in addition to the auto-oxidation and subsequent denaturation taking place in the dried blood sample as a function of drying time. Depending on the extent of the Raman spectral differences between the oxyHb and metHb at 785 nm, this denaturation process could have an impact on the use of Raman for body fluid identification. In our prior study of blood, small differences were clearly recognizable when the 785 nm normal Raman spectra of oxy- and metHb were compared.18
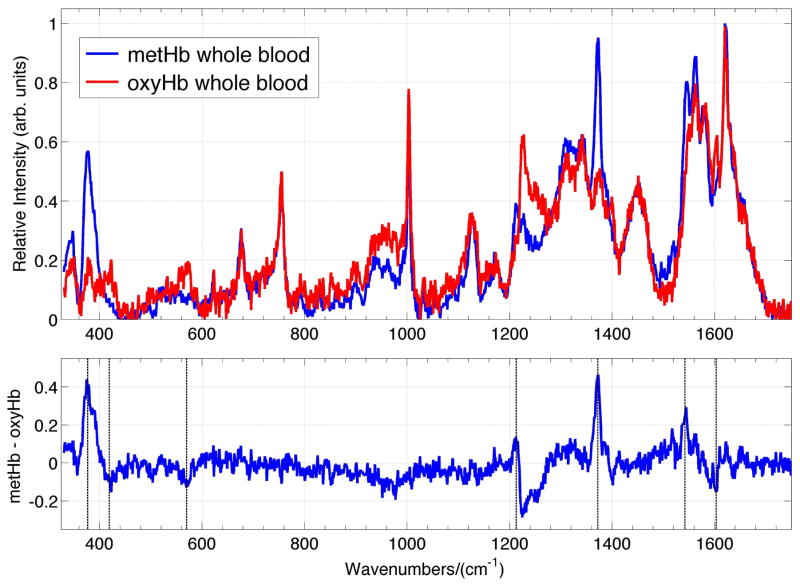
The low power (1.9 mW), 785 nm excited Raman spectrum of dried whole blood, with its oxyHb fully converted to metHb, is shown in Fig. 5. This Raman spectrum is compared to the corresponding dried normal oxyHb whole blood sample in this figure. Both of these dried blood samples have been exposed to the ambient atmosphere for ~1–2 hours before signal acquisition. Firstly, comparison of the 785 nm Raman spectrum of met whole blood (Fig. 5) with our previously observed spectrum of metRBC18 shows that these two Raman signatures are virtually identical. This further verifies that the Raman spectrum of whole blood is derived exclusively from its hemoglobin population. Although many of the vibrational features of oxy- and met whole blood are the same, a number of clearly distinguishable features are evident (Fig. 5) as found for the RBCs.18 A met whole blood – oxy whole blood spectrum is given in the lower panel of Fig. 5. For example, a vibrational band at 377 cm−1 in the dried metHb whole blood (and metRBC) spectrum is perhaps the most distinctive change in the 785 nm excited Raman spectrum to indicate the presence of the high-spin ferric heme protein. Additional spectroscopic differences in the metHb whole blood spectra are increased intensity and 2–3 cm−1 red-shift of the ν4 band appearing at 1372 cm−1 in the met whole blood. Additional spectral changes in the met dried blood spectrum are an increase in the intensity of the 1213 cm−1 band, the decrease of the 1603 cm−1 ν(C=C)vinyl and 1224 cm−1 (ν13 or ν42) bands, and the absence of the Fe-O2 stretch (570 cm−1) and bend (419 cm−1) bands relative to the whole blood spectrum containing primarily oxyHb (see Fig. 5).
Figure 5.
Comparison of 785 nm excited Raman spectra of oxyhemoglobin (oxyHb) whole blood and methemoglobin (metHb) whole blood (upper panel). These samples have been dried for about 1 – 2 hours. The metHB – oxyHb whole blood Raman difference spectrum is displayed in the lower panel. Each spectrum has been normalized by the intensity of the 1620 cm−1 prior to subtraction. Prominent bands that show changes in intensity on the formation of metHb from oxyHb (377, 419, 570, 1211, 1372 and 1602 cm−1) are indicated by vertical lines.
Consequences of this naturally occurring auto-oxidation process resulting in the conversion of oxyHb to metHb are illustrated in Fig. 6. 785 nm excited Raman spectra of whole human blood that has been stored in liquid form at 8 °C for one hour, 24 hours and two weeks and then dried in the ambient environment for ~1–2 hours are shown in this figure. These spectra have all been acquired with low incident laser power (1.9 mW, 20x). Relatively subtle but clearly distinguishable changes are evident in these spectra as a function of the storage time. The increase in intensity of the characteristic metHb feature at 377 cm−1 is observed. This change, as well as a small increase of the 1372 cm−1 and 1213 cm−1 bands, and a slight decrease in the 1603 cm−1 region are all consistent with increasing concentrations of metHb (Fig. 5) in the whole blood as a function of storage time.
Figure 6.
785 nm (1.9 mW) excited Raman spectrum of whole dried blood as a function of storage time at 8 °C. Bands changes at 377, 1211, 1372 and 1603 cm−1 are indicated.
Discussion
The results described above illustrate that the Raman signature of whole human blood is a function of the incident laser power above a threshold fluence (> ~2 x 10³ W/cm2), as well as the age of the blood both before and after it is dried. These factors need to be considered before Raman spectroscopy can be applied to its maximum effectiveness as a blood identification methodology for forensic applications. In previous studies exploring the use of Raman for body fluid identification, the effects of high laser power and blood aging can be detected in the published Raman spectra of dried whole human blood. For example, in the 752.6 nm (100x objective, 5 mW) excited Raman spectrum of whole blood reported by De Wael and coworkers8 vibrational bands at 1248, 971, 747, 666 cm−1 clearly indicate that the previously published spectrum has large contributions from heme aggregates (Figs. 1 and 2 and Table 1). This does not seem surprising given the excitation fluence resulting from the tight focus of the 100x objective employed in that study. The 377 cm−1 band, characteristic of auto-oxidation products, such as metHb, exhibits relatively low intensity in this published spectrum8 indicating that such naturally occurring denaturation products are not extensive in this interrogated dried blood sample.
As referenced above, Lednev and coworkers have pioneered the use of Raman spectroscopy for body fluid identification in forensic science.9–15 On the basis of a principal component analysis it was concluded that each 785 nm excited Raman spectrum of dried whole blood can be composed of variable amounts of predominantly three components, hemoglobin, fibrin and a fluorescence component.12, 15 These three components captured 99% of the variance. The fibrin component is primarily distinguished by bands at ~970, 1248 and 1342 cm−1 and a very broad feature with a width ~100 cm−1 peaked at 1575 cm−1. These spectroscopic features are all evident in the high power spectrum of dried whole blood as clearly seen in Figs. 1 and 2. As previously reported and discussed above, the bands at 1248 and 970 cm−1 have been identified as heme aggregation marker bands resulting form thermal or high laser power induced denaturation.21, 25 Thus, the Raman scattering excited by 785 nm of fibrin is the not the origin of this PCA identified component of the dried blood spectrum but instead it is due to a heme aggregate photodegradation product as described above. Furthermore the 785 nm excited fluorescence, the third component identified in the previous whole blood work,12 is an additional signature of this heme aggregation product as shown in Fig. 1 (inset). It was shown that the Raman spectra of dried whole blood from all donors could be fit with variable amounts of these three components. The Raman contribution from the laser induced heme aggregates is nonlinearly dependent on the 785 nm incident laser fluence and thus one might anticipate a considerable variability in these three signal contributions to the observed spectrum due to the inhomogeneity of the local heating effect. Such a large range of signal contribution variability was reported in this earlier work.12
Furthermore, the variable size of the 377 cm−1 band, shown above to be a marker for metHb in whole blood, relative to that due to phenylalanine at 1003 cm−1 or other vibrational bands not effected by the auto-oxidation, is evident in reported dried whole blood spectra discussing the use of Raman for forensic identification purposes.8, 10, 12 This observation indicates that an additional source of heterogeneity in these blood spectra is due to the distribution of the blood sample ages.19
Conclusion
The goal of this report is to indicate that although Raman has a promising future to be a valuable methodology for a rapid, inexpensive, technique for on-site confirmatory identification of human bloodstains, care must be exercised in the implementation of this optical approach. The need for high quality (i.e. good S/N) Raman signatures for reliable detection and identification in forensic applications is understood. However, photoinduced denaturation, even in the nominally non-electronically resonant NIR region of Hb, can readily appear at relatively low fluences (≤ 104 W/cm2) at 785 nm in dried whole blood and result in Raman signals due to heme aggregation. Both of these effects can contribute to spectral inhomogeneity in the Raman signatures used for blood identification via Raman and as well as limits potentially imposed by the concurrent large fluorescence background. Low laser power eliminates these extraneous components and S/N must be compensated by maximized sensitivity in detection. Furthermore, despite the large variety of particles and molecular components that constitute the complex mixture that is dried whole blood, the 785 nm excited Raman spectrum of blood stains is exclusively due to the vibrational components from only a single protein, hemoglobin. The previously reported fibrin component12 is just the vibrational Raman signature due to the heme aggregation product. With sufficient time on the order of weeks, dried blood exposed to the ambient was found to convert to this same denaturation product even in the absence of excessive temperatures or high laser powers at least for the ambient conditions that this dried blood sample was exposed to.
Apart from signal heterogeneity introduced by laser (thermal) induced heme denaturation effects, additional variable whole blood Raman contributions due to the in vitro aging process involving oxyHb should be accounted for in forensic blood identification by Raman-based methodologies. The auto-oxidation of oxyHb to metHb when the blood leaves the human body provides an additional source of spectral heterogeneity which needs to be considered when employing 785 nm Raman spectroscopy for body fluid identification. The metHb spectrum of whole blood is identical to that of metRBCs but exhibits some characteristic vibrational changes from that of whole blood containing oxyHb. Although, this natural blood/heme aging process represents an additional challenge to quantitative Raman identification schemes, it is also an opportunity to expand the use of this methodology for forensic applications. Based on subsequent careful studies, the upside of this time dependent signal contribution complication for confirmatory bloodstain identification is that this in vitro biochemical activity could provide a means for determining the age of blood at crime scenes.17
Acknowledgments
The support of the National Institute of Health (Grant # 1R01AI090815-01) and the UROP program of Boston University (PL support) are gratefully acknowledged.
References
- 1.Mazzella WD, Buzzini P. Raman spectroscopy of blue gel pen inks. for. Sci Int. 2005;152:241–247. doi: 10.1016/j.forsciint.2004.09.115. [DOI] [PubMed] [Google Scholar]
- 2.Suzuki EM, Carrabba M. In situ identification and analysis of automotive paint pigments using line segment excitation Raman spectroscopy: I. Inorganic topcoat pigments. J Forensic Sci. 2001;46:1053–69. [PubMed] [Google Scholar]
- 3.Thomas J, Buzzini P, Massonnet G, Reedy B, Roux C. Raman spectroscopy and the forensics analysis of back/grey and blue cotton fibers part 1: investigation of the effects of varying laser wavelength. For Sci Int. 2005;152:189–197. doi: 10.1016/j.forsciint.2004.08.009. [DOI] [PubMed] [Google Scholar]
- 4.West MJ, Went MJ. Detection of drugs of abuse by Raman spectroscopy. Drug Test Anal. 2011;3:532–8. doi: 10.1002/dta.217. [DOI] [PubMed] [Google Scholar]
- 5.Hargreaves MD, Page K, Munshi T, Tomsett R, Lynch G, Edwards HGM. Analysis of seized drugs using portable Raman spectroscopy in an airport environment—a proof of principle study. Journal of Raman Spectroscopy. 2008;39:873–880. [Google Scholar]
- 6.Moore DS, Scharff RJ. Portable Raman explosives detection. Anal Bioanal Chem. 2009;393:1571–8. doi: 10.1007/s00216-008-2499-5. [DOI] [PubMed] [Google Scholar]
- 7.Bueno J, Sikirzhytski V, Lednev IK. Raman Spectroscopic Analysis of Gunshot Residue Offering Great Potential for Caliber Differentiation. Analytical Chemistry. 2012;84:4334–4339. doi: 10.1021/ac203429x. [DOI] [PubMed] [Google Scholar]
- 8.De Wael K, Lepot L, Gason F, Gilbert B. In search of blood—Detection of minute particles using spectroscopic methods. For Sci Int. 2008;180:37–42. doi: 10.1016/j.forsciint.2008.06.013. [DOI] [PubMed] [Google Scholar]
- 9.Virkler K, Lednev IK. Raman spectroscopy offers great potential for the nondestructive confirmatory identification of body fluids. Forensic Sci Int. 2008;181:e1–5. doi: 10.1016/j.forsciint.2008.08.004. [DOI] [PubMed] [Google Scholar]
- 10.Virkler K, Lednev IK. Blood species identification for forensic purposes using Raman spectroscopy combined with advanced statistical analysis. Anal Chem. 2009;81:7773–7. doi: 10.1021/ac901350a. [DOI] [PubMed] [Google Scholar]
- 11.Sikirzhytski V, Virkler K, Lednev IK. Discriminant analysis of Raman spectra for body fluid identification for forensic purposes. Sensors (Basel) 2010;10:2869–84. doi: 10.3390/s100402869. [DOI] [PMC free article] [PubMed] [Google Scholar]
- 12.Virkler K, Lednev IK. Raman spectroscopic signature of blood and its potential application to forensic body fluid identification. Anal Bioanal Chem. 2010;396:525–34. doi: 10.1007/s00216-009-3207-9. [DOI] [PubMed] [Google Scholar]
- 13.Virkler K, Lednev IK. Forensic body fluid identification: the Raman spectroscopic signature of saliva. Analyst. 2010;135:512–7. doi: 10.1039/b919393f. [DOI] [PubMed] [Google Scholar]
- 14.Virkler K, Lednev IK. Analysis of body fluids for forensic purposes: from laboratory testing to non-destructive rapid confirmatory identification at a crime scene. Forensic Sci Int. 2009;188:1–17. doi: 10.1016/j.forsciint.2009.02.013. [DOI] [PubMed] [Google Scholar]
- 15.Sikirzhytski V, Sikirzhytskaya A, Lednev IK. Multidimensional Raman spectroscopic signatures as a tool for forensic identification of body fluid traces: a review. Appl Spectrosc. 2011;65:1223–32. doi: 10.1366/11-06455. [DOI] [PubMed] [Google Scholar]
- 16.Sikirzhytskaya A, Sikirzhytski V, Lednev IK. Raman spectroscopic signature of vaginal fluid and its potential application in forensic body fluid identification. Forensic Sci Int. 2012;216:44–8. doi: 10.1016/j.forsciint.2011.08.015. [DOI] [PubMed] [Google Scholar]
- 17.Boyd S, Bertino MF, Seashols SJ. Raman spectroscopy of blood samples for forensic applications. Forensic Science International. 2011;208:124–128. doi: 10.1016/j.forsciint.2010.11.012. [DOI] [PubMed] [Google Scholar]
- 18.Premasiri WR, Lee JC, Ziegler LD. Surface-Enhanced Raman Scattering of Whole Human Blood, Blood Plasma, and Red Blood Cells: Cellular Processes and Bioanalytical Sensing. The Journal of Physical Chemistry B. 2012;116:9376–9386. doi: 10.1021/jp304932g. [DOI] [PMC free article] [PubMed] [Google Scholar]
- 19.Bremmer RH, de Bruin DM, de Joode M, Buma WJ, van Leeuwen TG, Aalders MCG. Biphasic Oxidation of Oxy-Hemoglobin in Bloodstains. PLoS ONE. 2011;6:e21845. doi: 10.1371/journal.pone.0021845. [DOI] [PMC free article] [PubMed] [Google Scholar]
- 20.Wood BR, Tait B, McNaughton D. Micro-Raman characterisation of the R to T state transition of haemoglobin within a single living erythrocyte. Biochim Biophys Acta. 2001;1539:58–70. doi: 10.1016/s0167-4889(01)00089-1. [DOI] [PubMed] [Google Scholar]
- 21.Wood BR, Caspers P, Puppels GJ, Pandiancherri S, McNaughton D. Resonance Raman spectroscopy of red blood cells using near-infrared laser excitation. Anal Bioanal Chem. 2007;387:1691–703. doi: 10.1007/s00216-006-0881-8. [DOI] [PubMed] [Google Scholar]
- 22.Hu S, Smith KM, Spiro TG. Assignment of Protoheme Resonance Raman Spectrum by Heme Labeling in Myoglobin. Journal of the American Chemical Society. 1996;118:12638–12646. [Google Scholar]
- 23.Abe M, Kitagawa T, Kyogoku Y. Resonance Raman spectra of octaethylporphyrinato-Ni(II) and meso-deuterated and 15N substituted derivatives. II. A normal coordinate analysis. J Chem Phys. 1978;69:4526–4534. [Google Scholar]
- 24.Sato H, Chiba H, Tashiro H, Ozaki Y. Excitation wavelength-dependent changes in Raman spectra of whole blood and hemoglobin: comparison of the spectra with 514.5-, 720-, and 1064-nm excitation. J Biomed Opt. 2001;6:366–70. doi: 10.1117/1.1380668. [DOI] [PubMed] [Google Scholar]
- 25.Wood BR, Hammer L, Davis L, McNaughton D. Raman microspectroscopy and imaging provides insights into heme aggregation and denaturation within human erythrocytes. Journal of Biomedical Optics. 2005;10:014005–13. doi: 10.1117/1.1854678. [DOI] [PubMed] [Google Scholar]
- 26.Shikama K. The Molecular Mechanism of Autoxidation for Myoglobin and Hemoglobin:‚ A Venerable Puzzle. Chemical Reviews. 1998;98:1357–1374. doi: 10.1021/cr970042e. [DOI] [PubMed] [Google Scholar]


